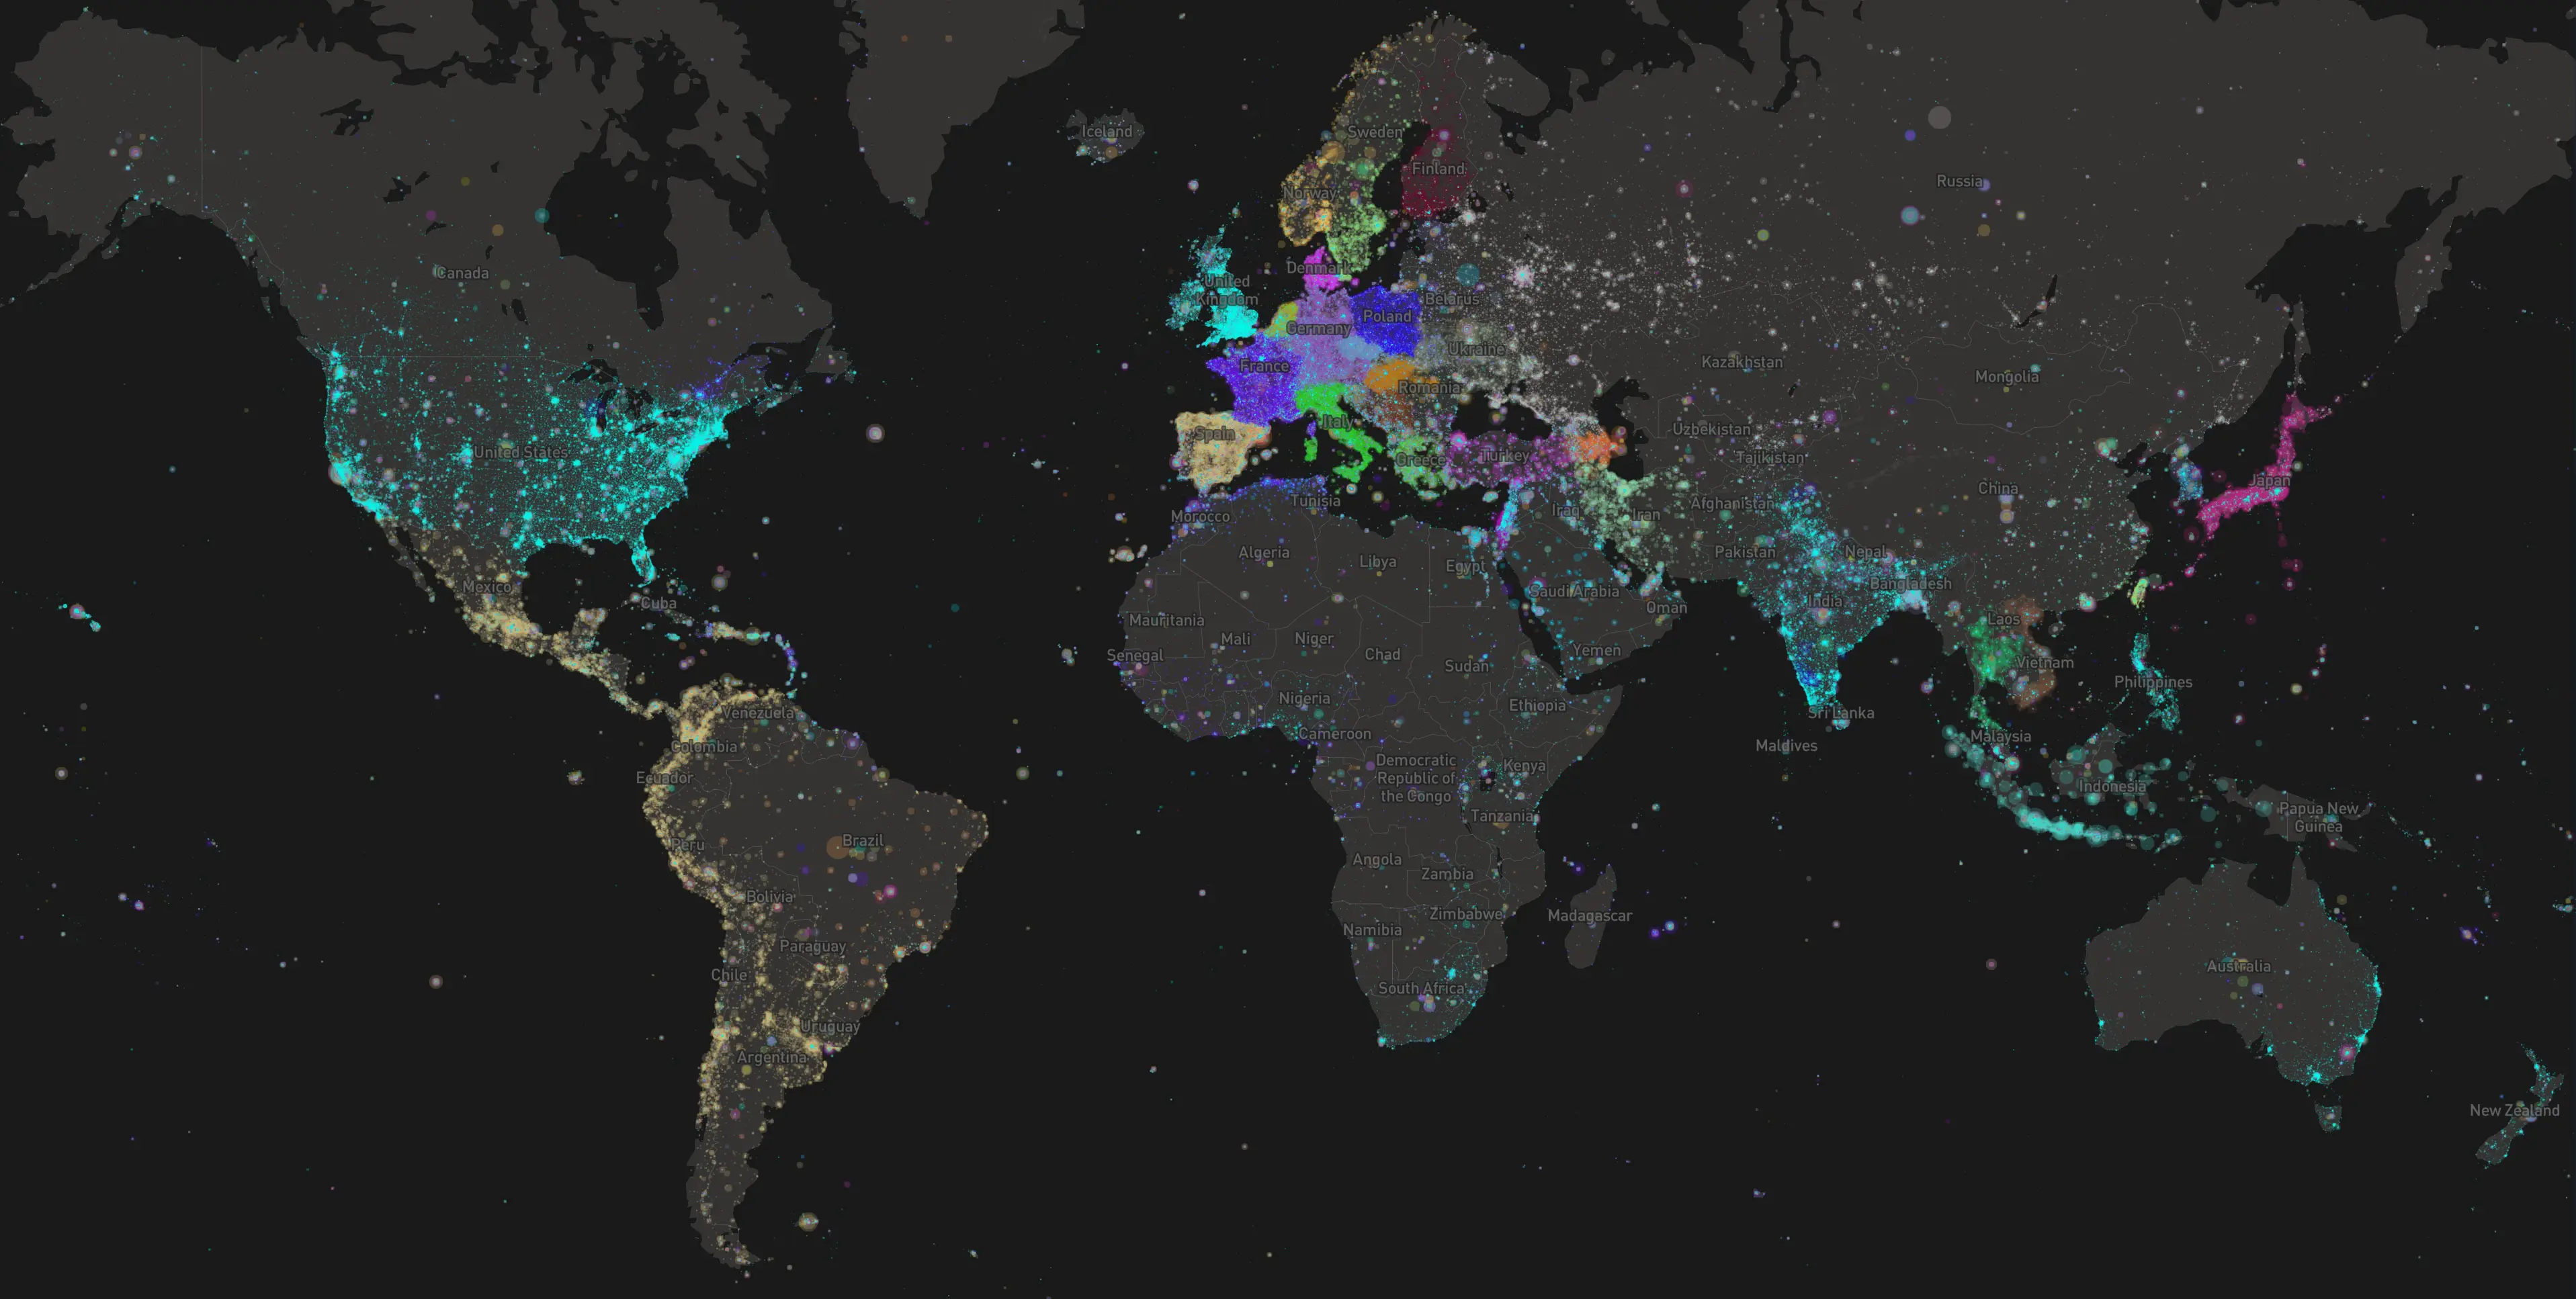
Exploring collective attentions
Humanities and Social Sciences are not immune to the intense dynamics of digitisation of data, their analysis and the means of their transmission. The tracking of social practices is also an opportunity to better understand the powerful social, economic and political change that has taken place in recent years. In order to contribute to the enhancement and clarification of this issue for humanities and social sciences, we propose to focus on one of its most emblematic demonstrations, in addition to being one of the most visited Internet sites: Wikipedia.
This exploratory project aims to extend the initiatives that have contributed to making Wikipedia more accessible and intelligible, by simplifying the exploitation of its potential. In particular, this project focuses on valuing the traces of the consultation of the pages, as so many elementary acts that involve collective attention and inform us of what matters. More specifically, by considering languages, time and space, it is thus possible to better characterise regimes of attention and the relative globality of social facts (attacks, elections, conspiracy theories, controversies, sports or cultural events...).
Time
10 years of data
2016–2025 ≃ 3650 days
Languages
40 editions of Wikipedia
99% of pageviews
English, French, Spanish, German, Russian, Italian, Portuguese, Japanese, Chinese...
Spatial
Geographical, intertextual
and hypertextual
≃ 20 million pages
Data
≃ 85 billion data points
daily pageviews
over 10 years and 40 editions
Without counting texts,
hyperlinks and language links
Language 2008–2020 version
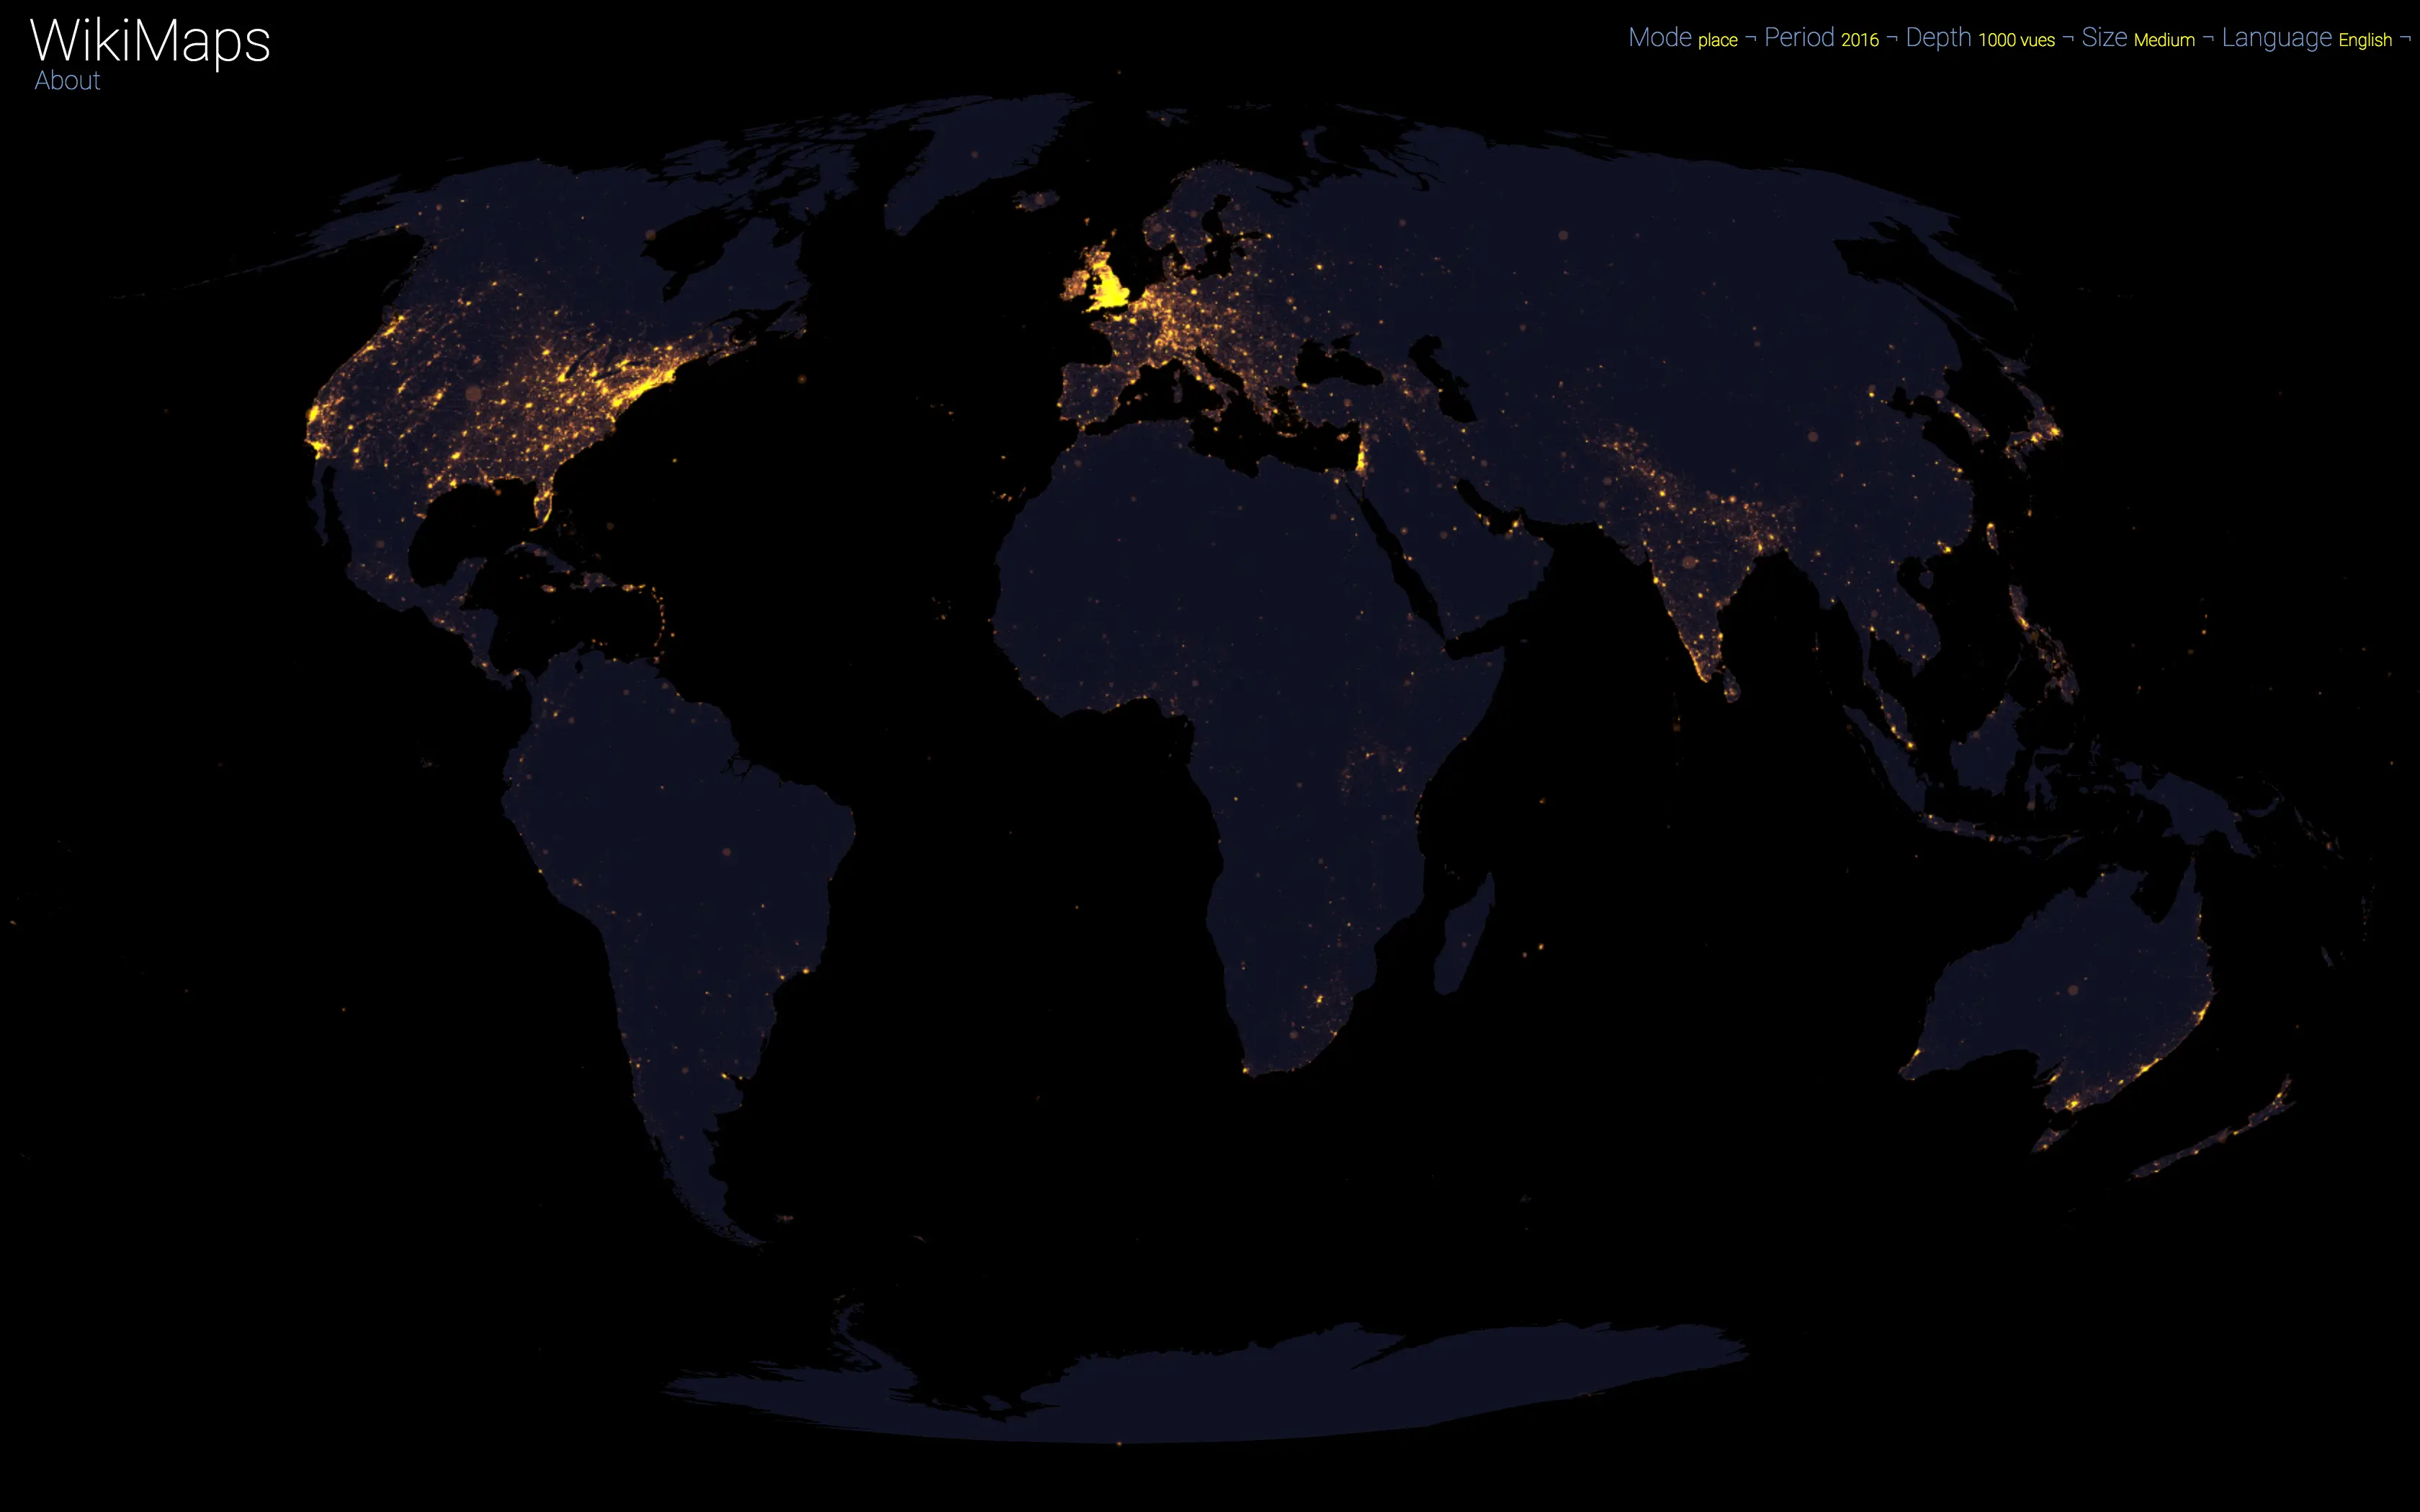
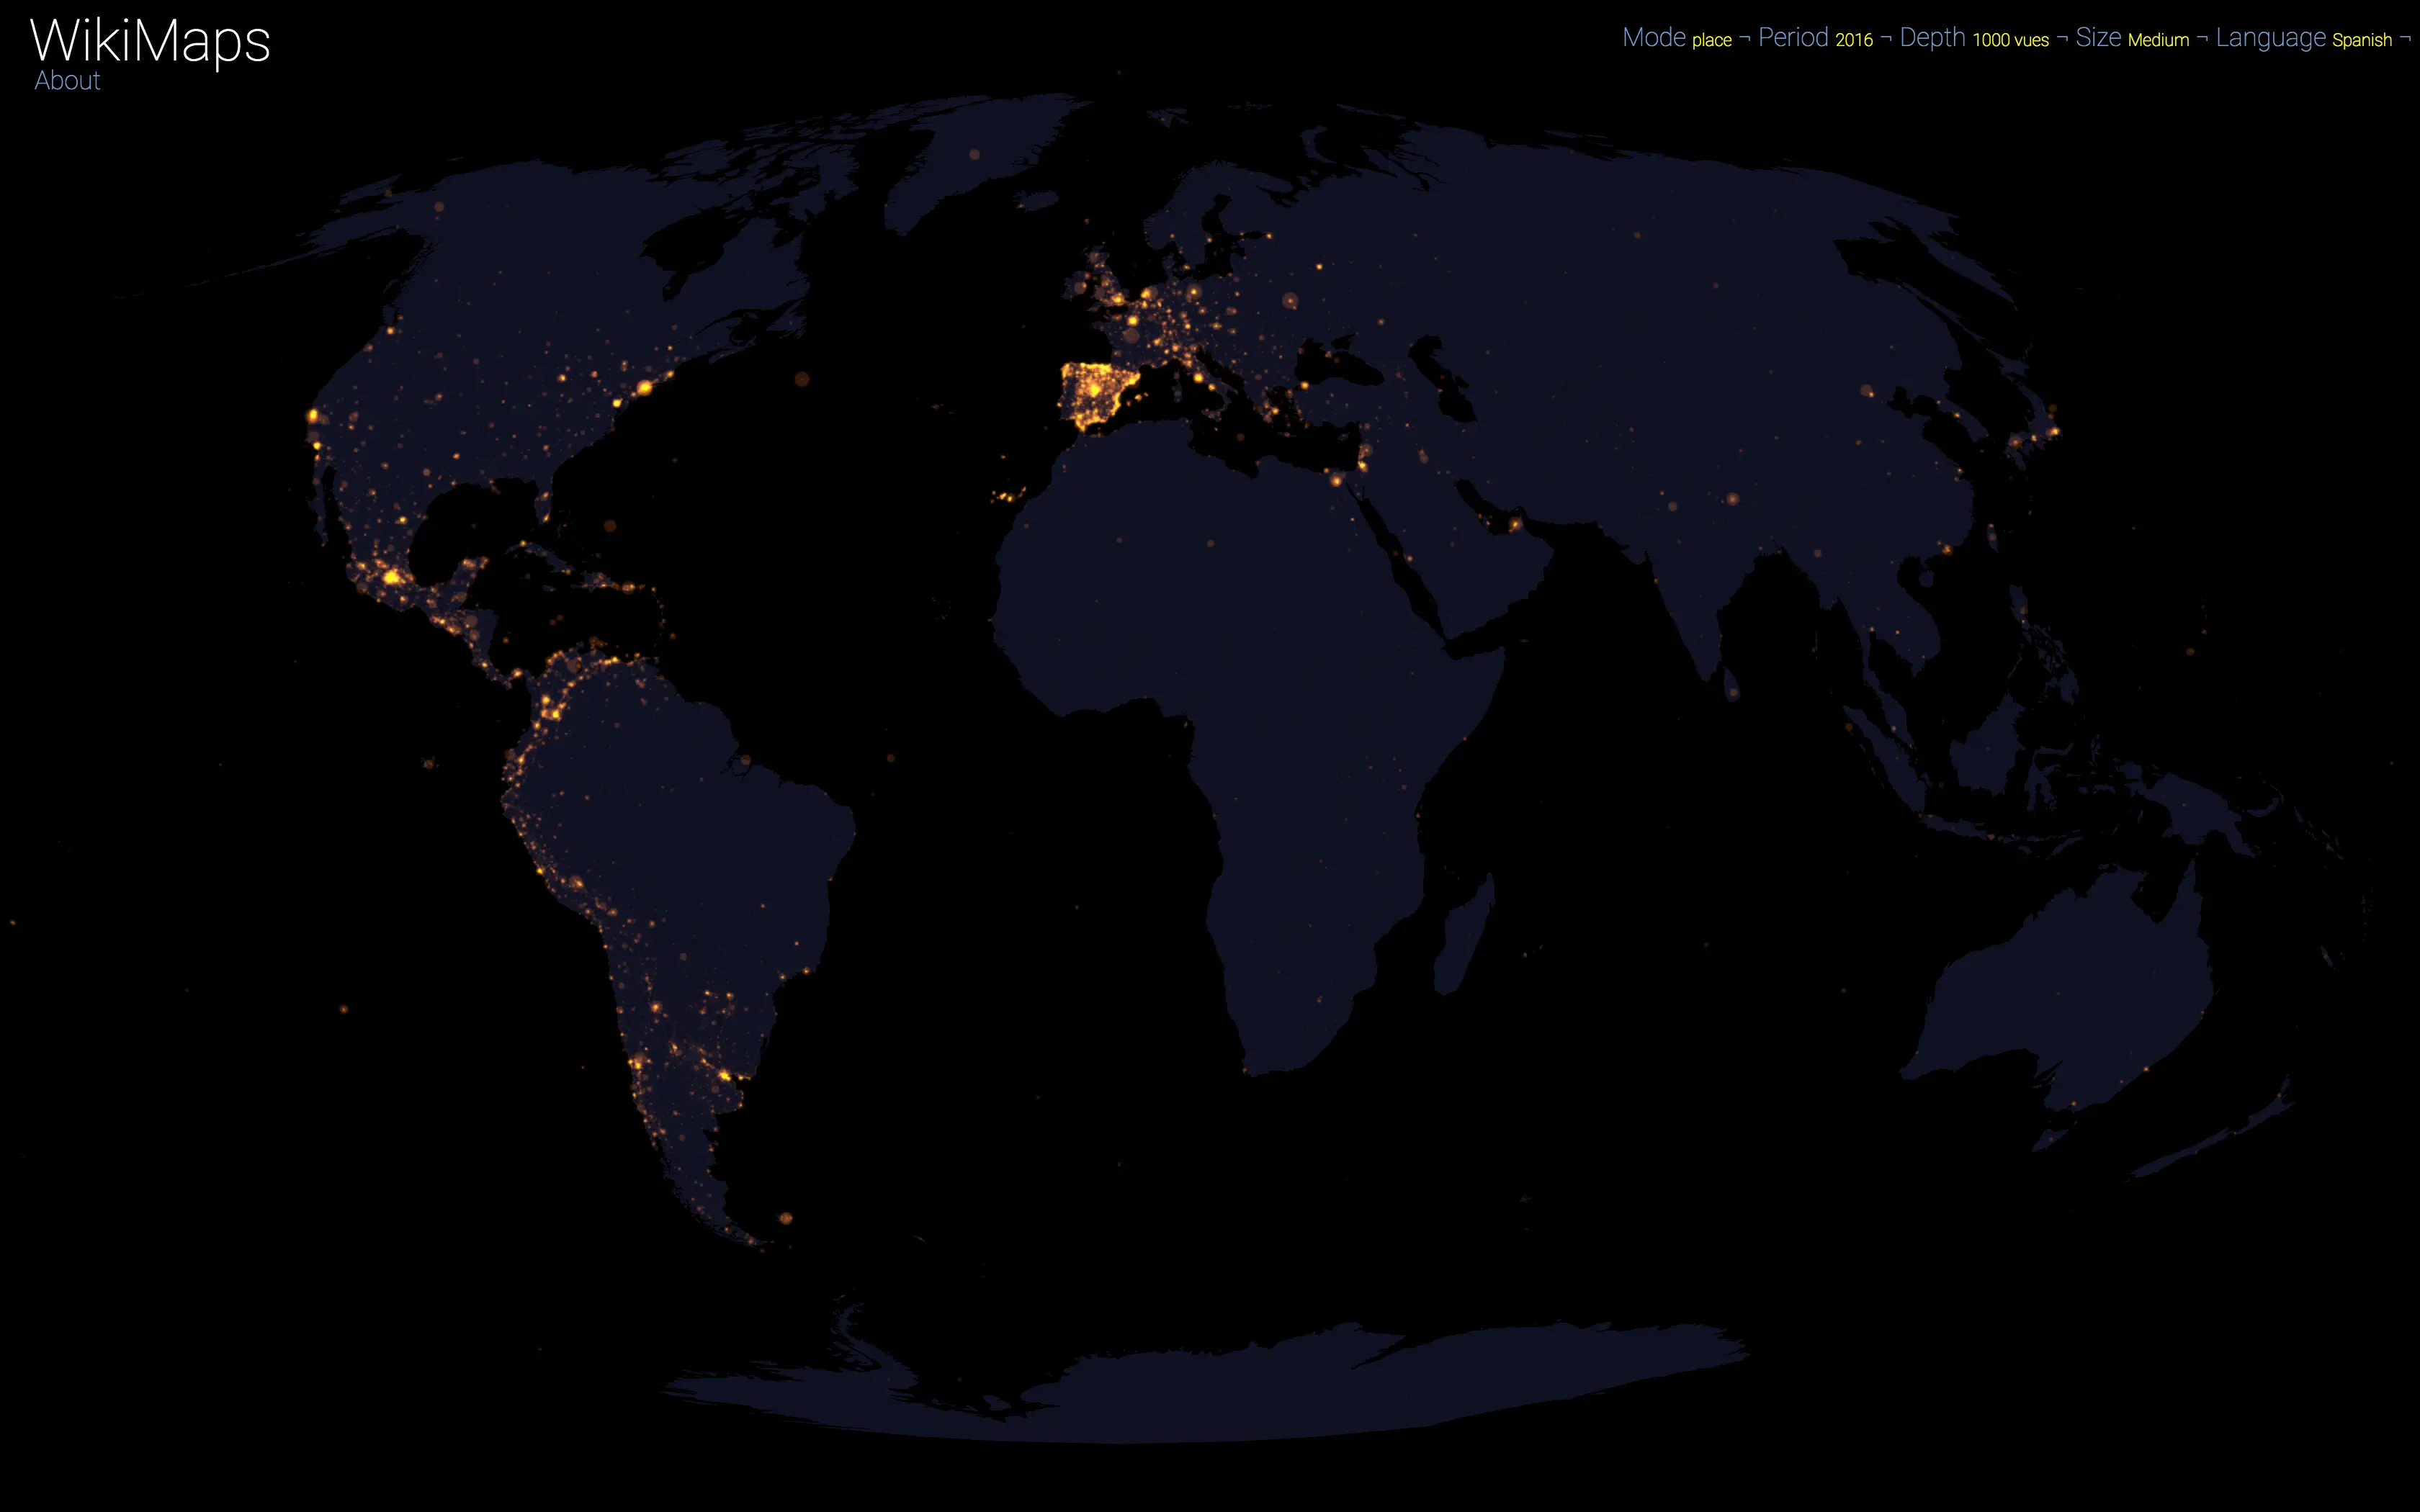
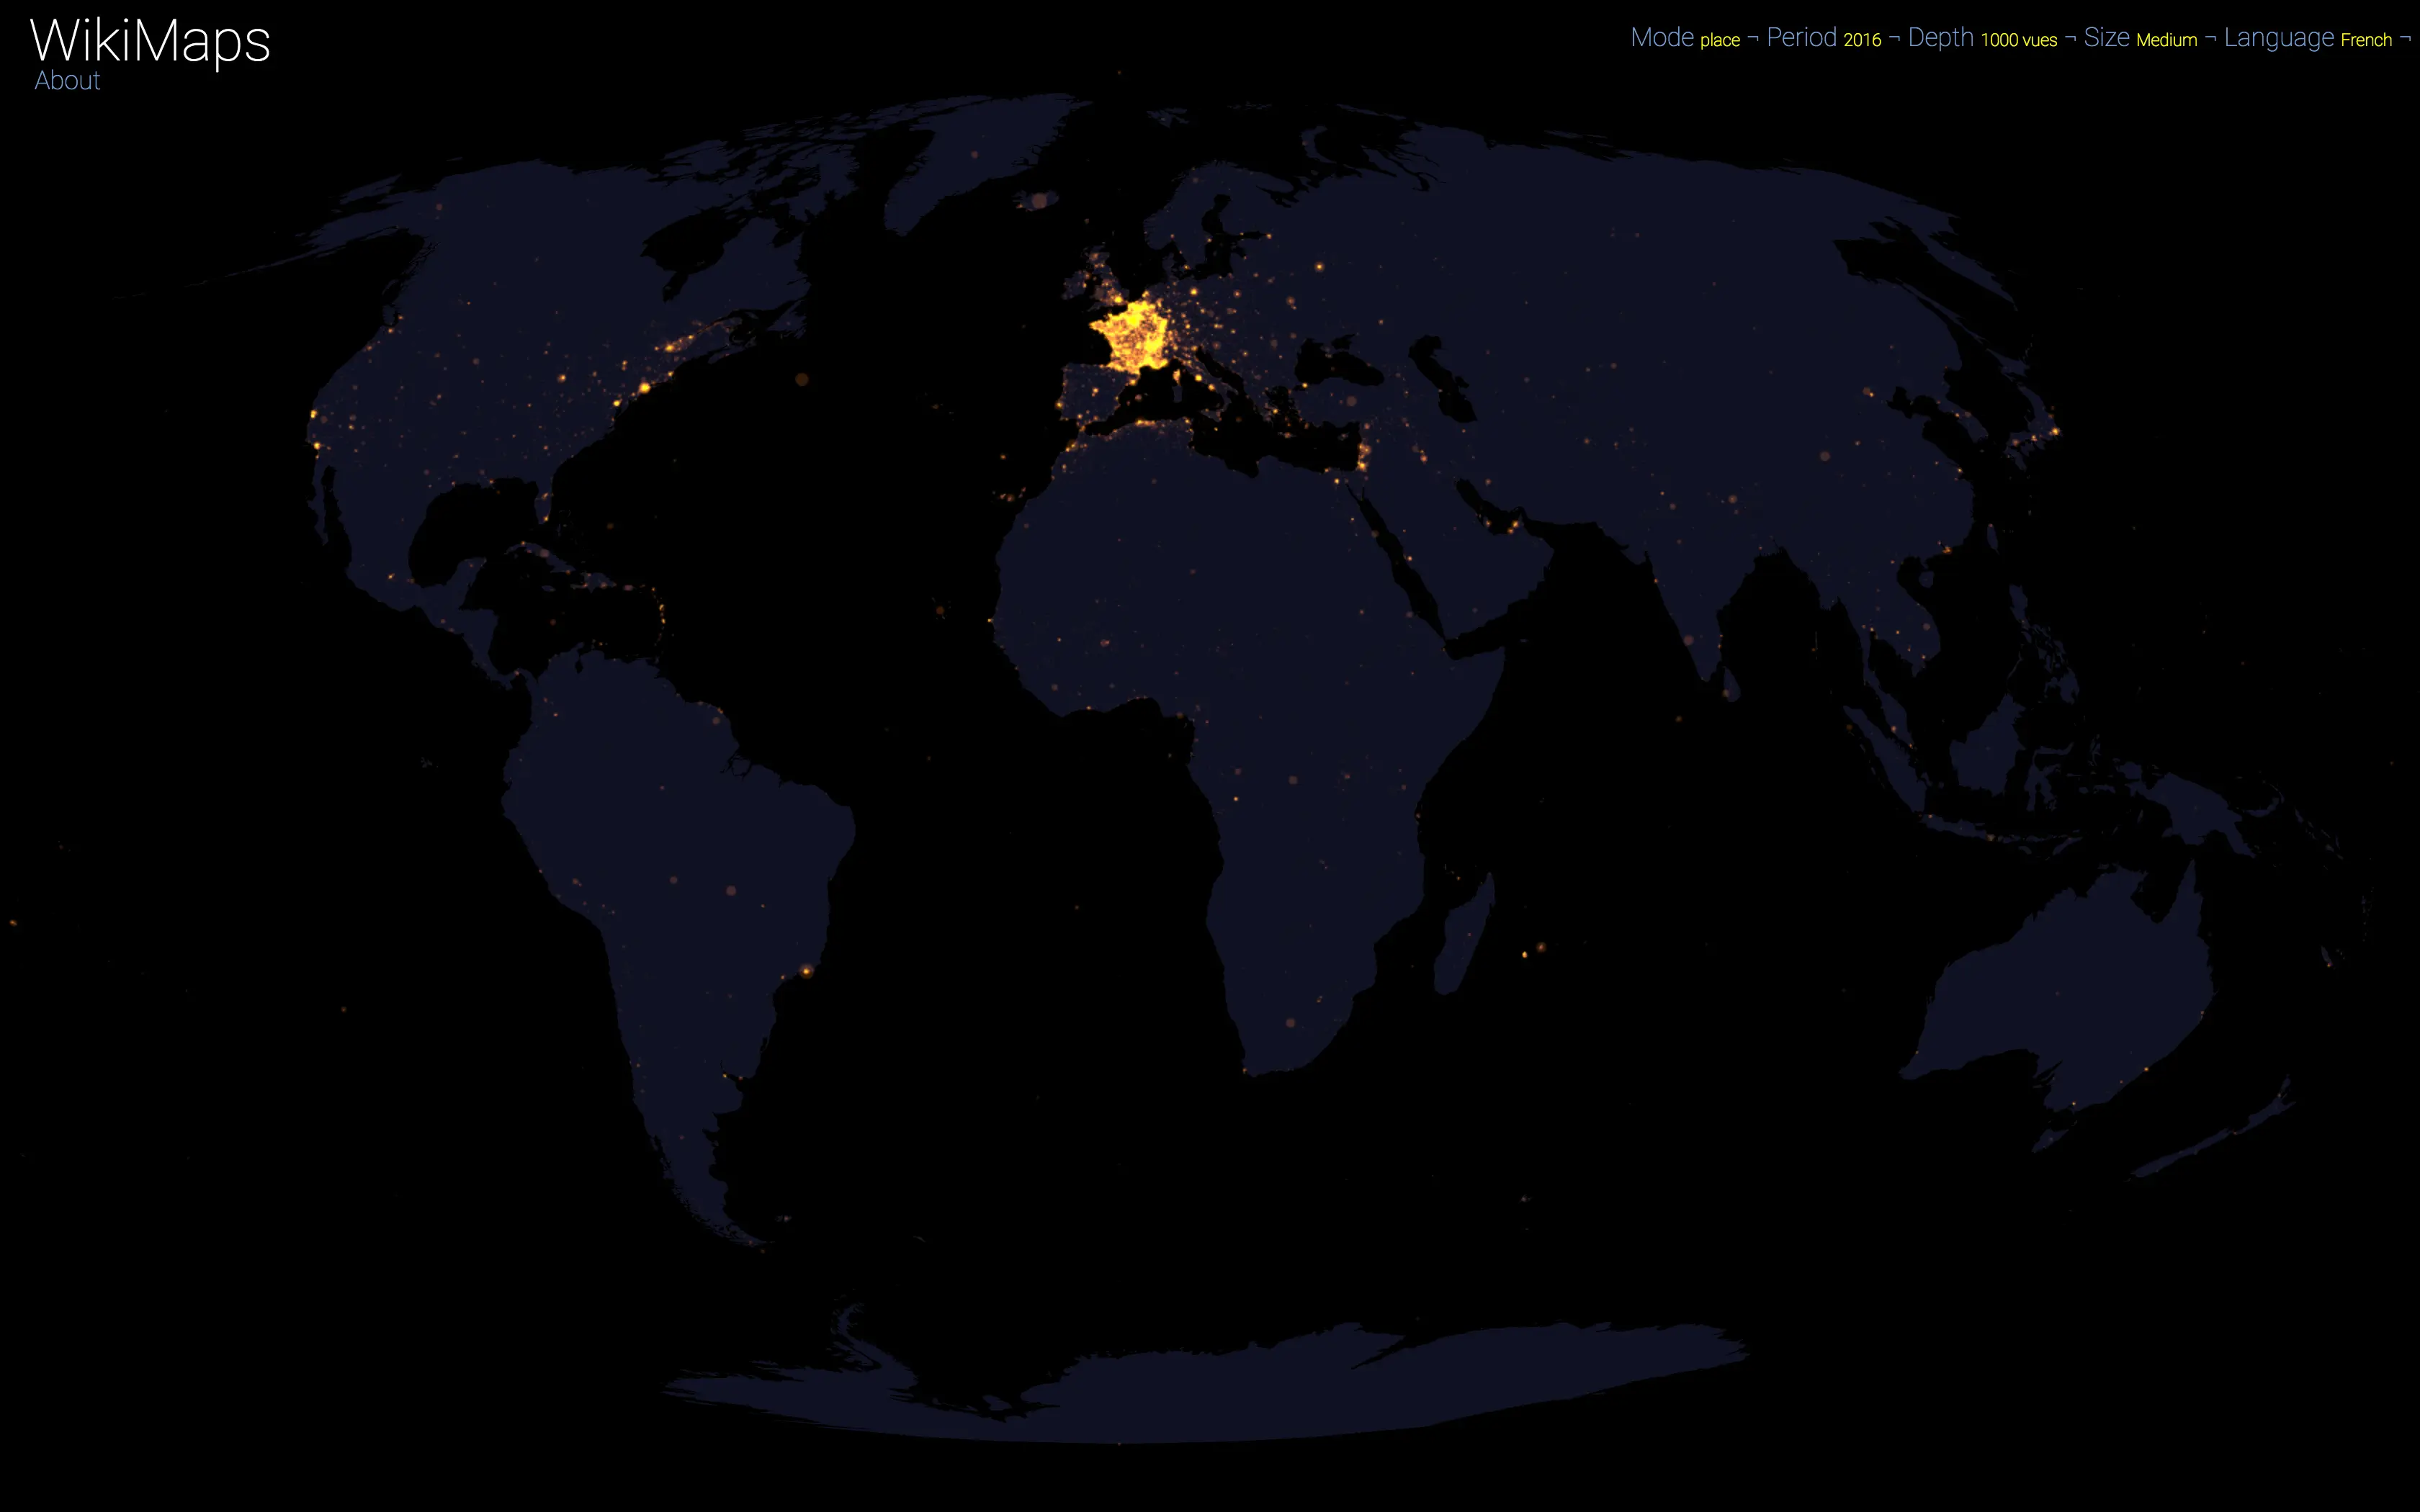
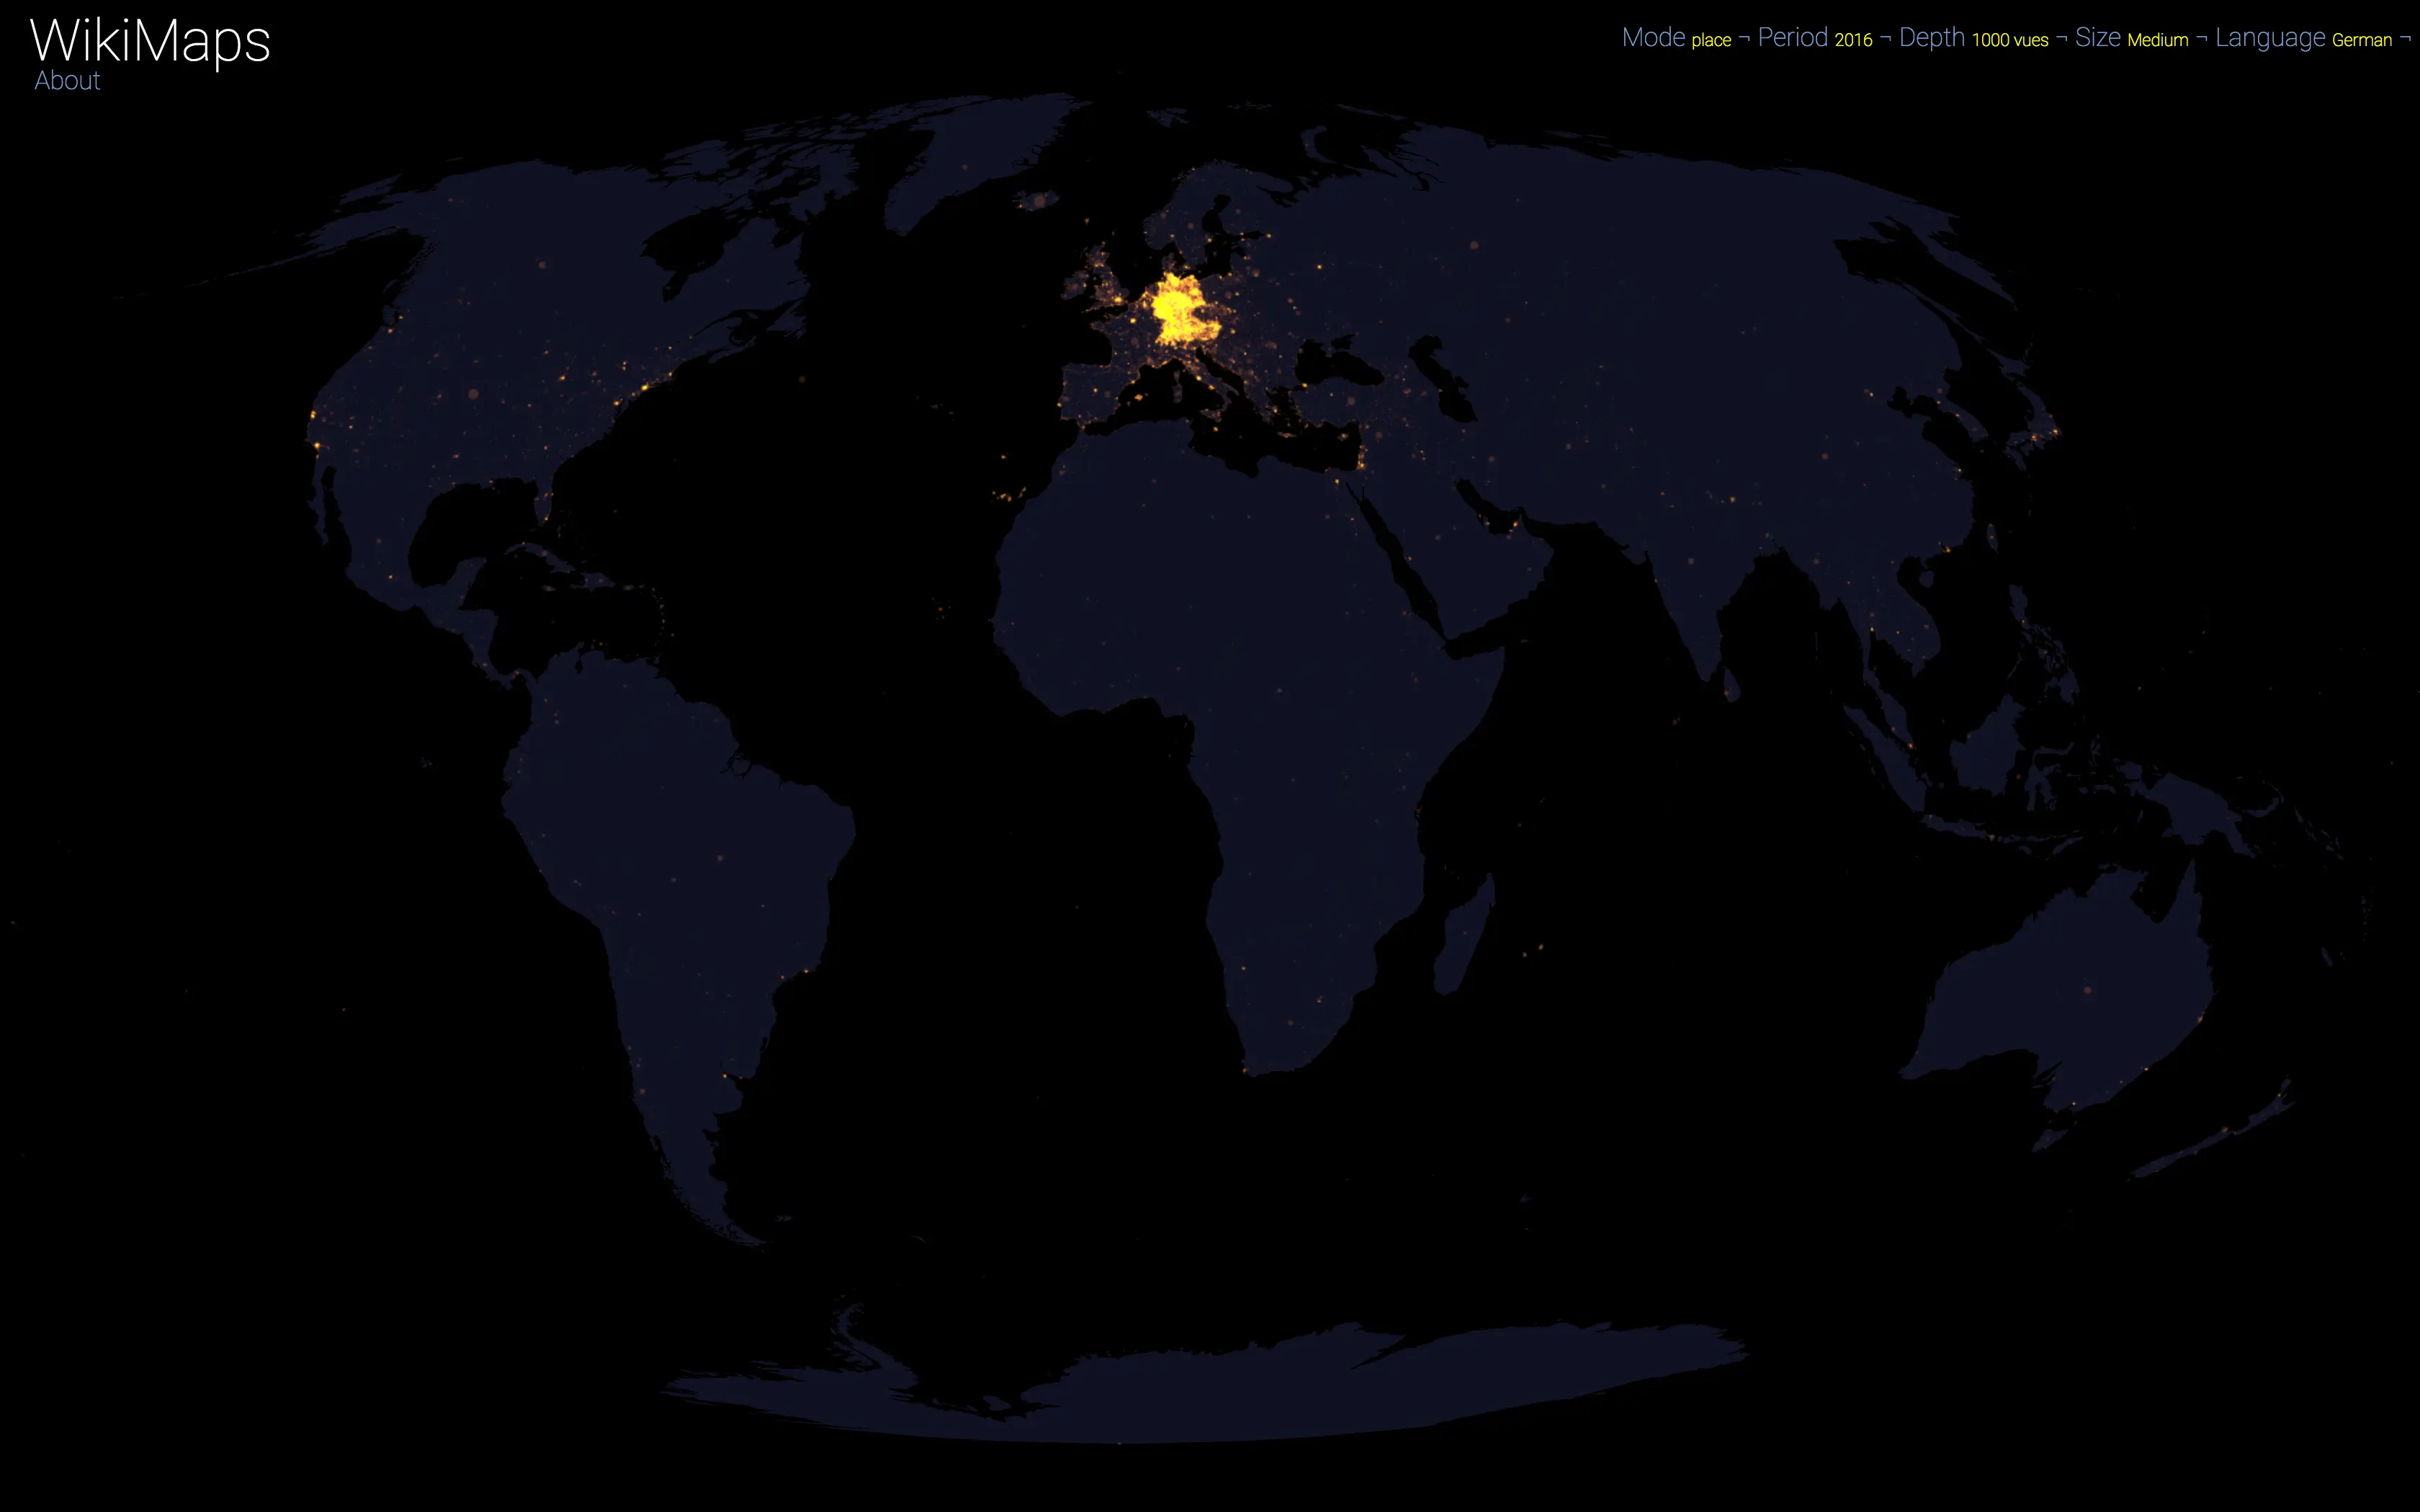
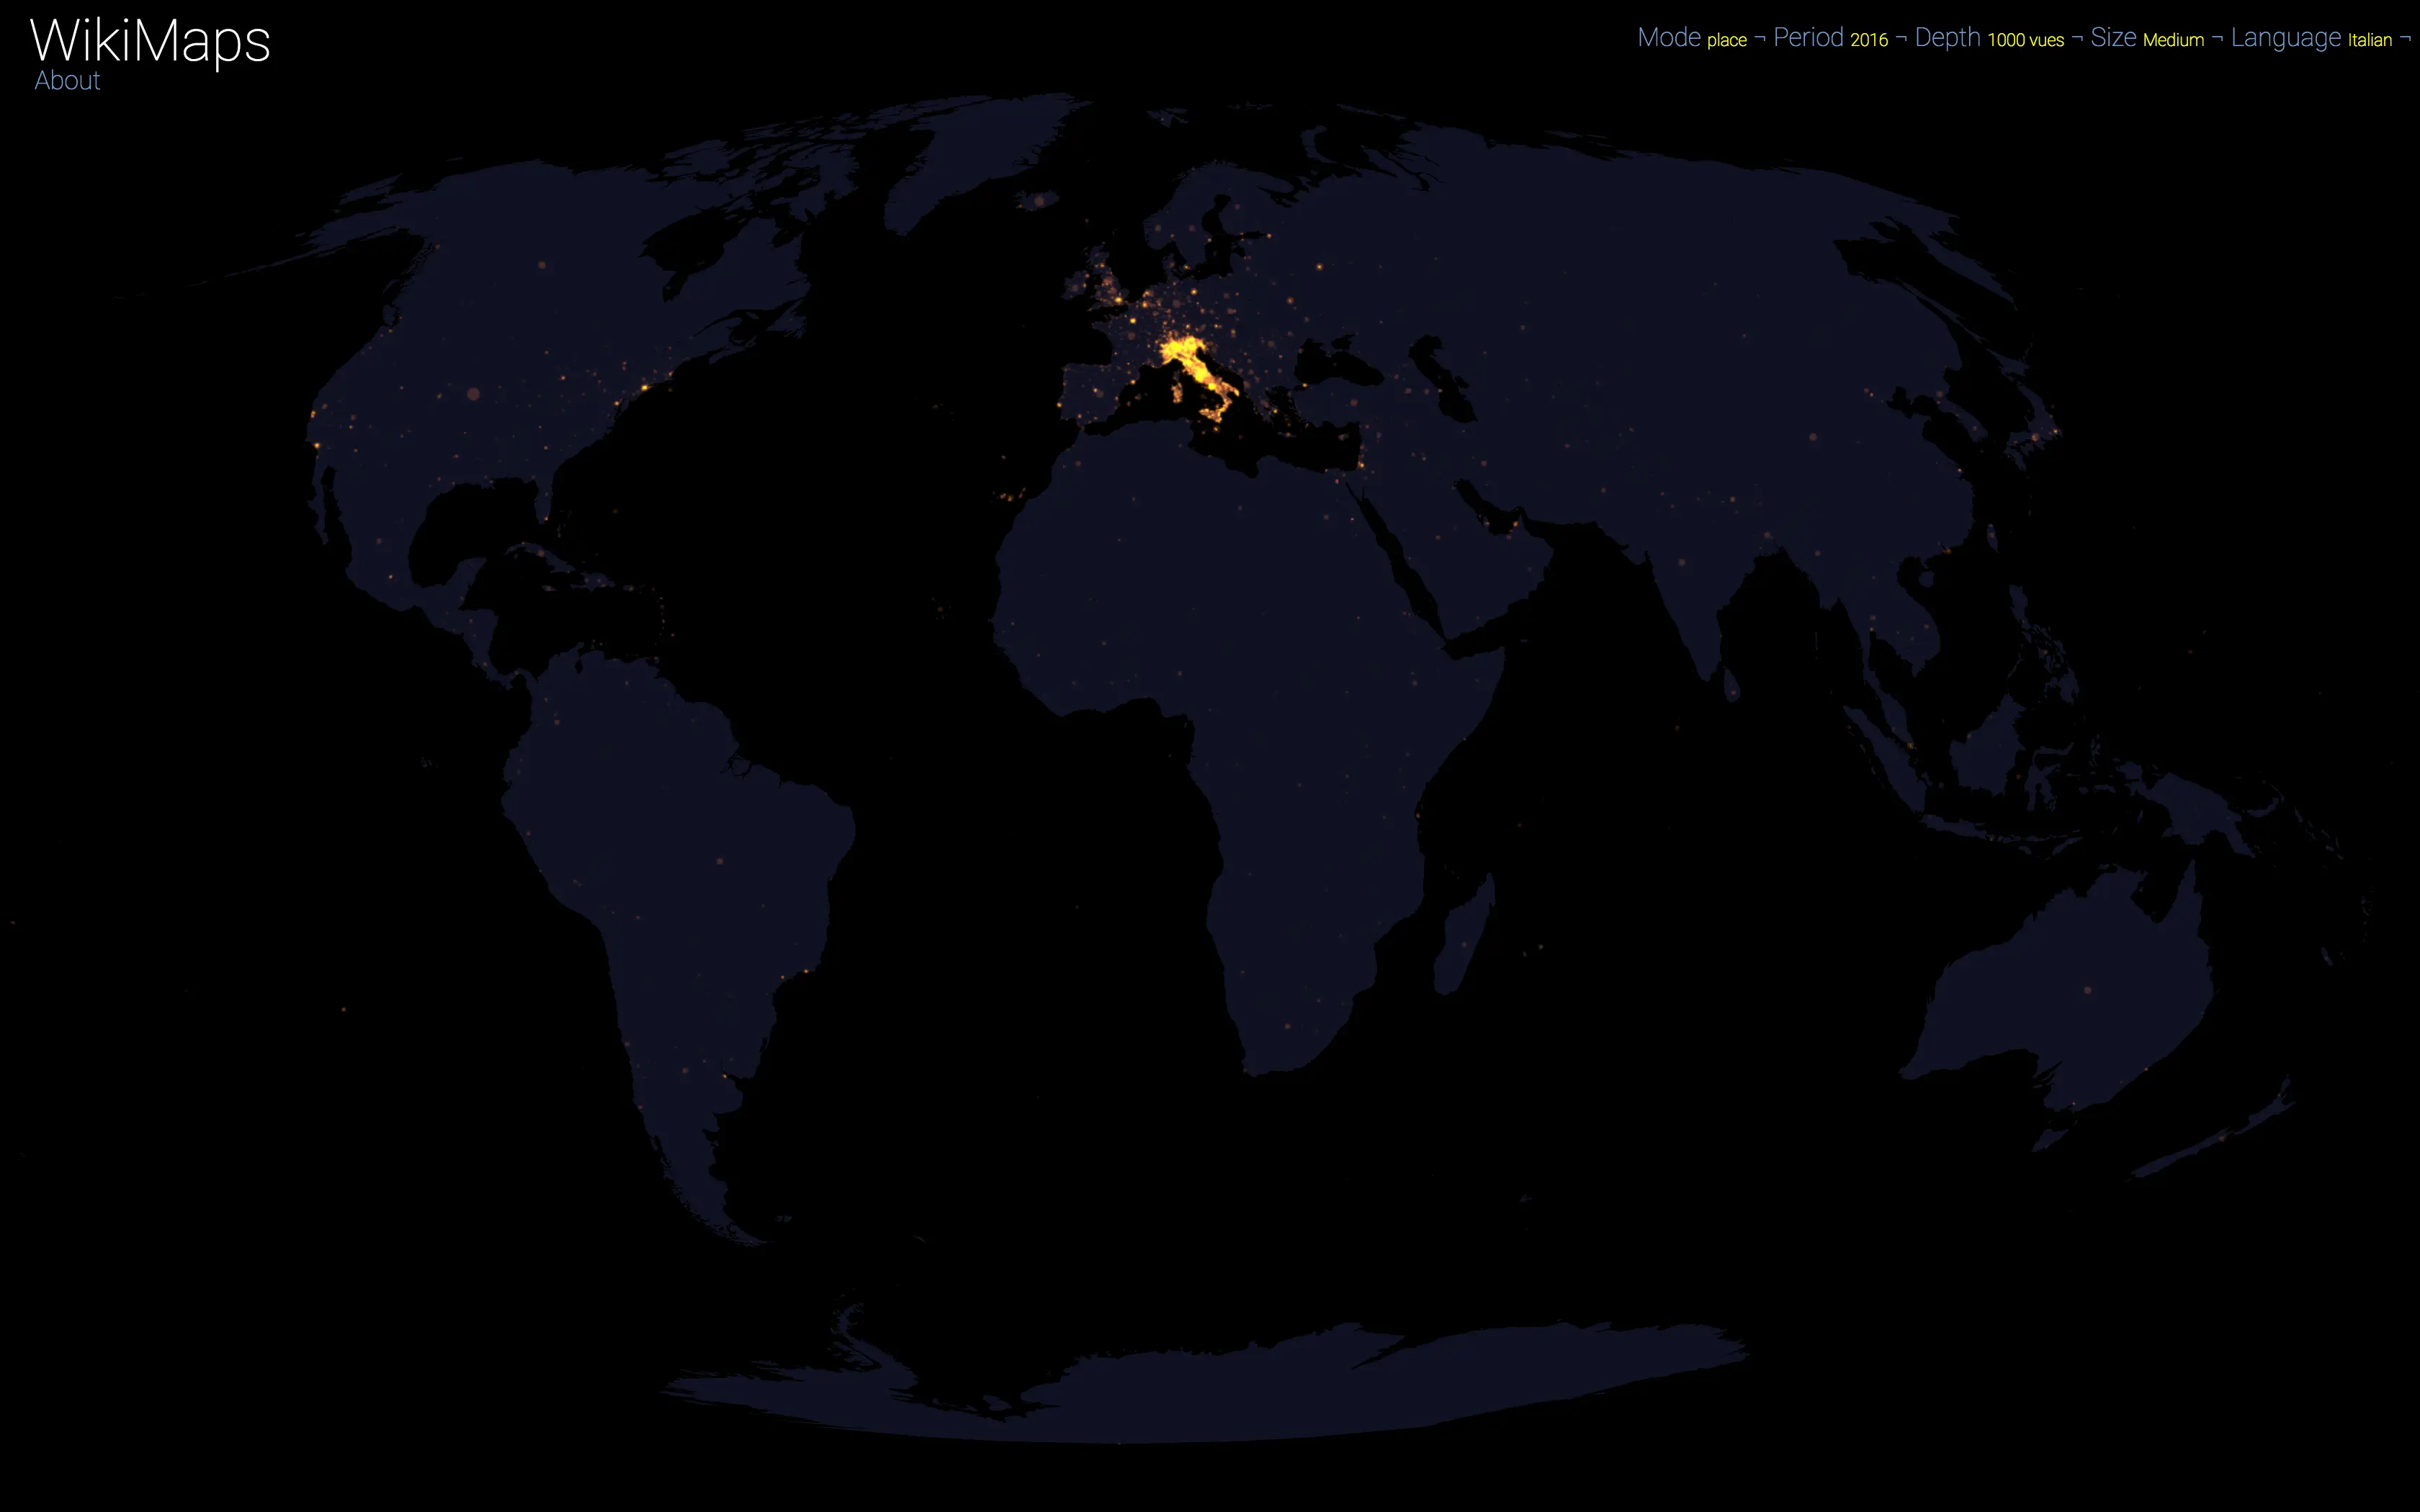
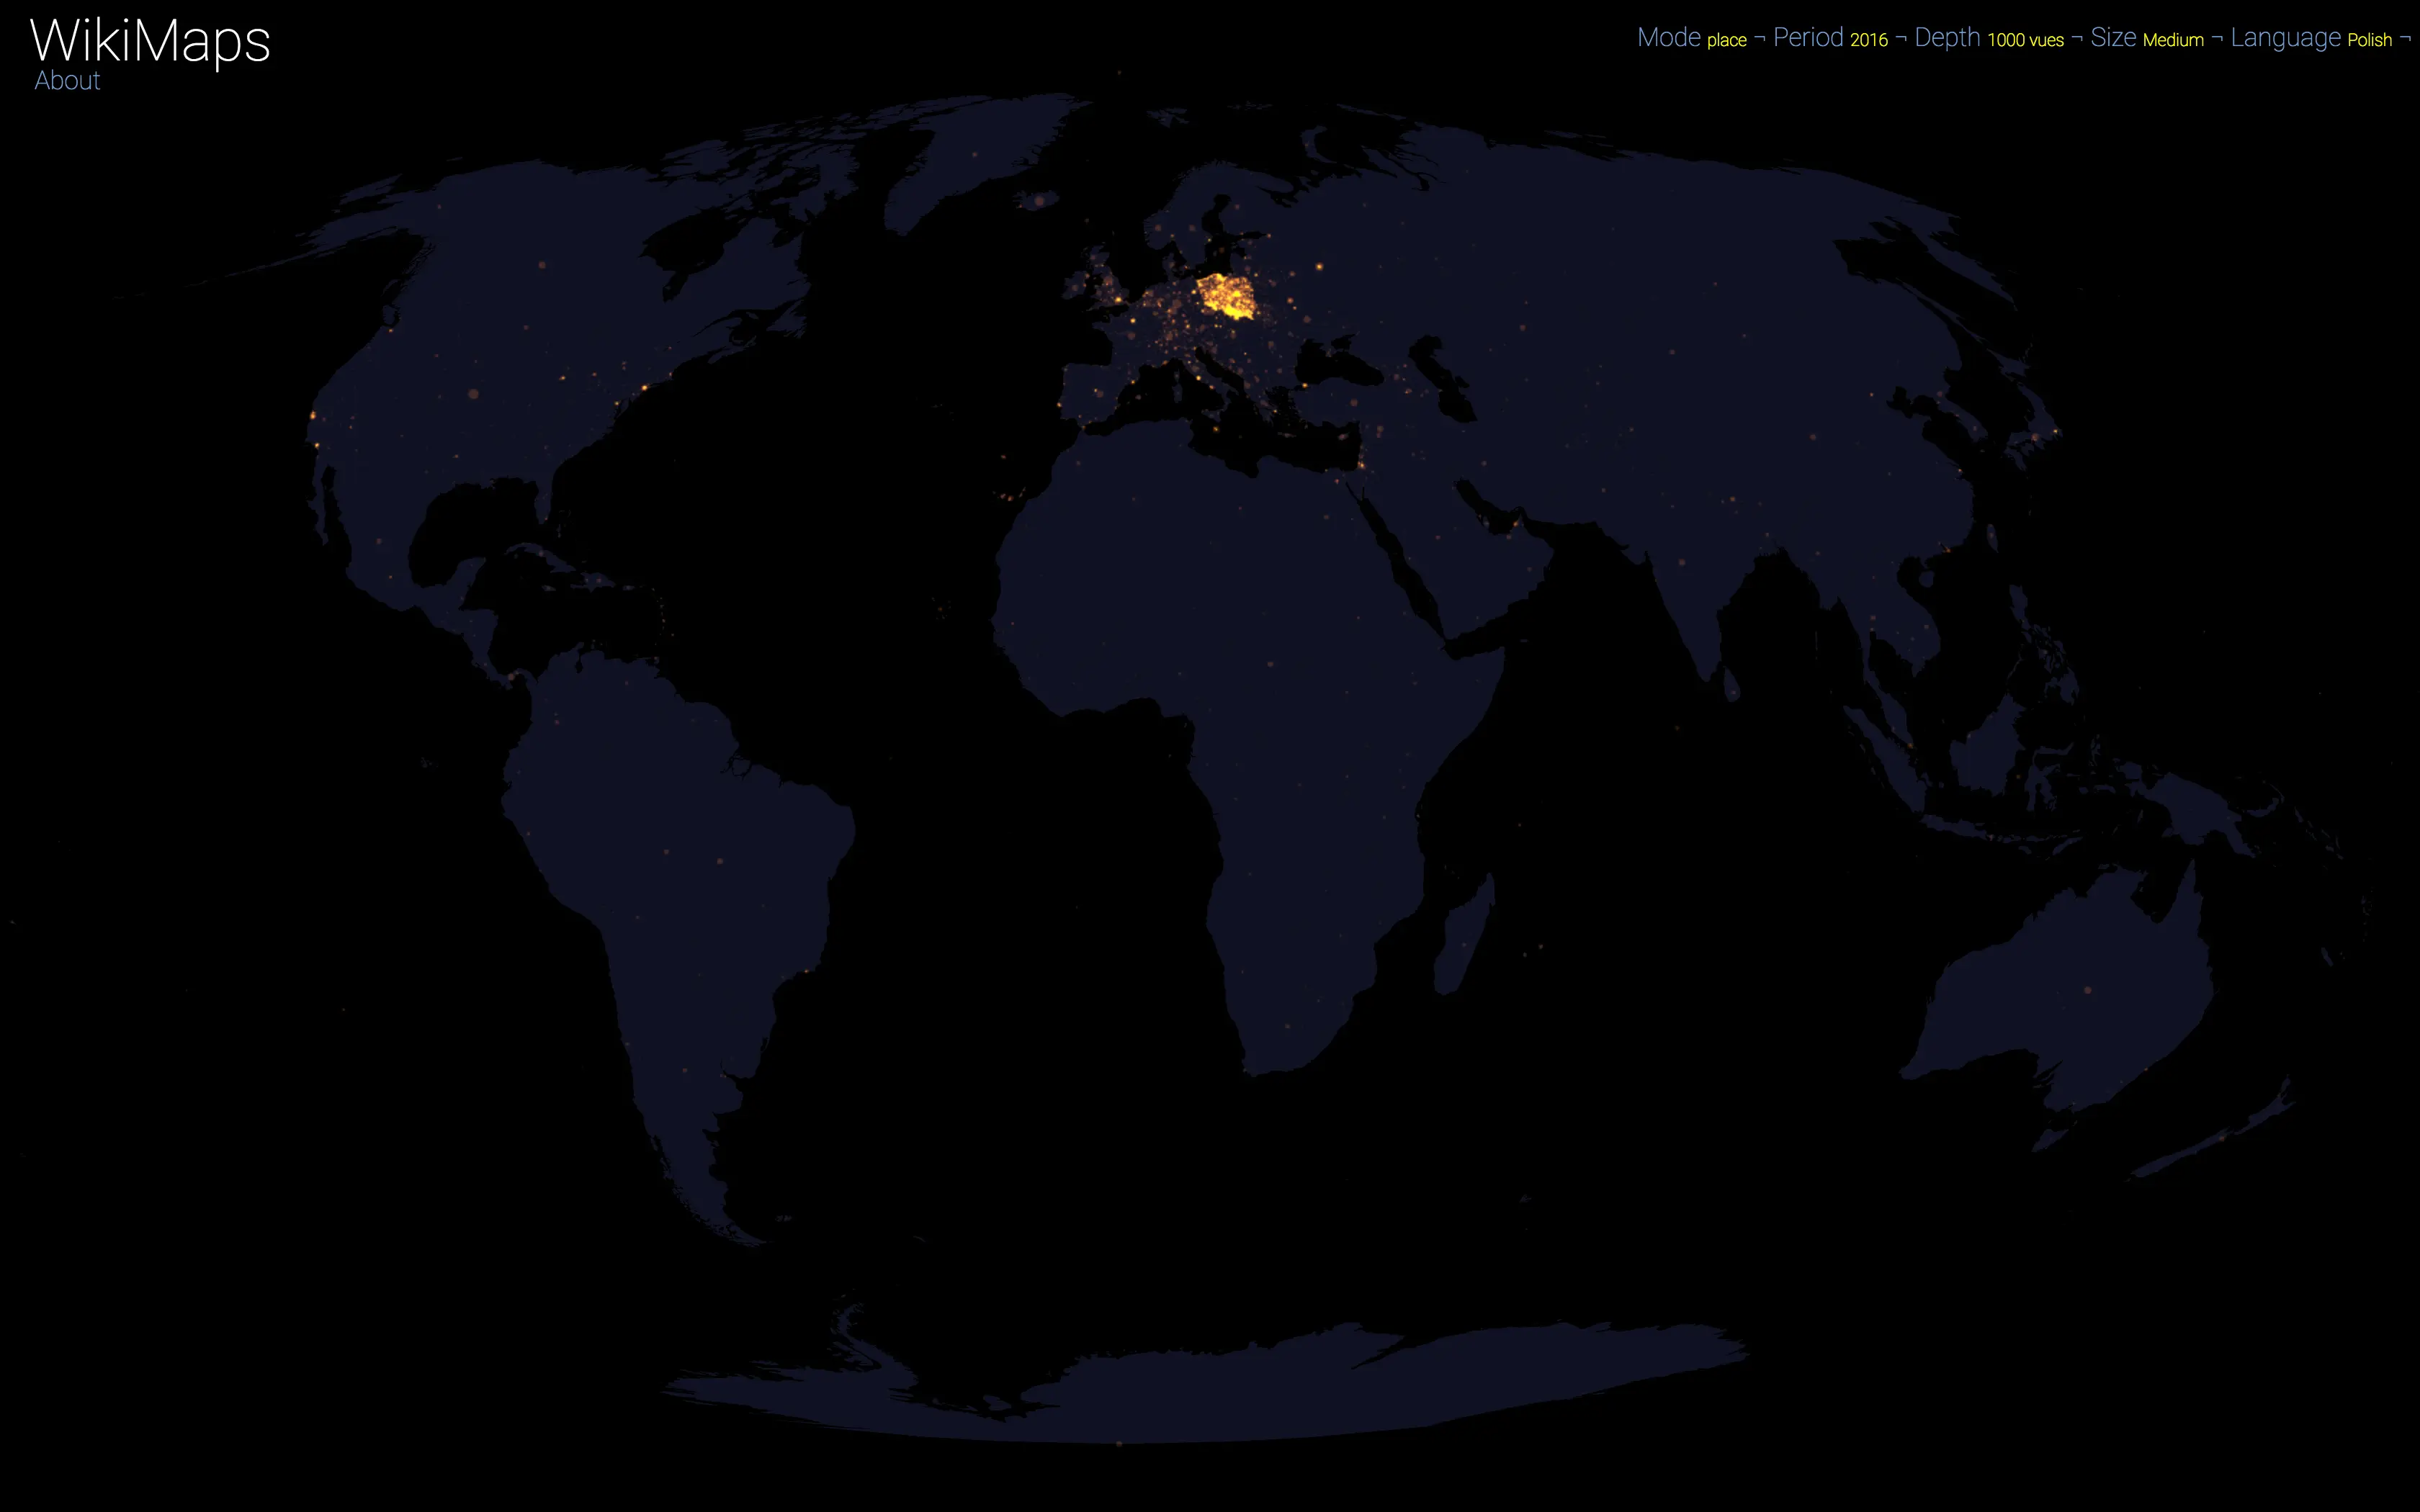
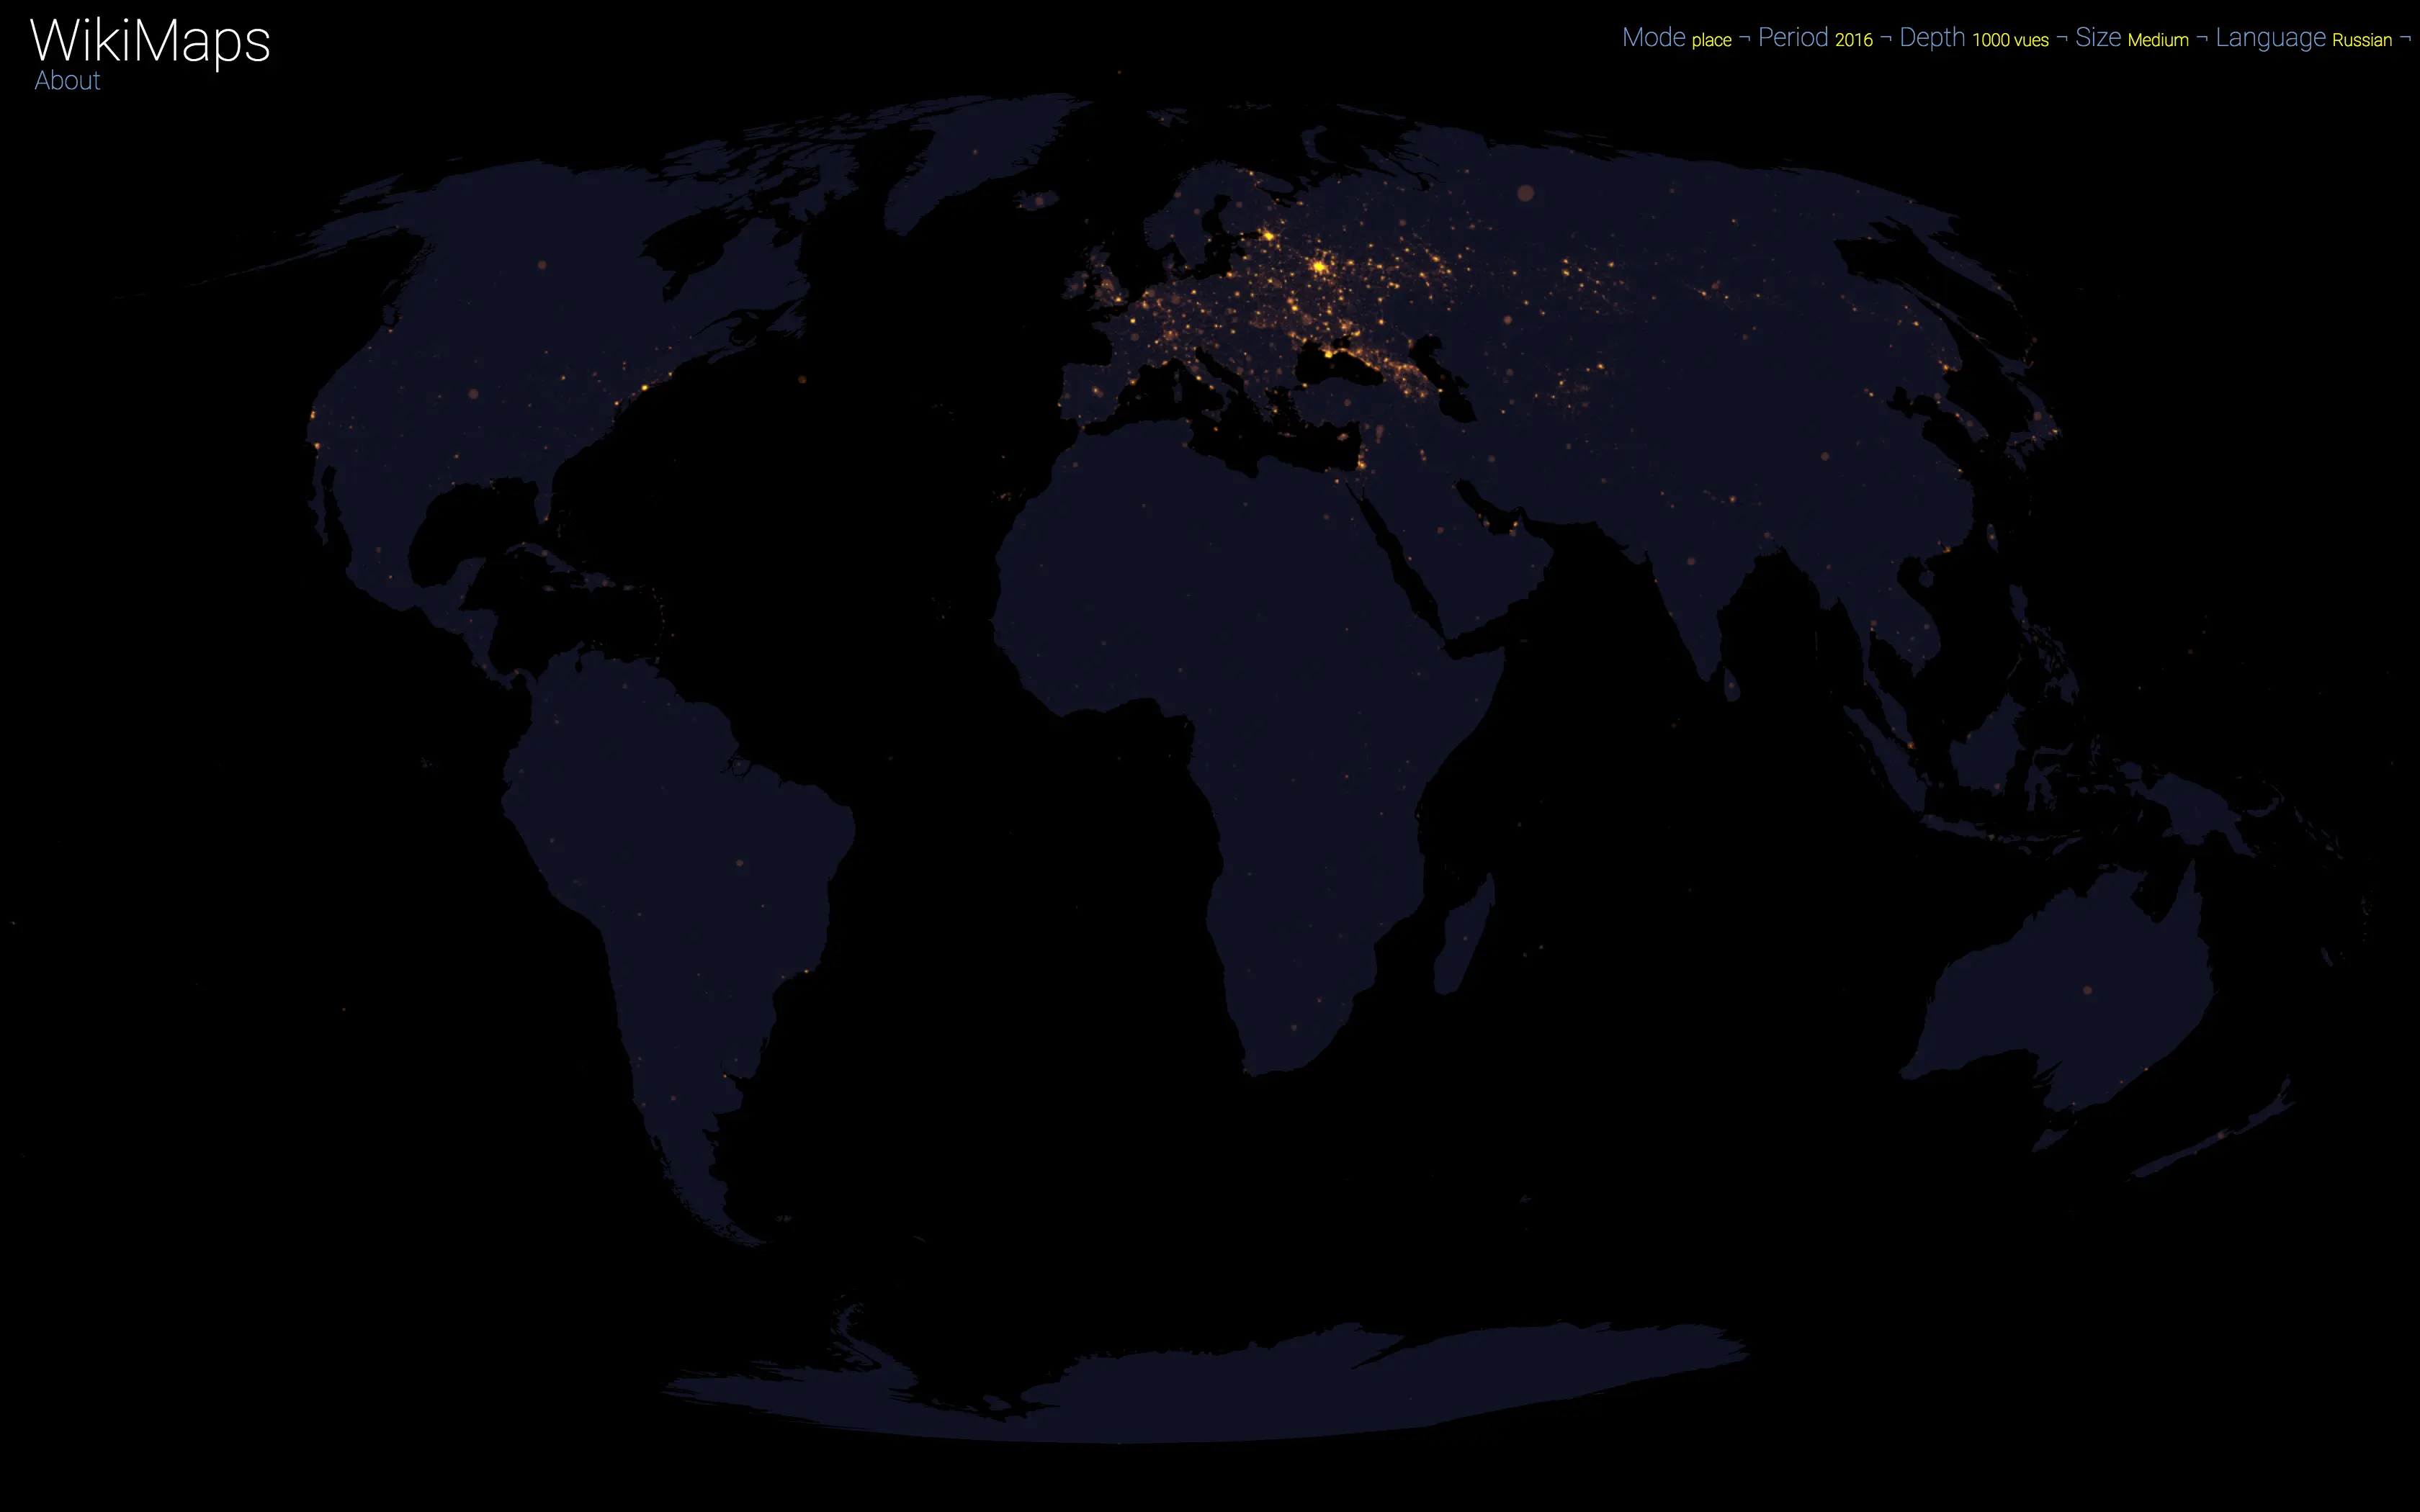
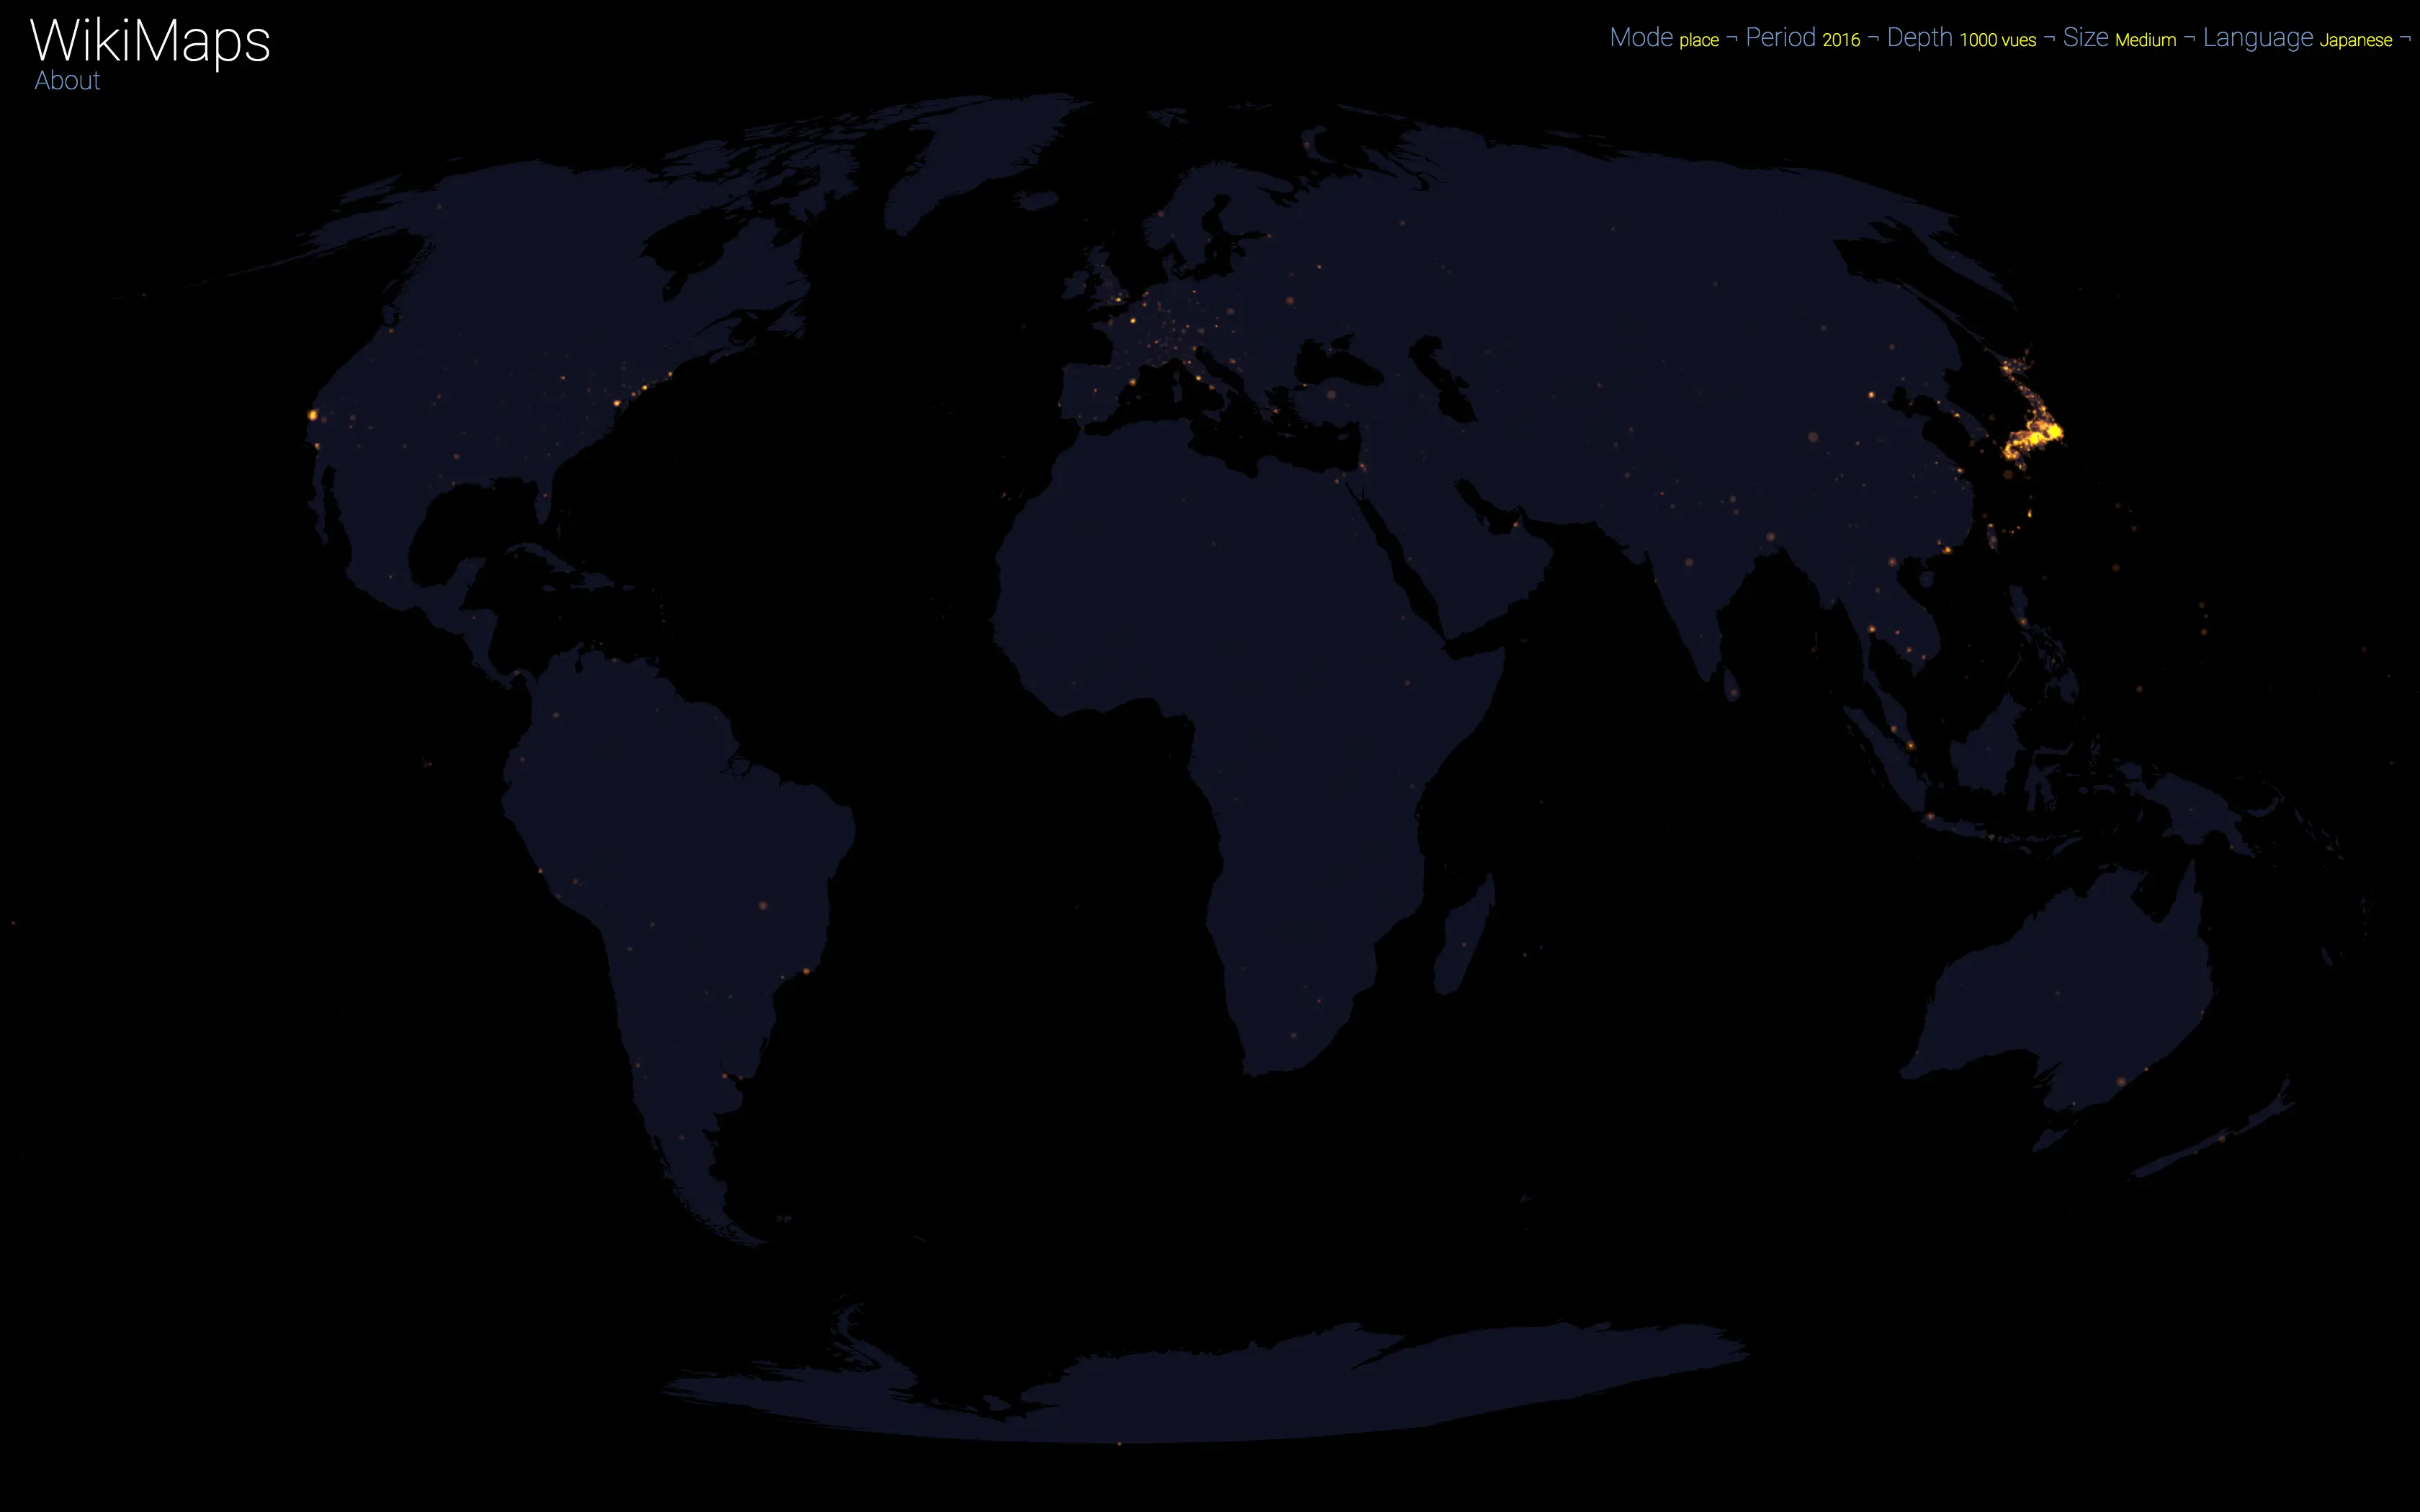
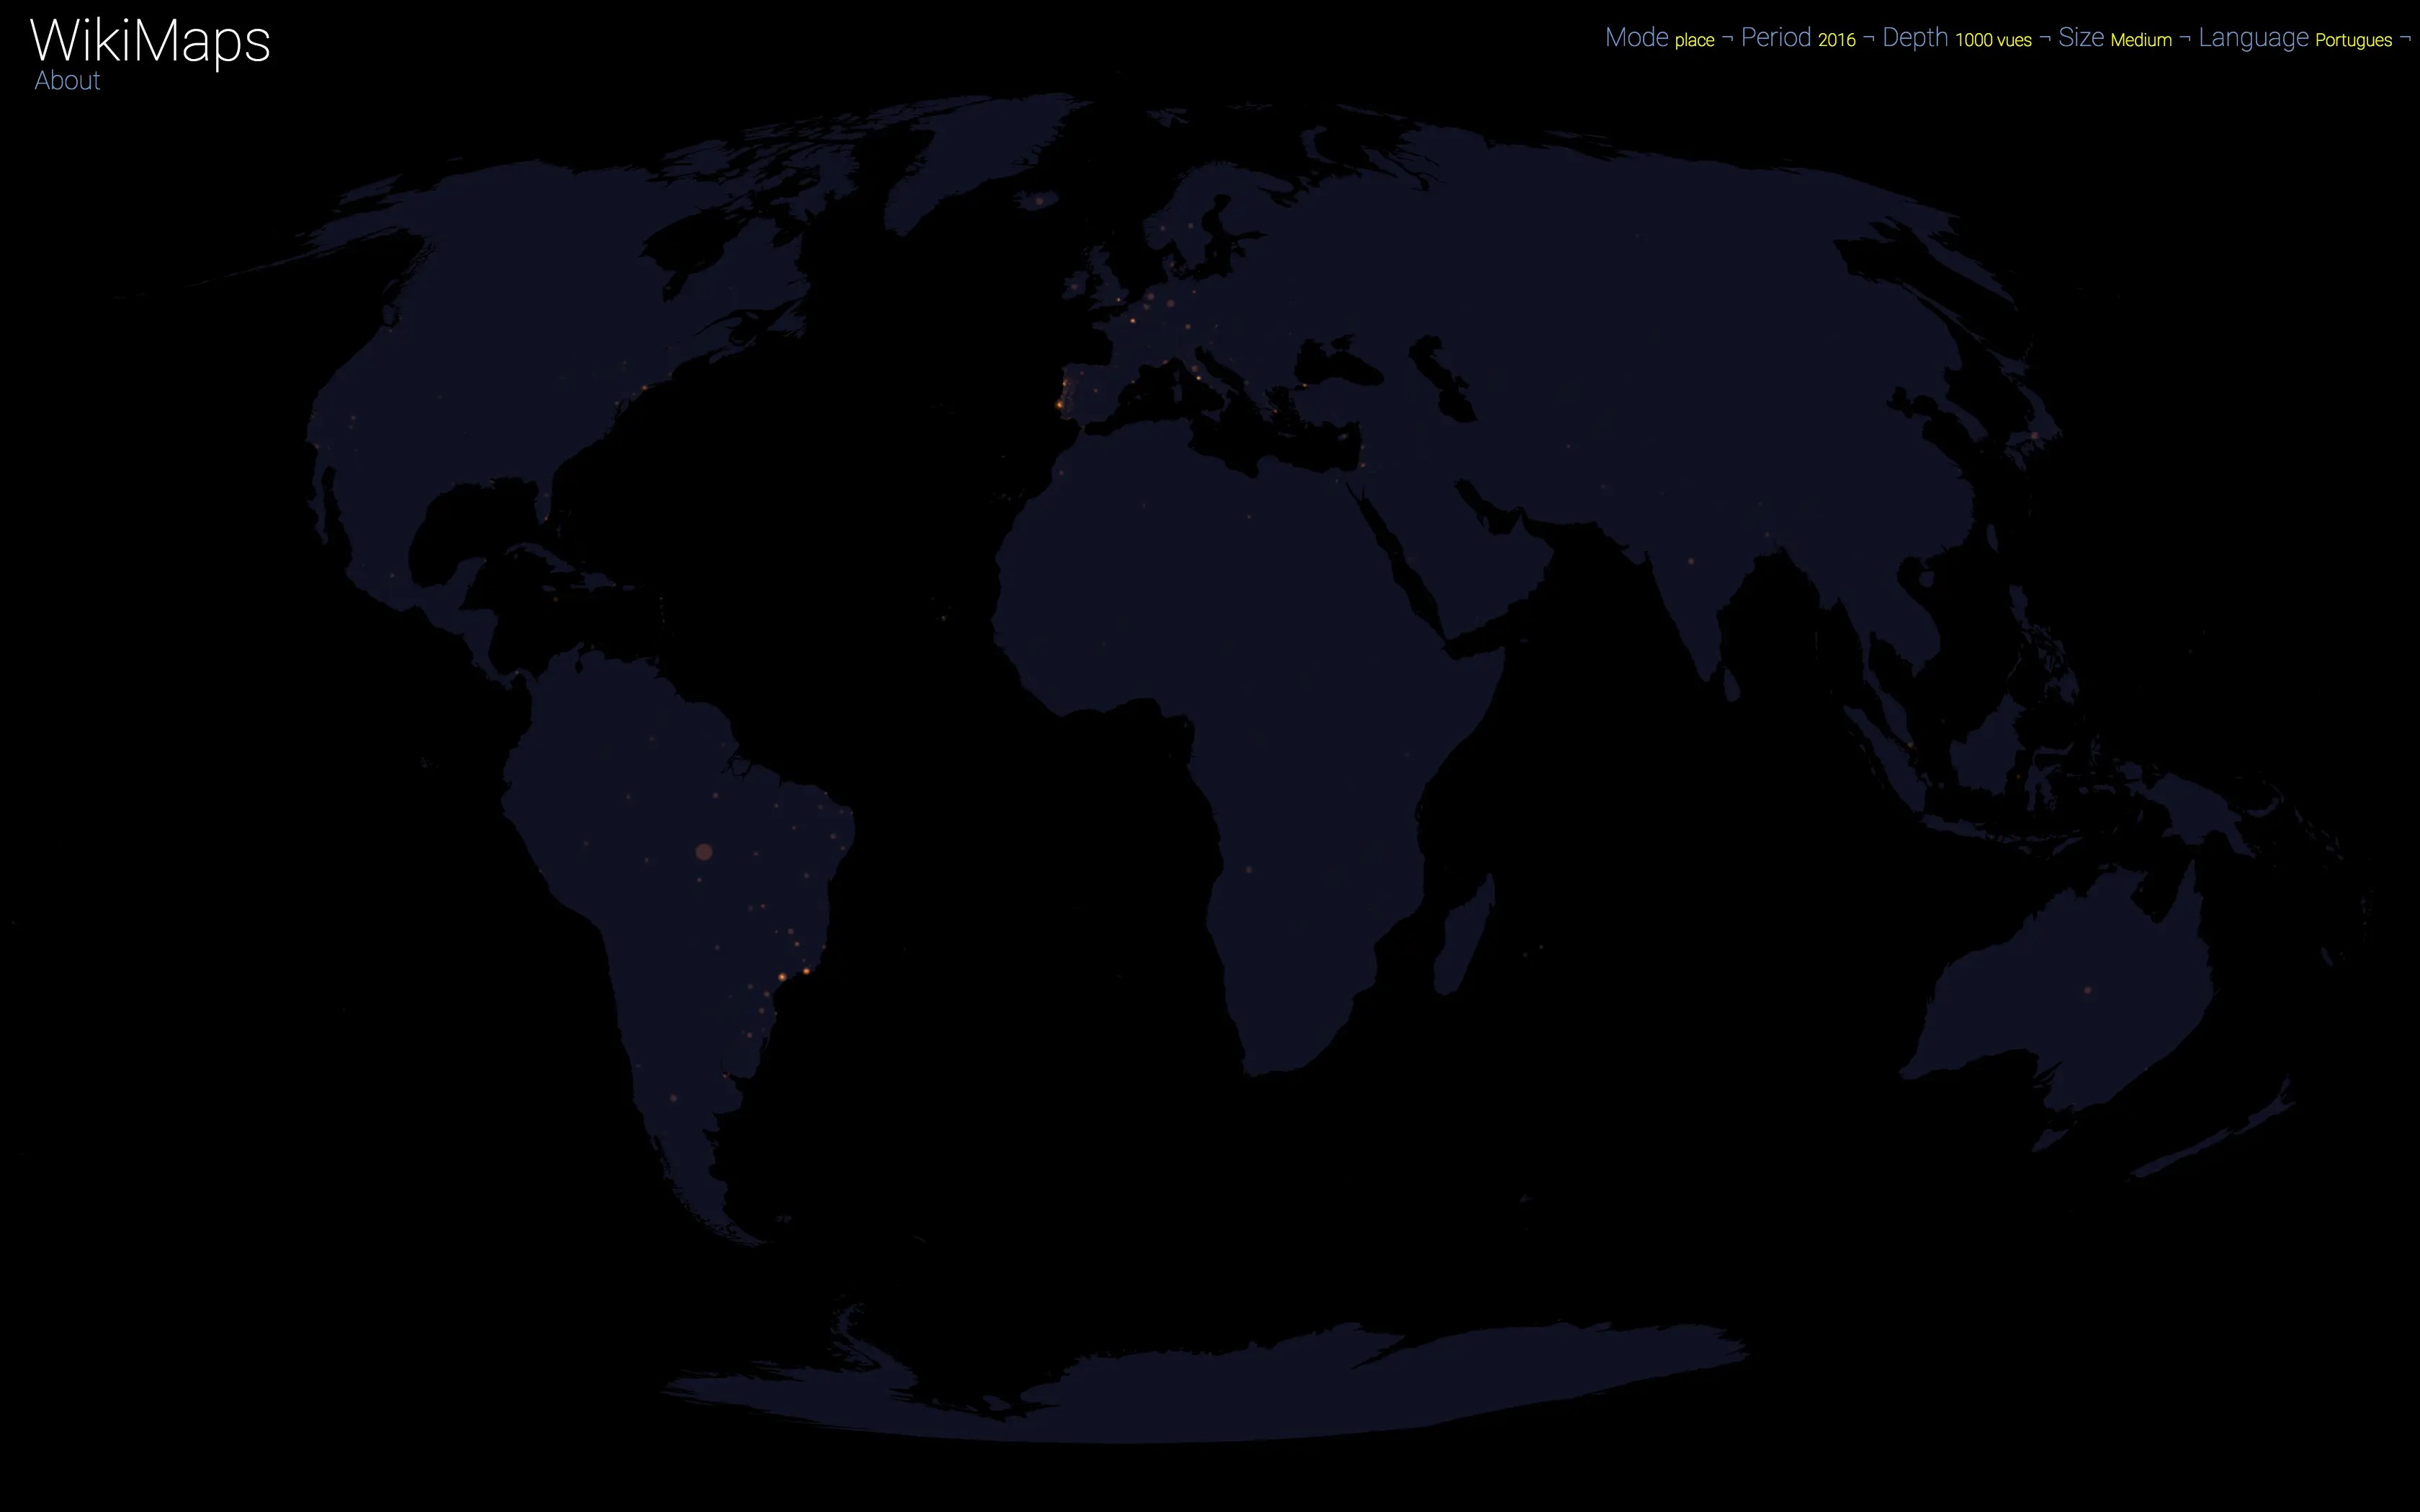
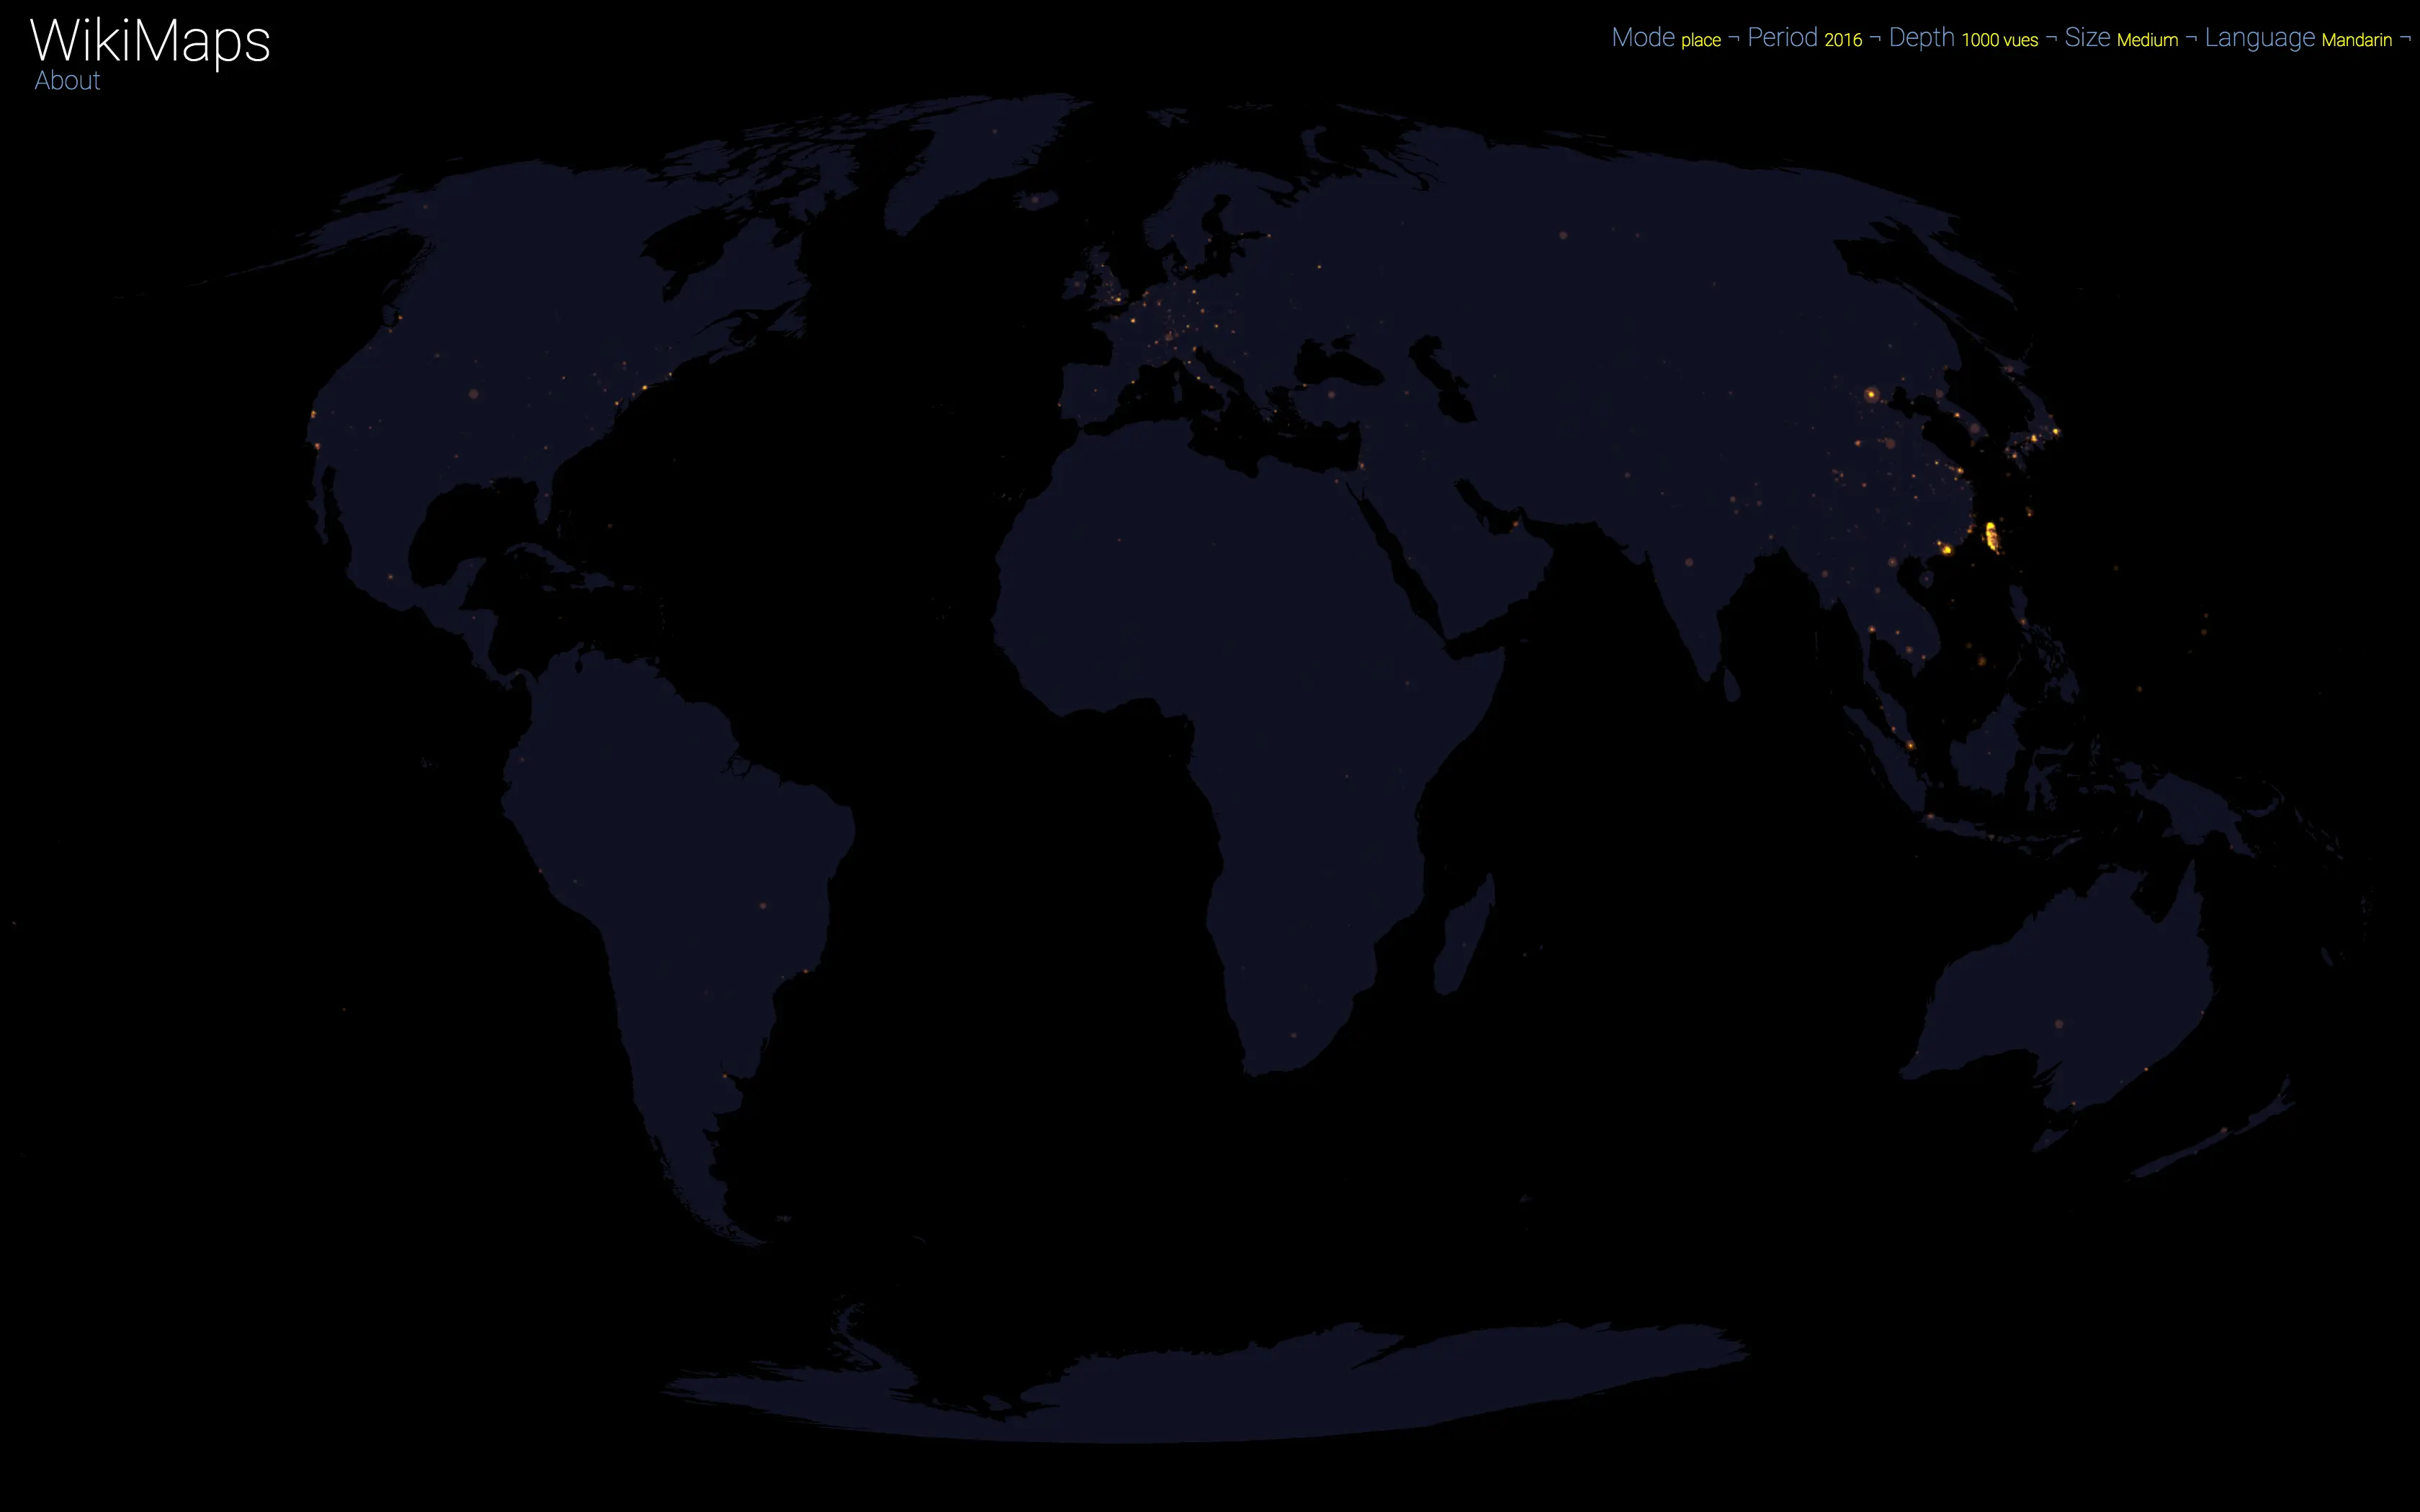
On a global scale, the uneven distribution of attention across languages is particularly striking. English is by far the language that attracts the most widespread attention, albeit concentrated in English-speaking countries, including India. Spanish, because of its wide spatial distribution in Latin America, is also spread well beyond Spain. French, on the other hand, although widely spoken in Africa, is much less widespread, as Internet penetration is very low in most of the countries concerned. For all other languages, attention is almost exclusively concentrated within the areas corresponding to the linguistic area of the edition being considered.
Mandarin is an exception, since Wikipedia is used marginally in China. It is therefore the most westernised part that appears (Hong Kong and Taiwan).
Finally, there are spaces that stand out in all languages. These are essentially the most globalised metropolitan areas and the most touristic places.
Zoom 2008–2020 version
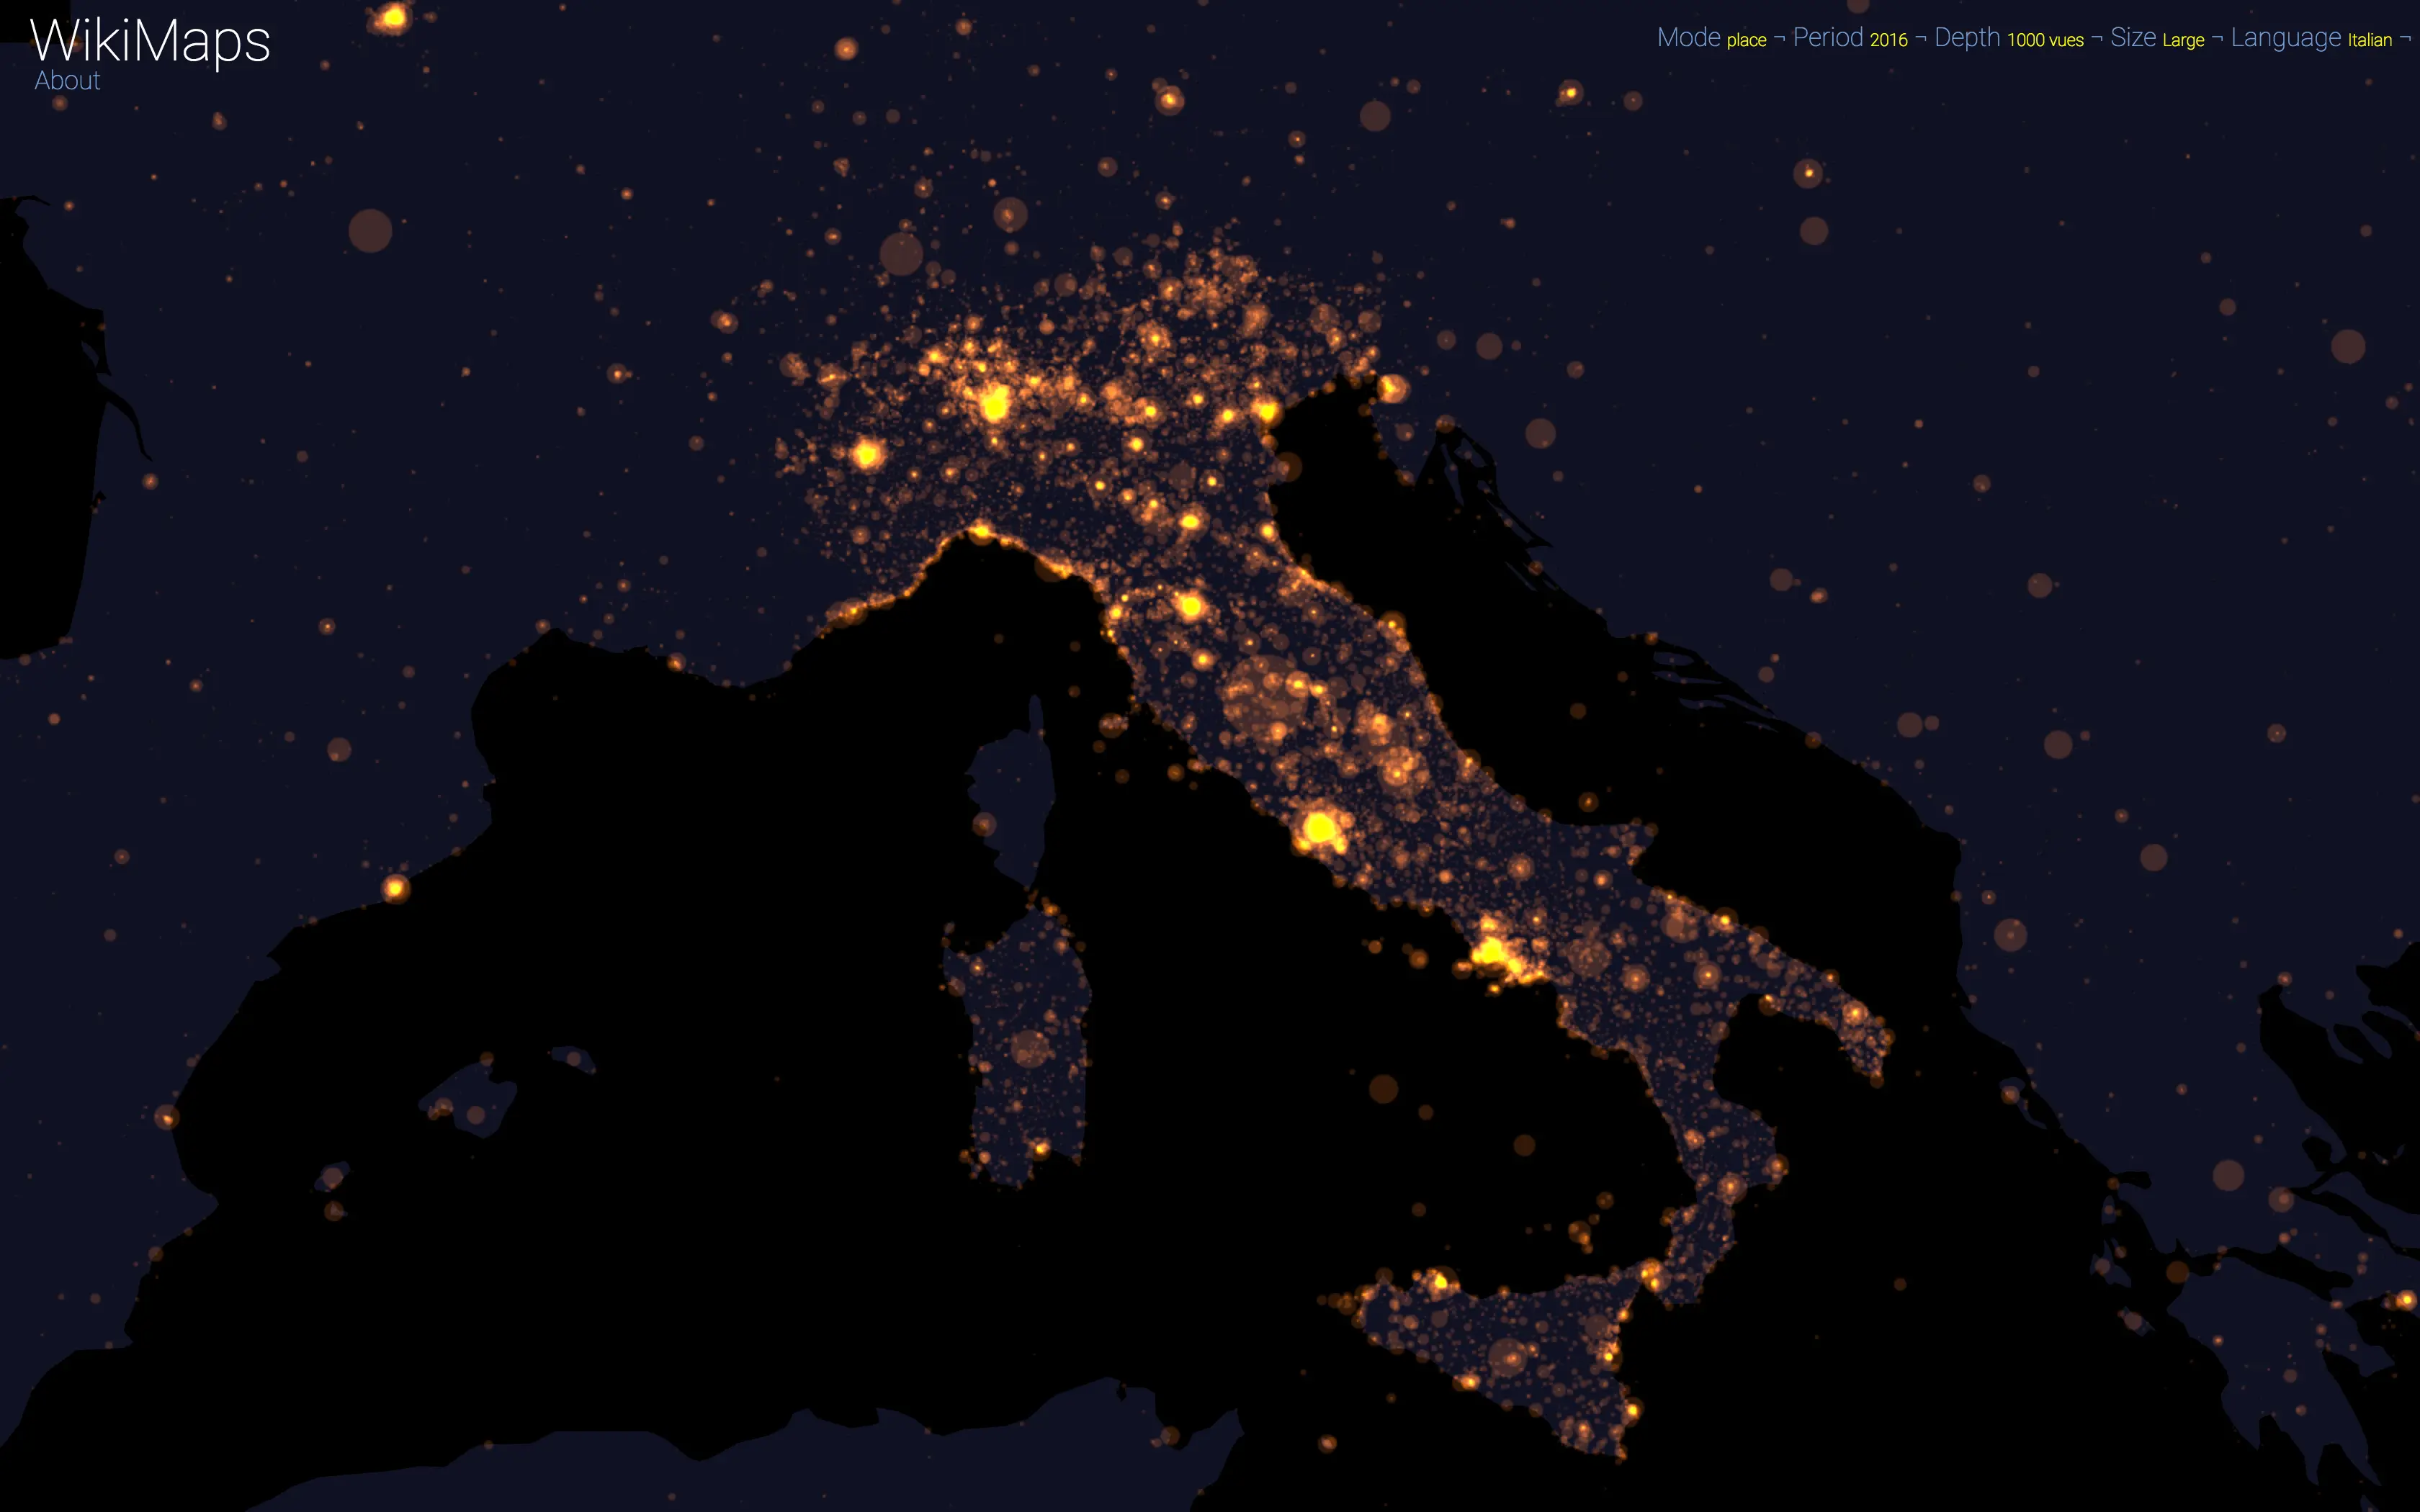
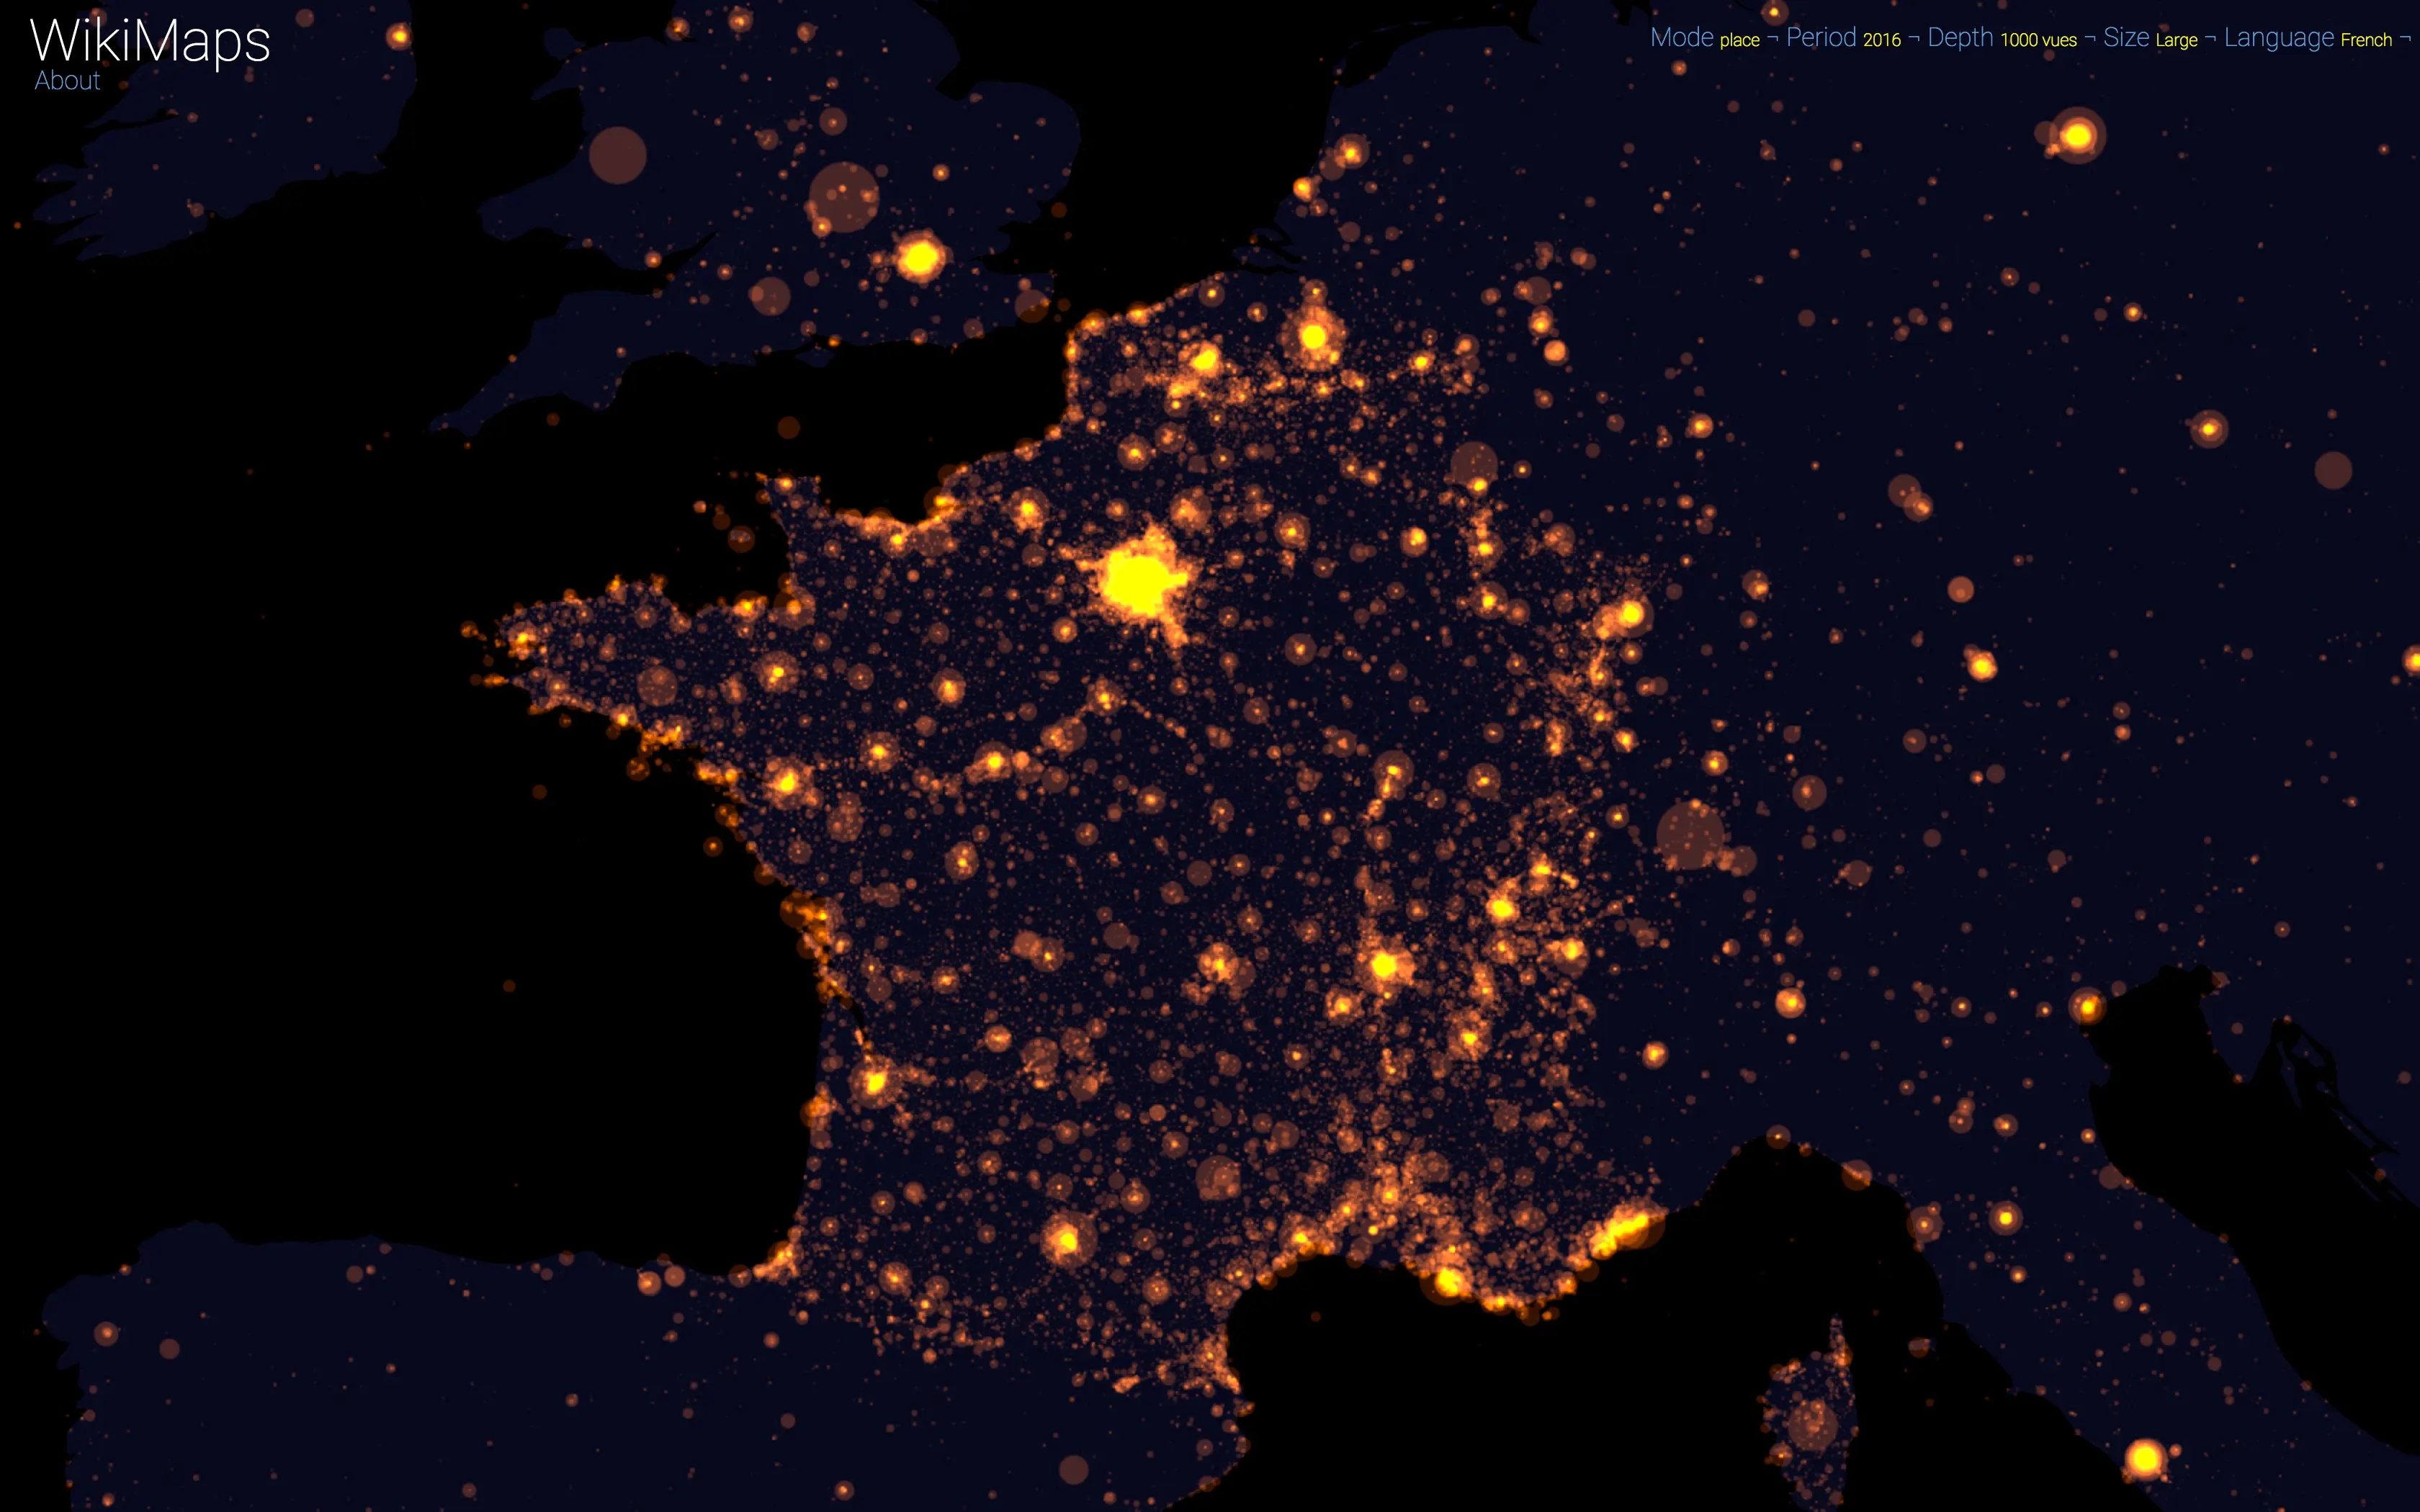
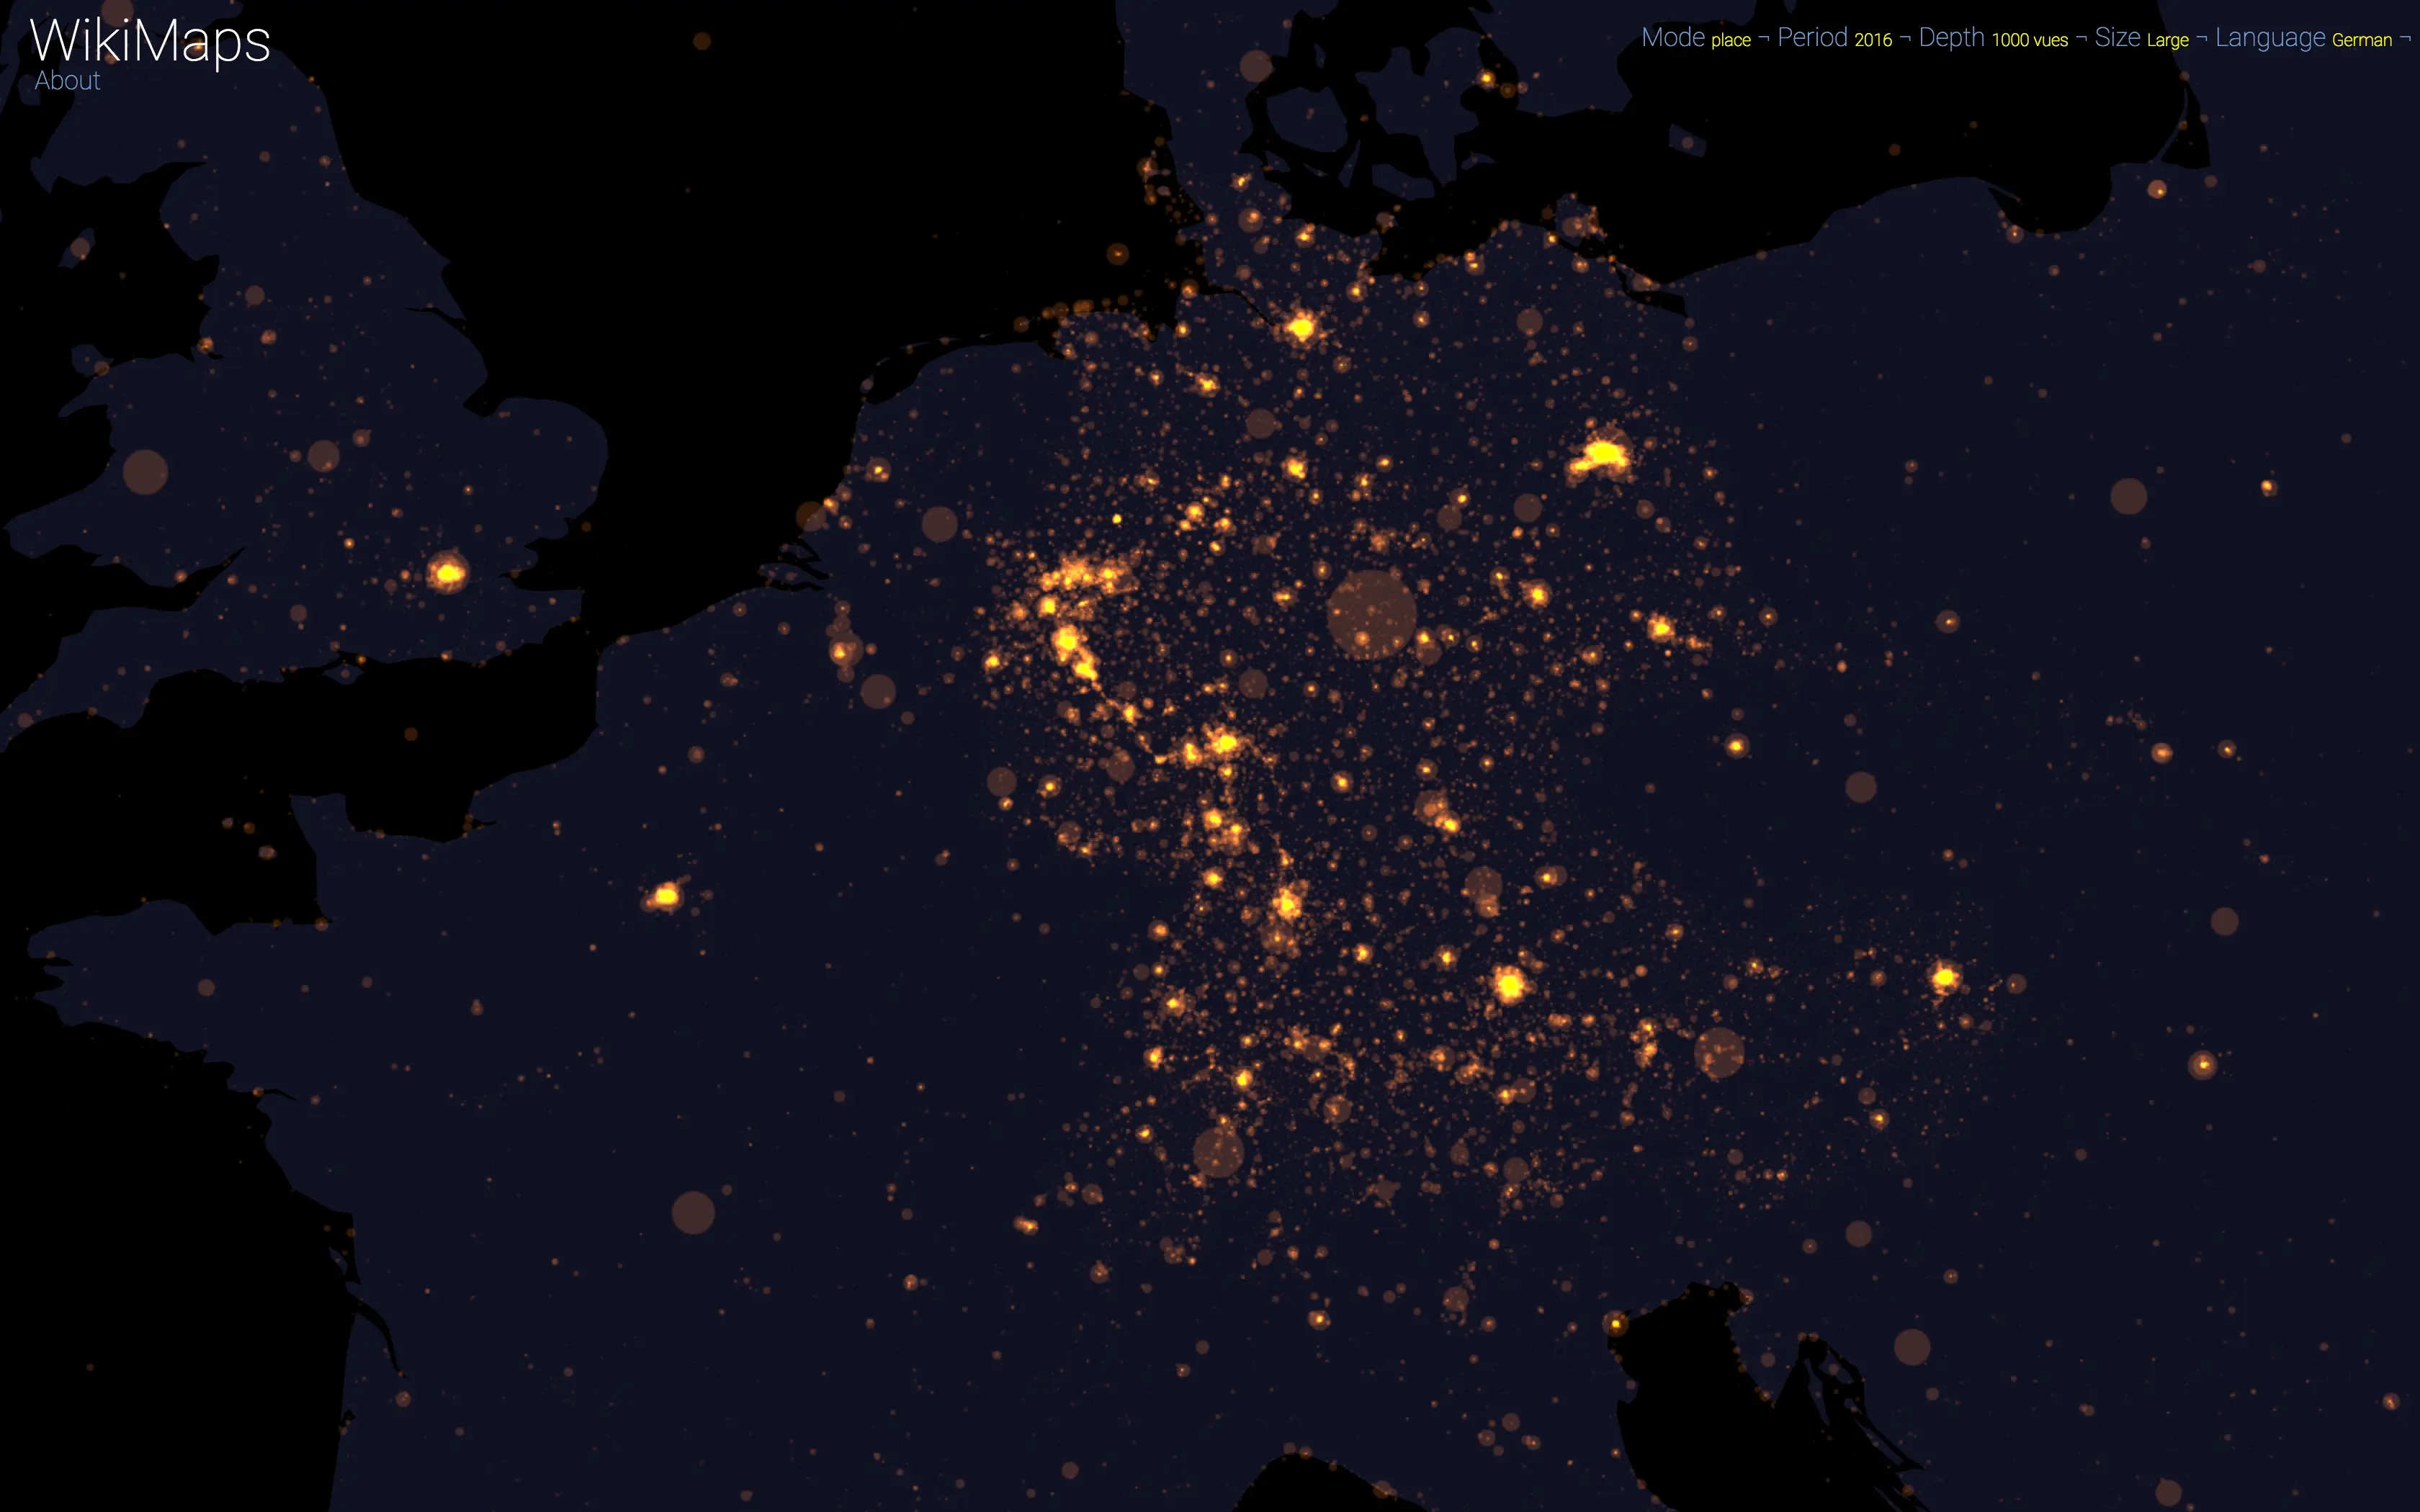
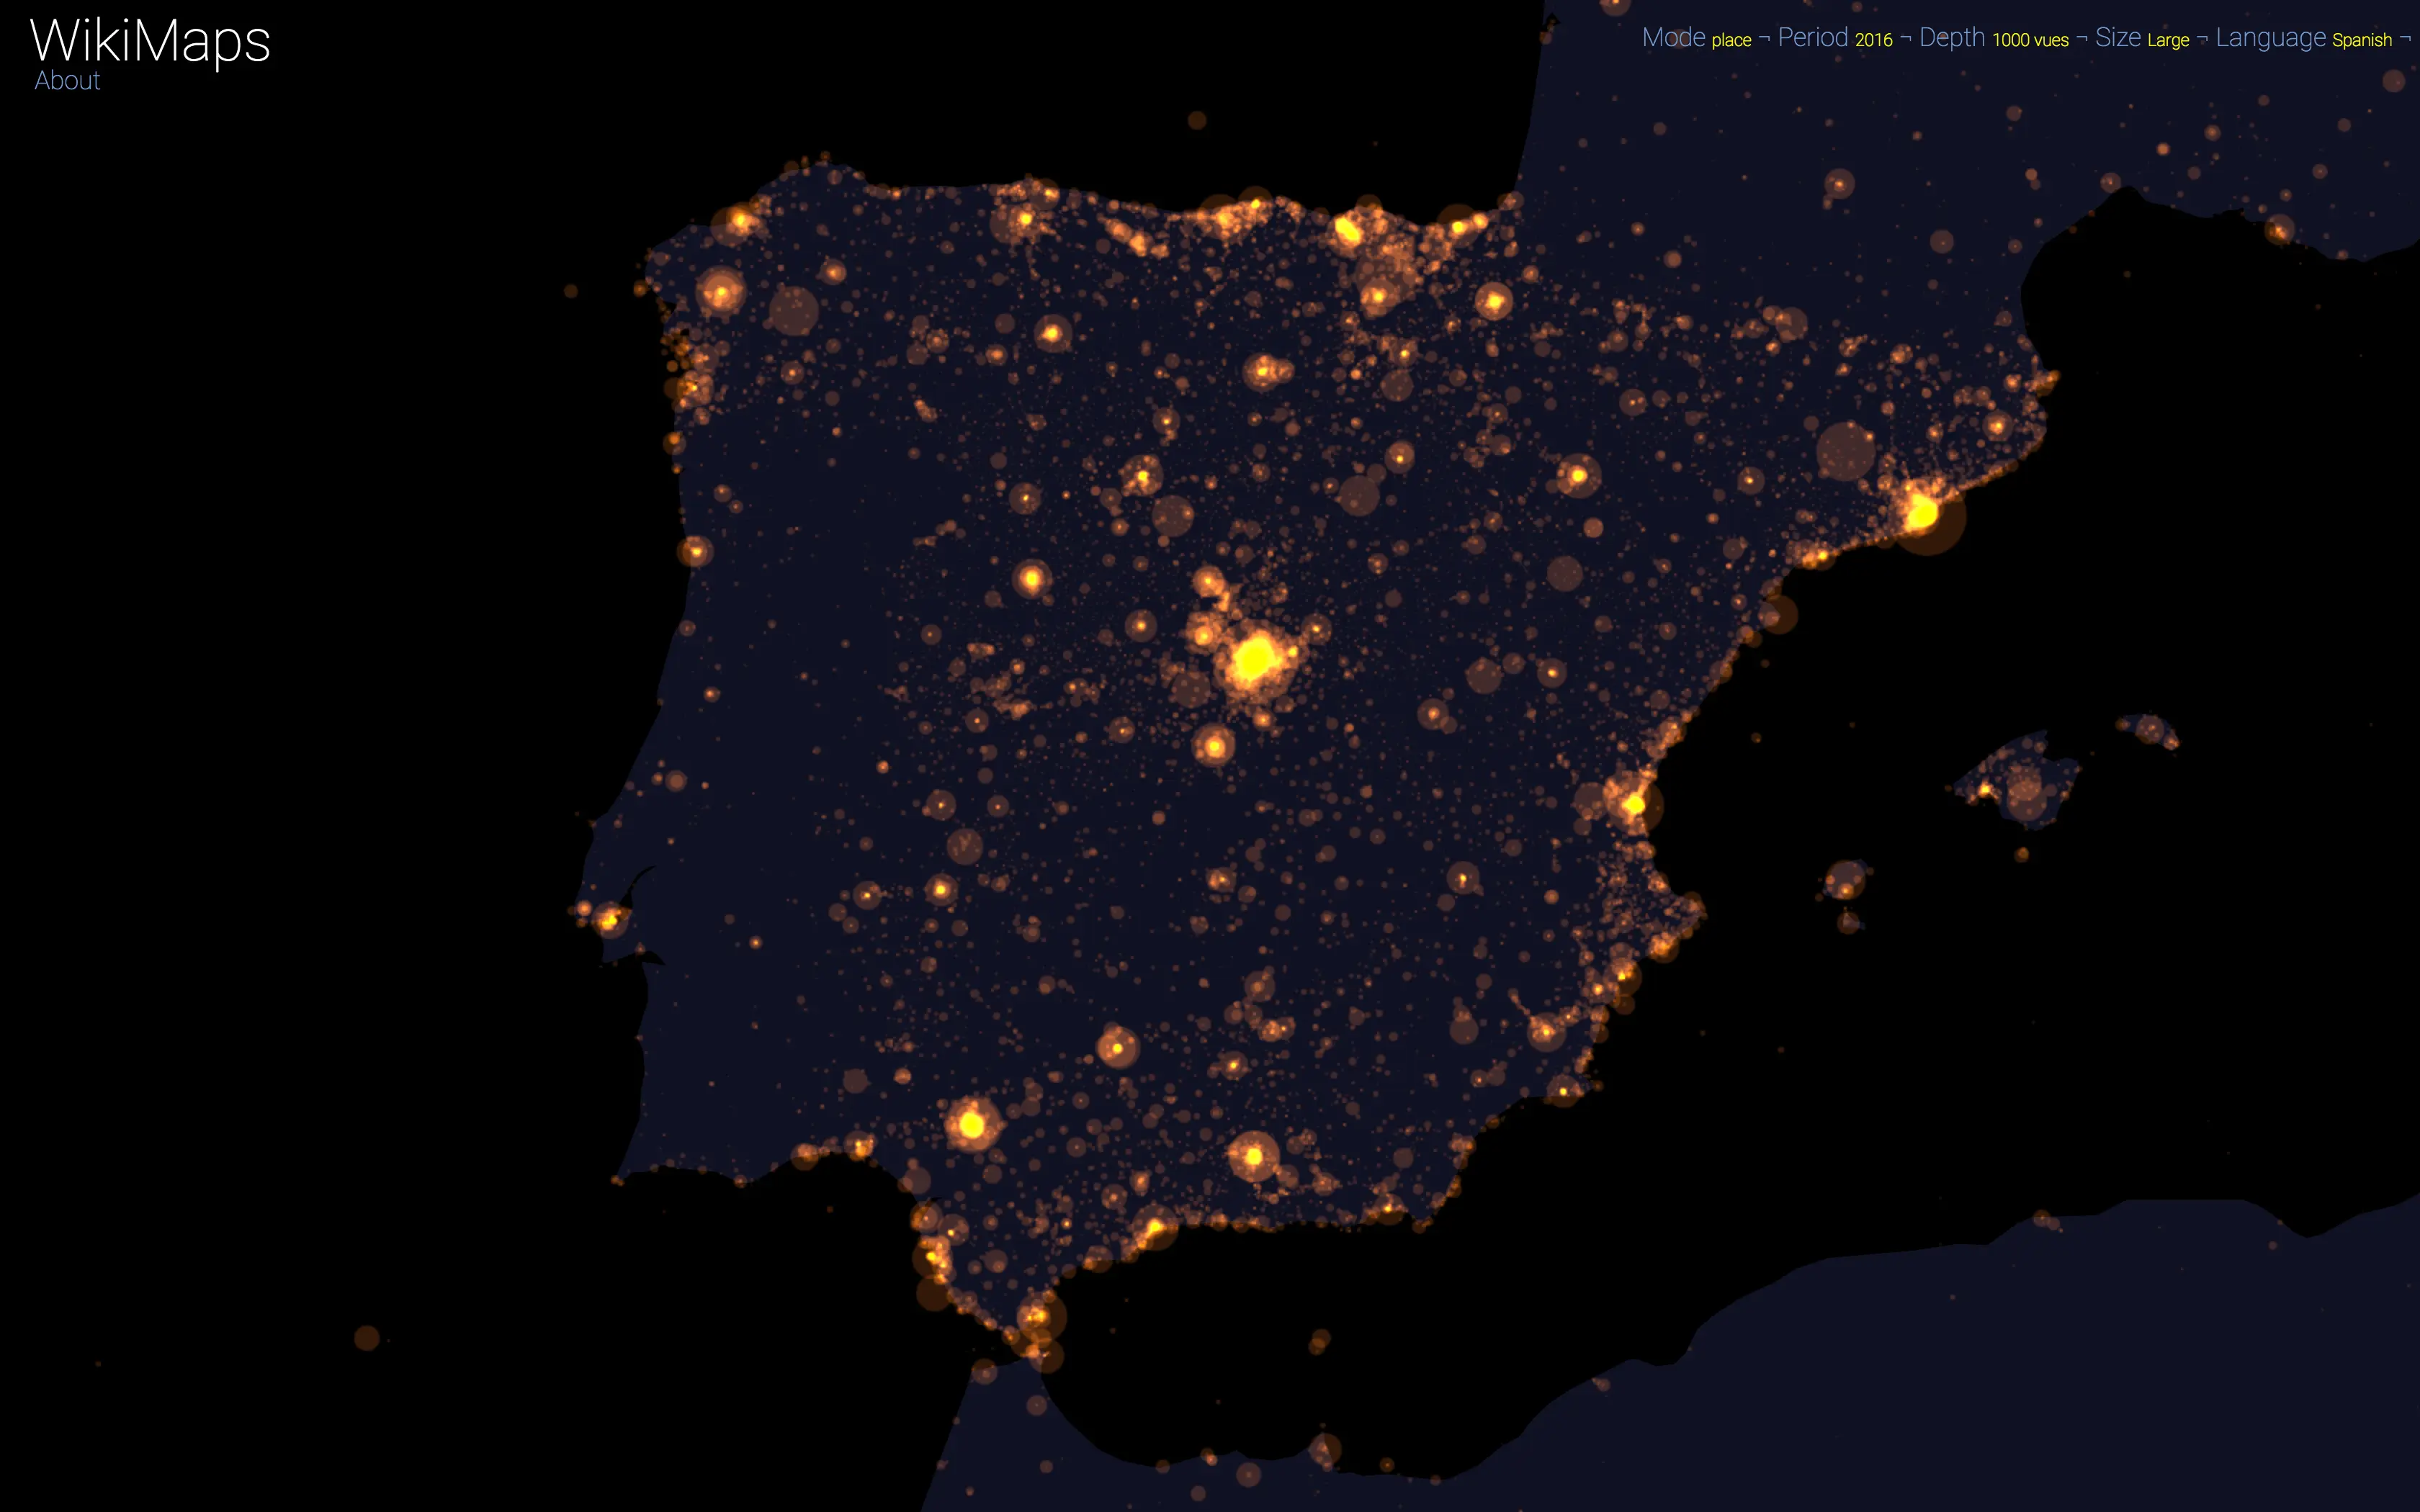
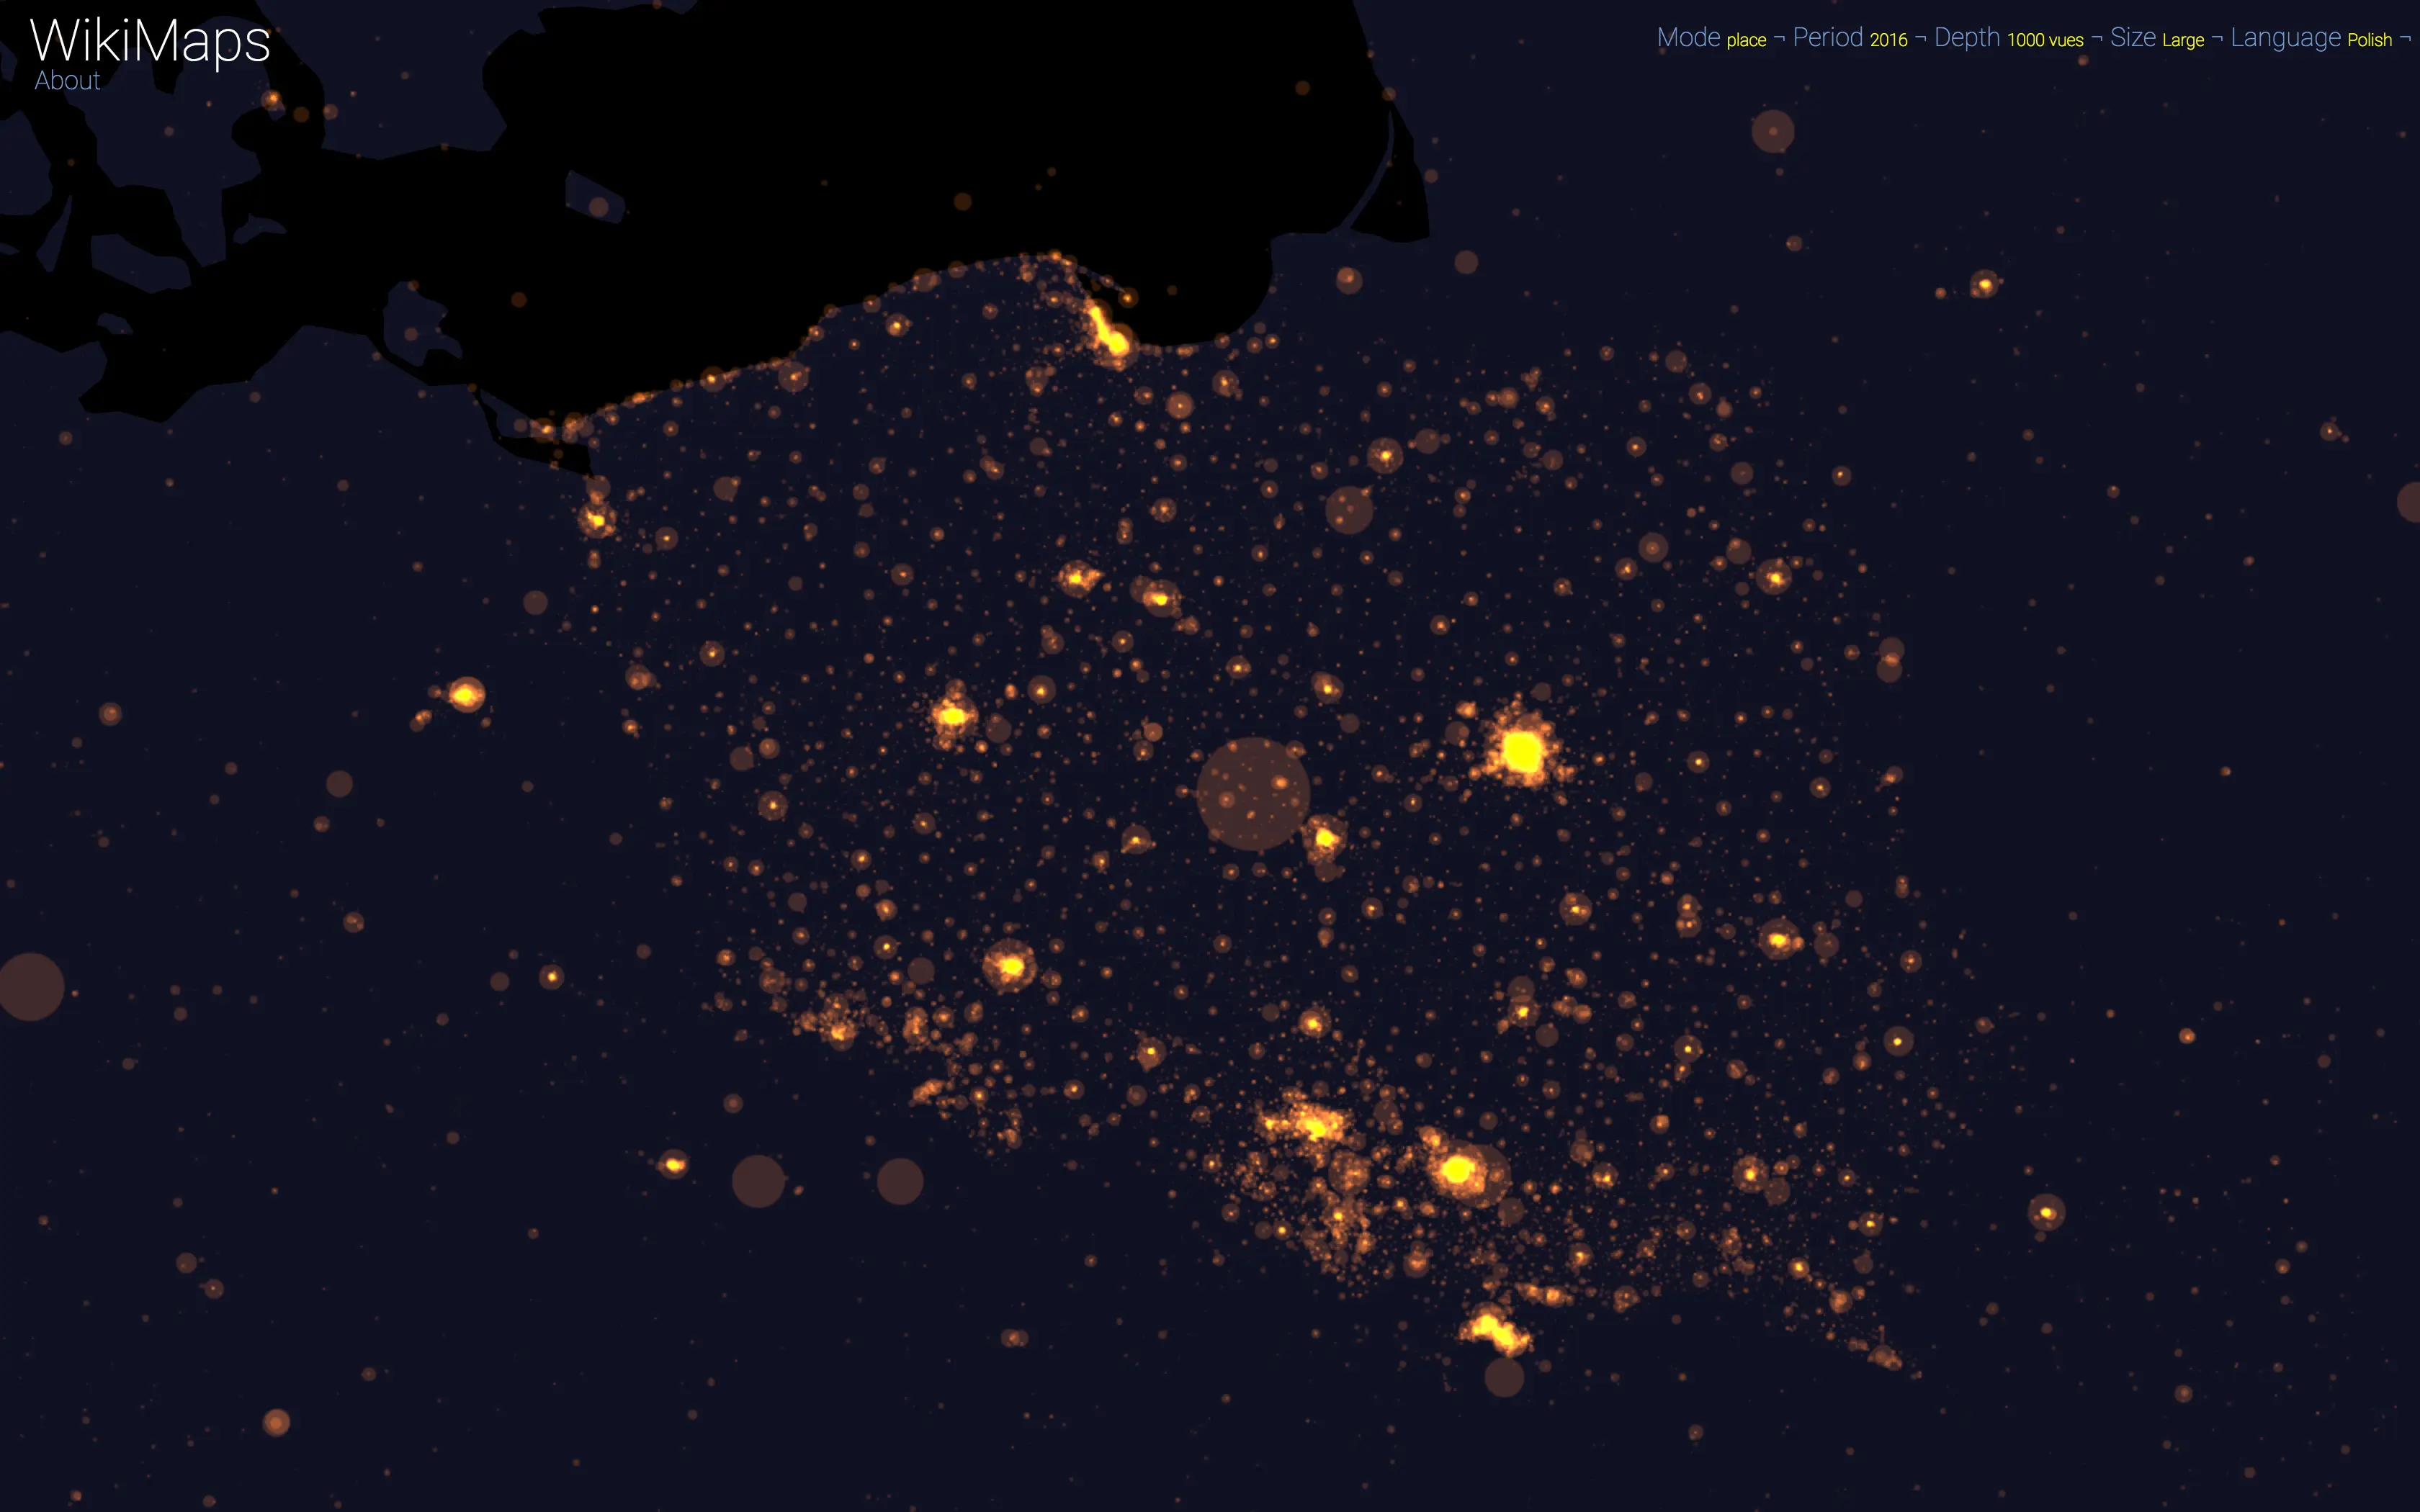
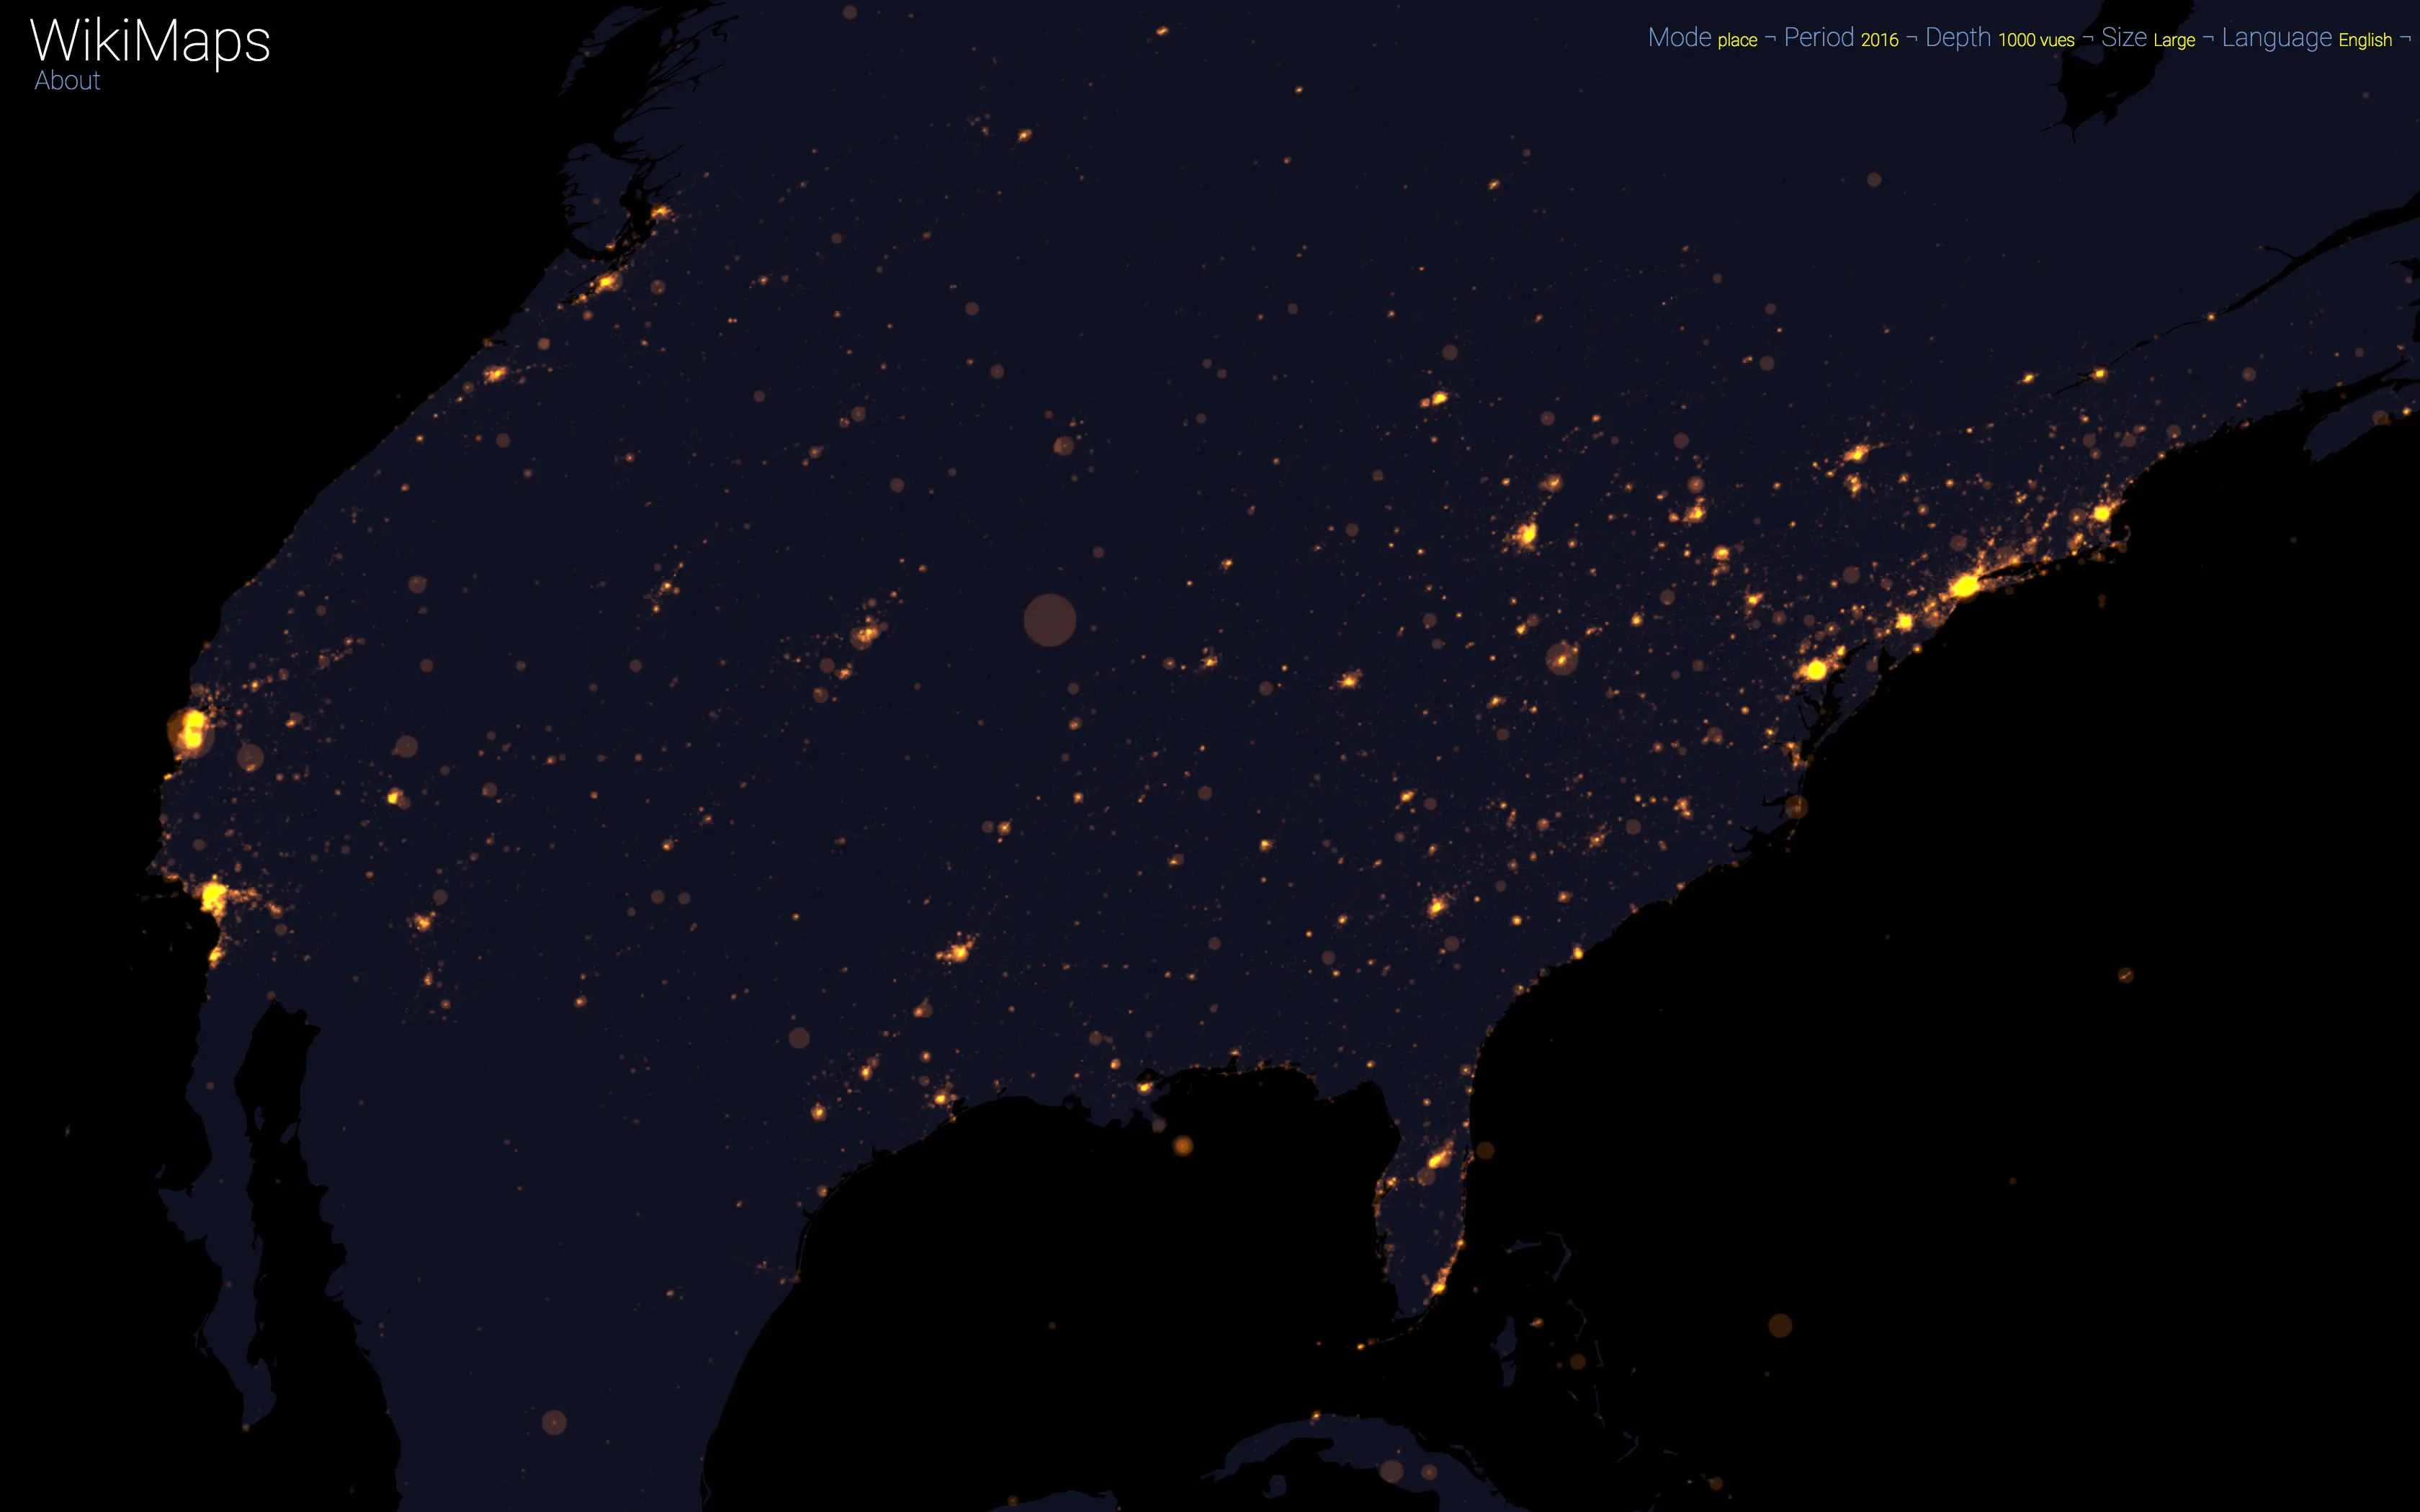
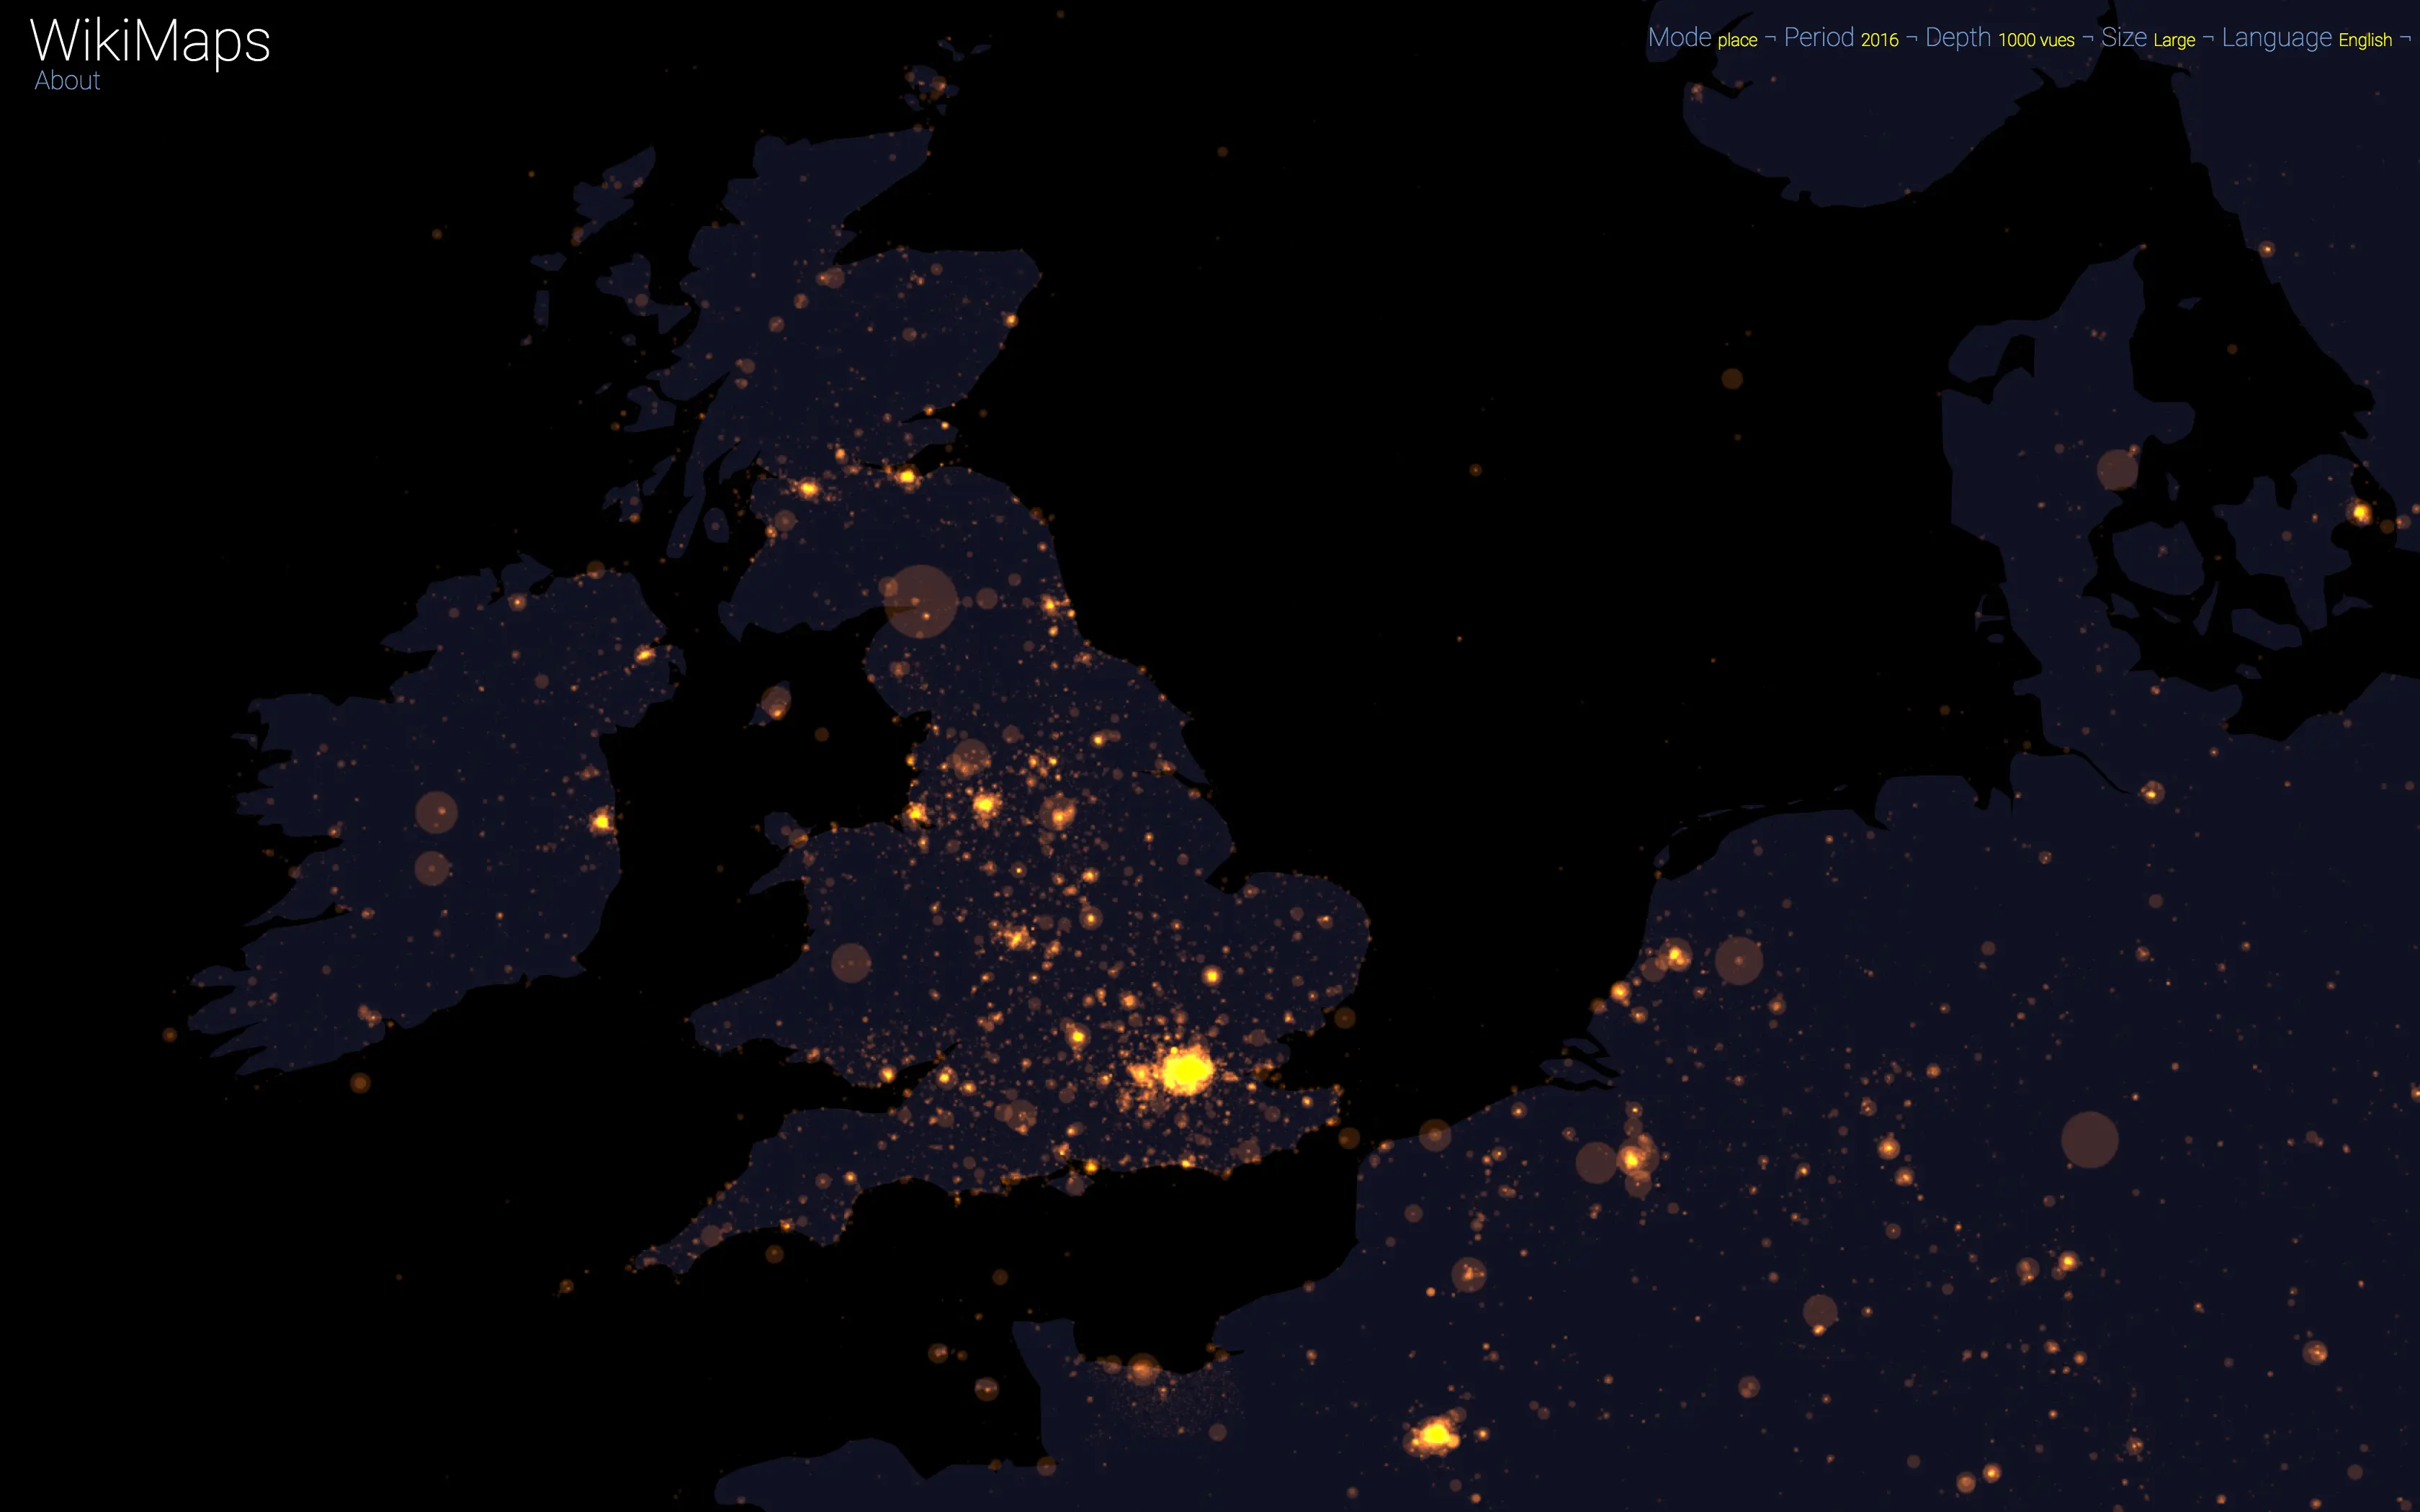
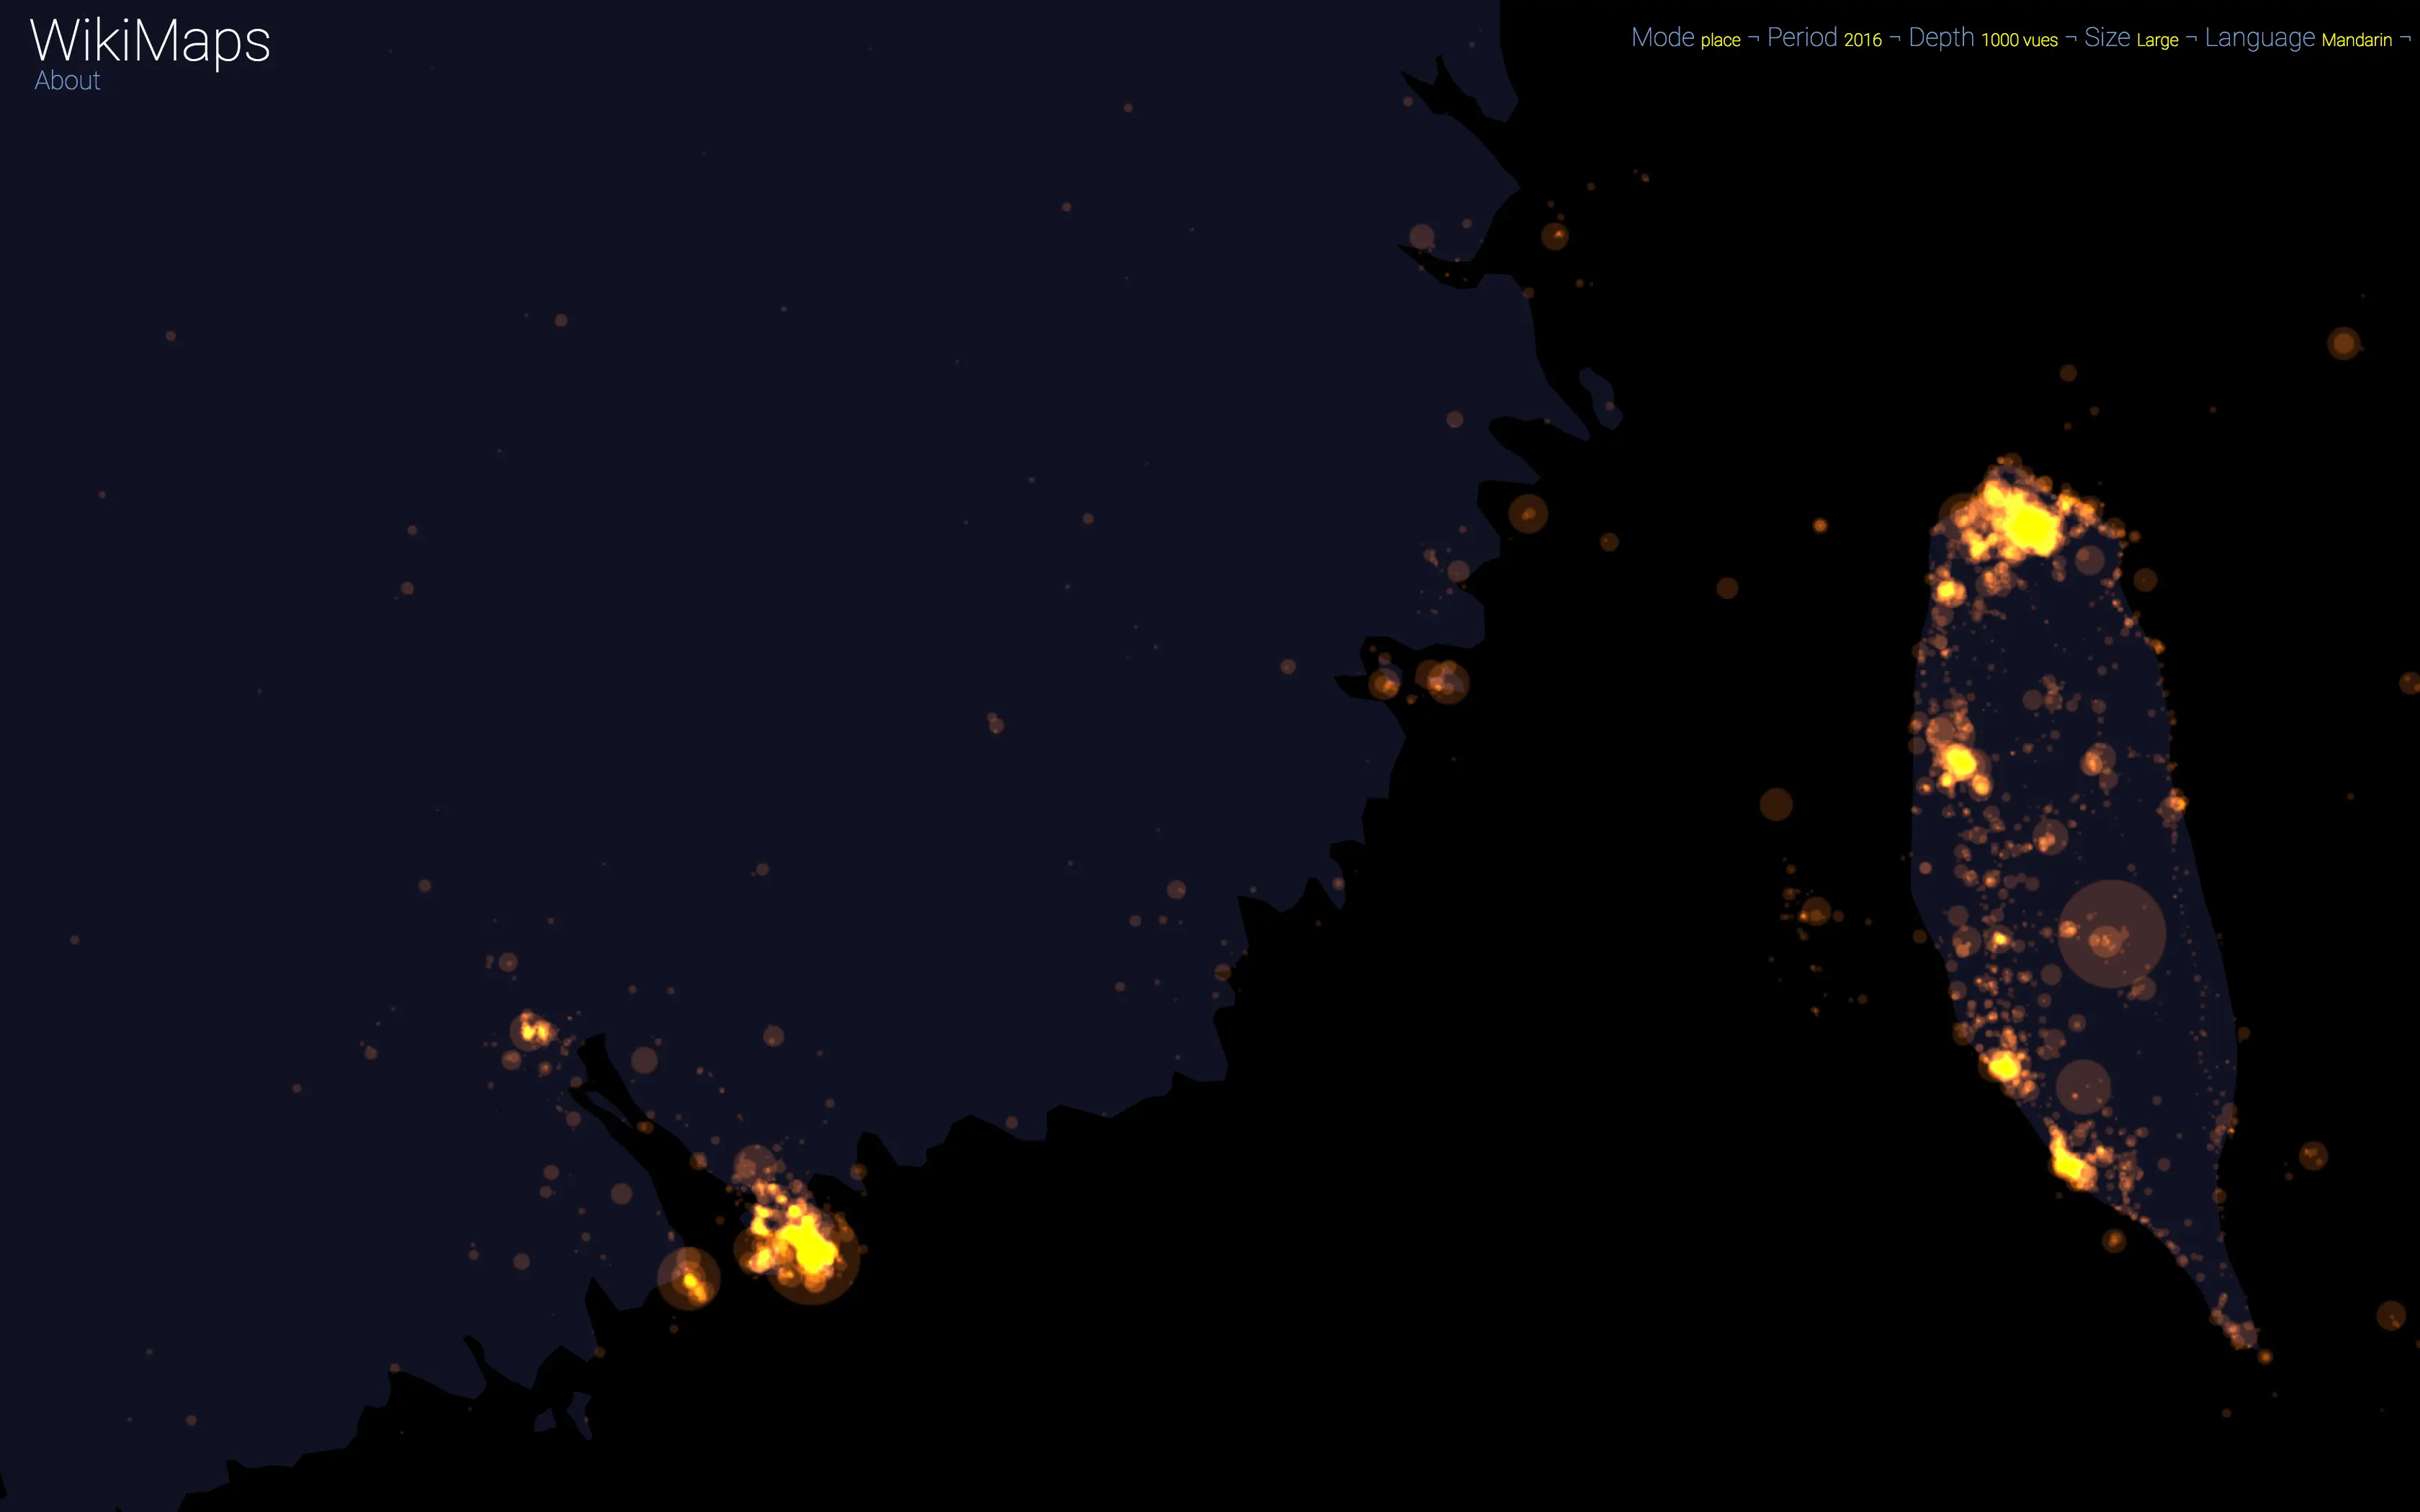
WikiMaps allows you to zoom in on any part of the world. It is thus possible to observe more precisely phenomena relating to a particular edition of Wikipedia (language) and to identify many details, revealing a very clear hierarchy within each space belonging to a particular linguistic area.
Time 2008–2020 version
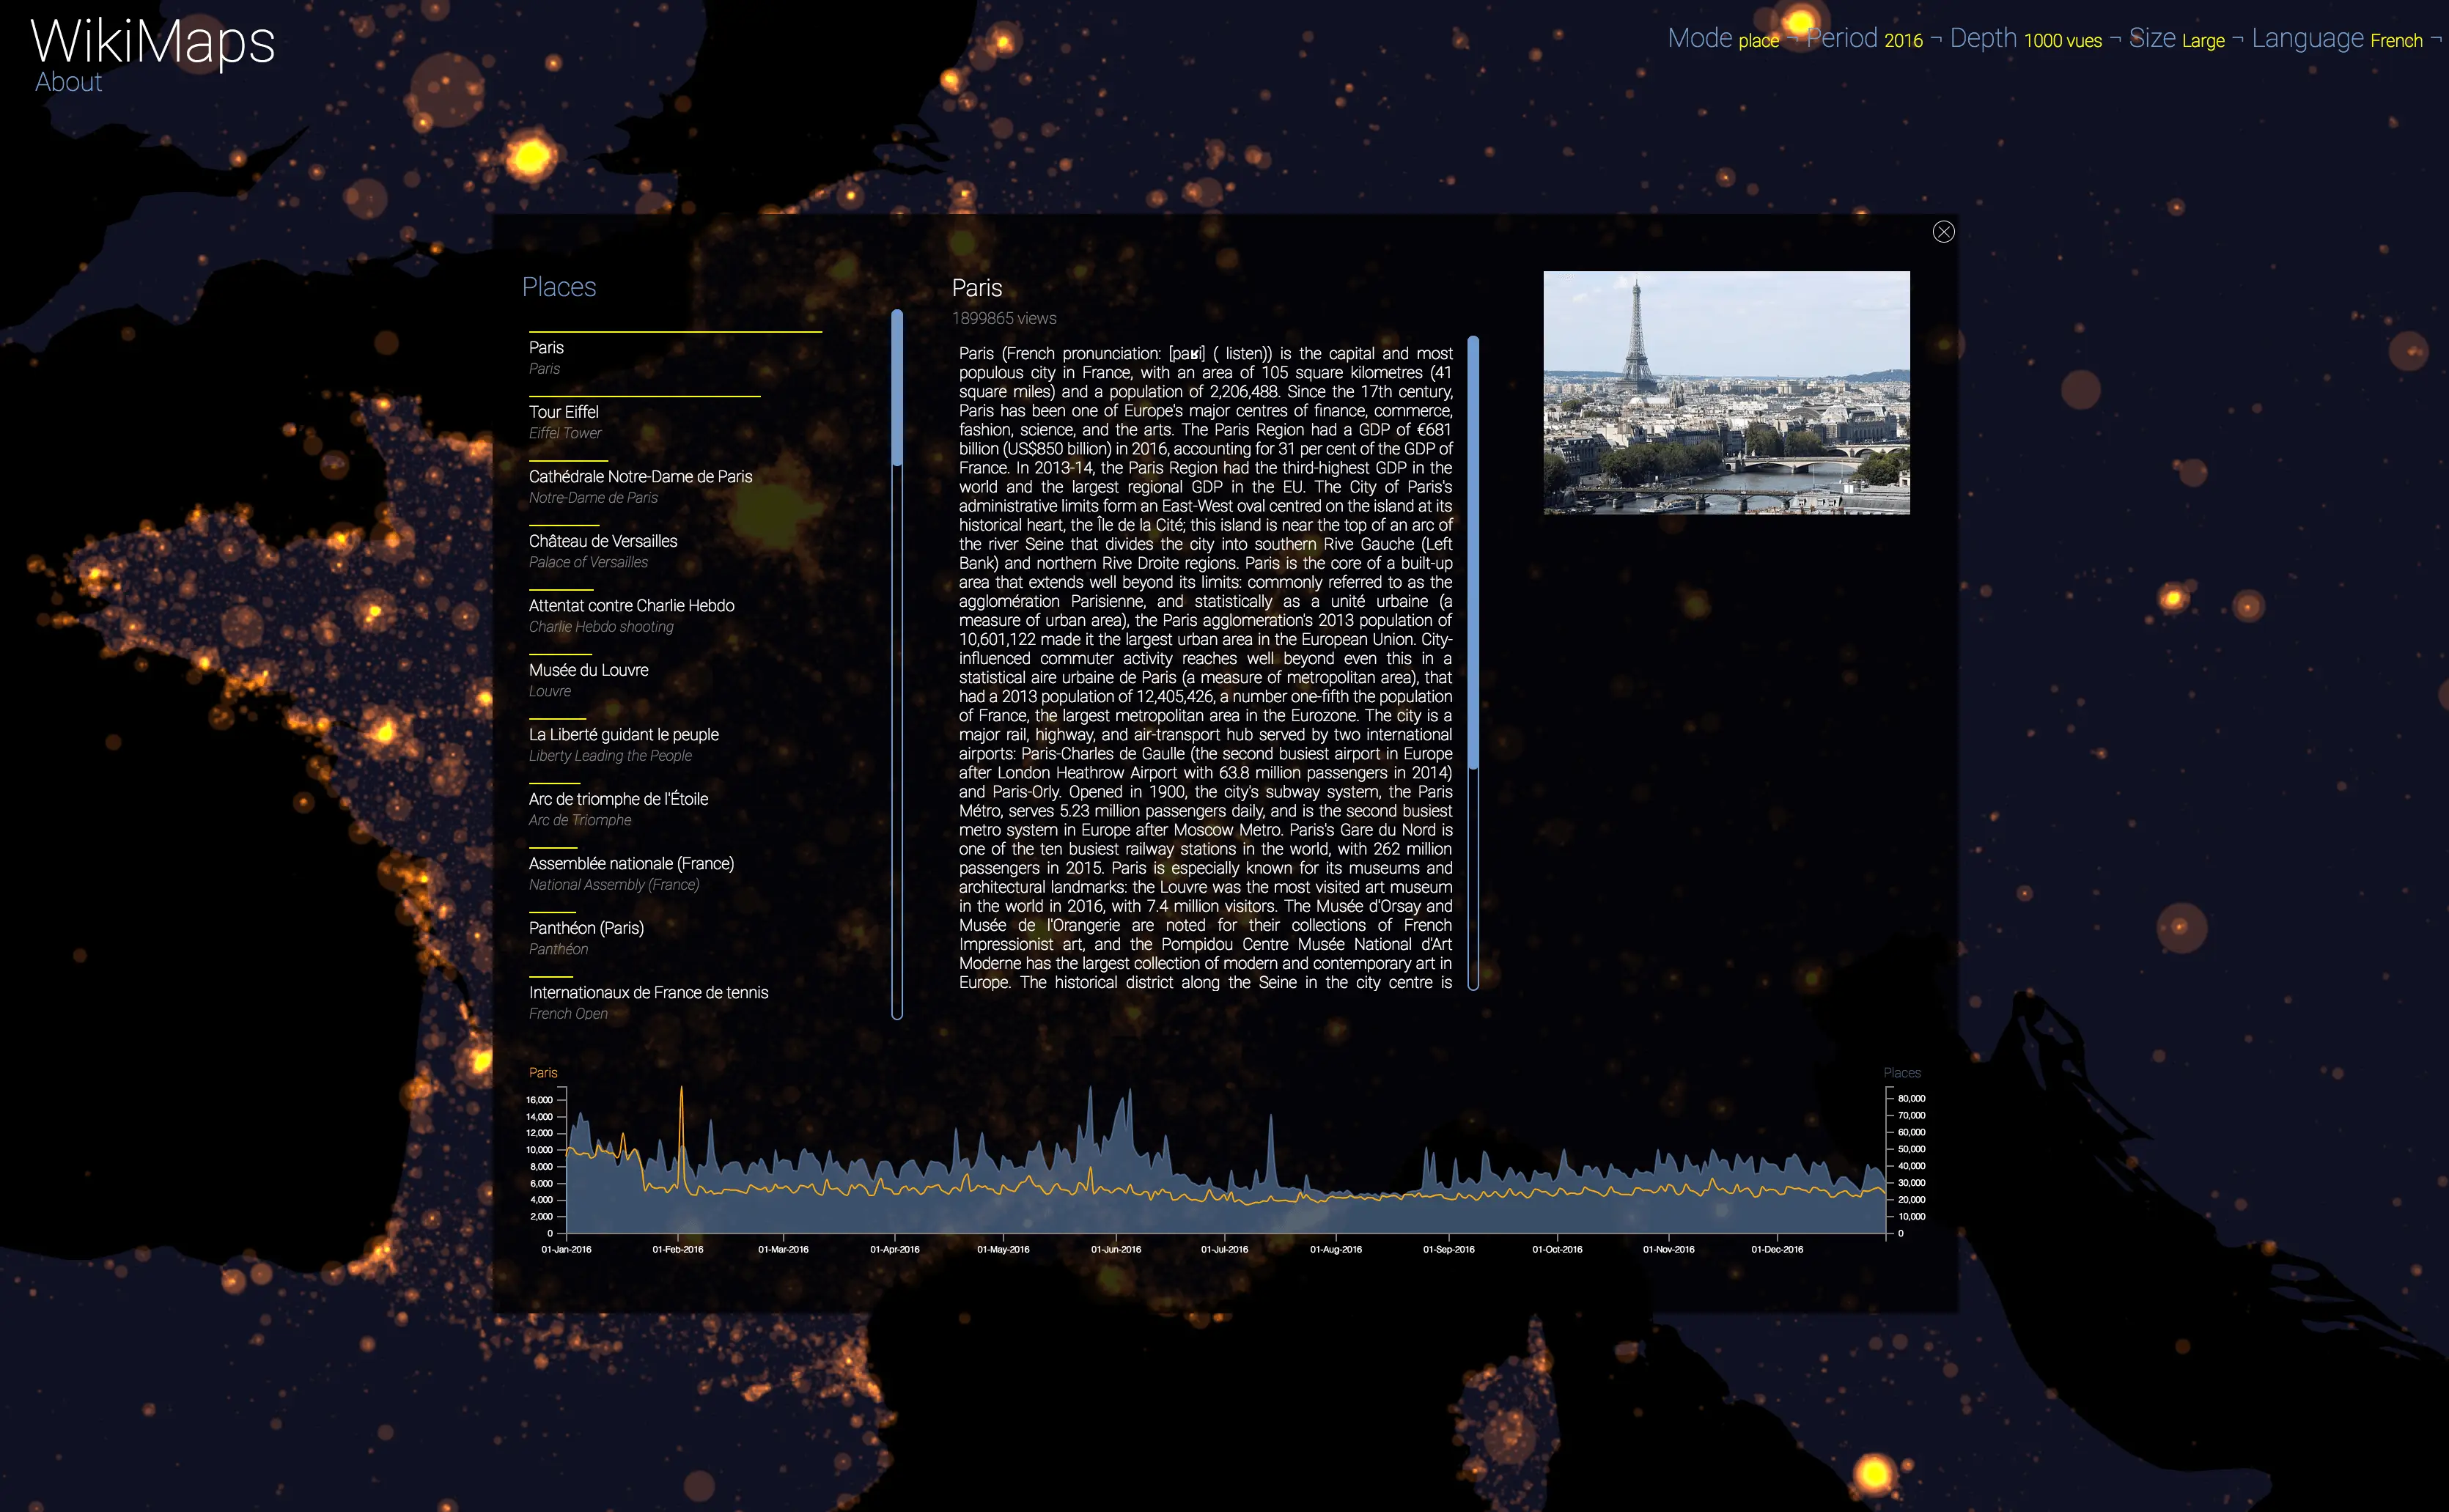
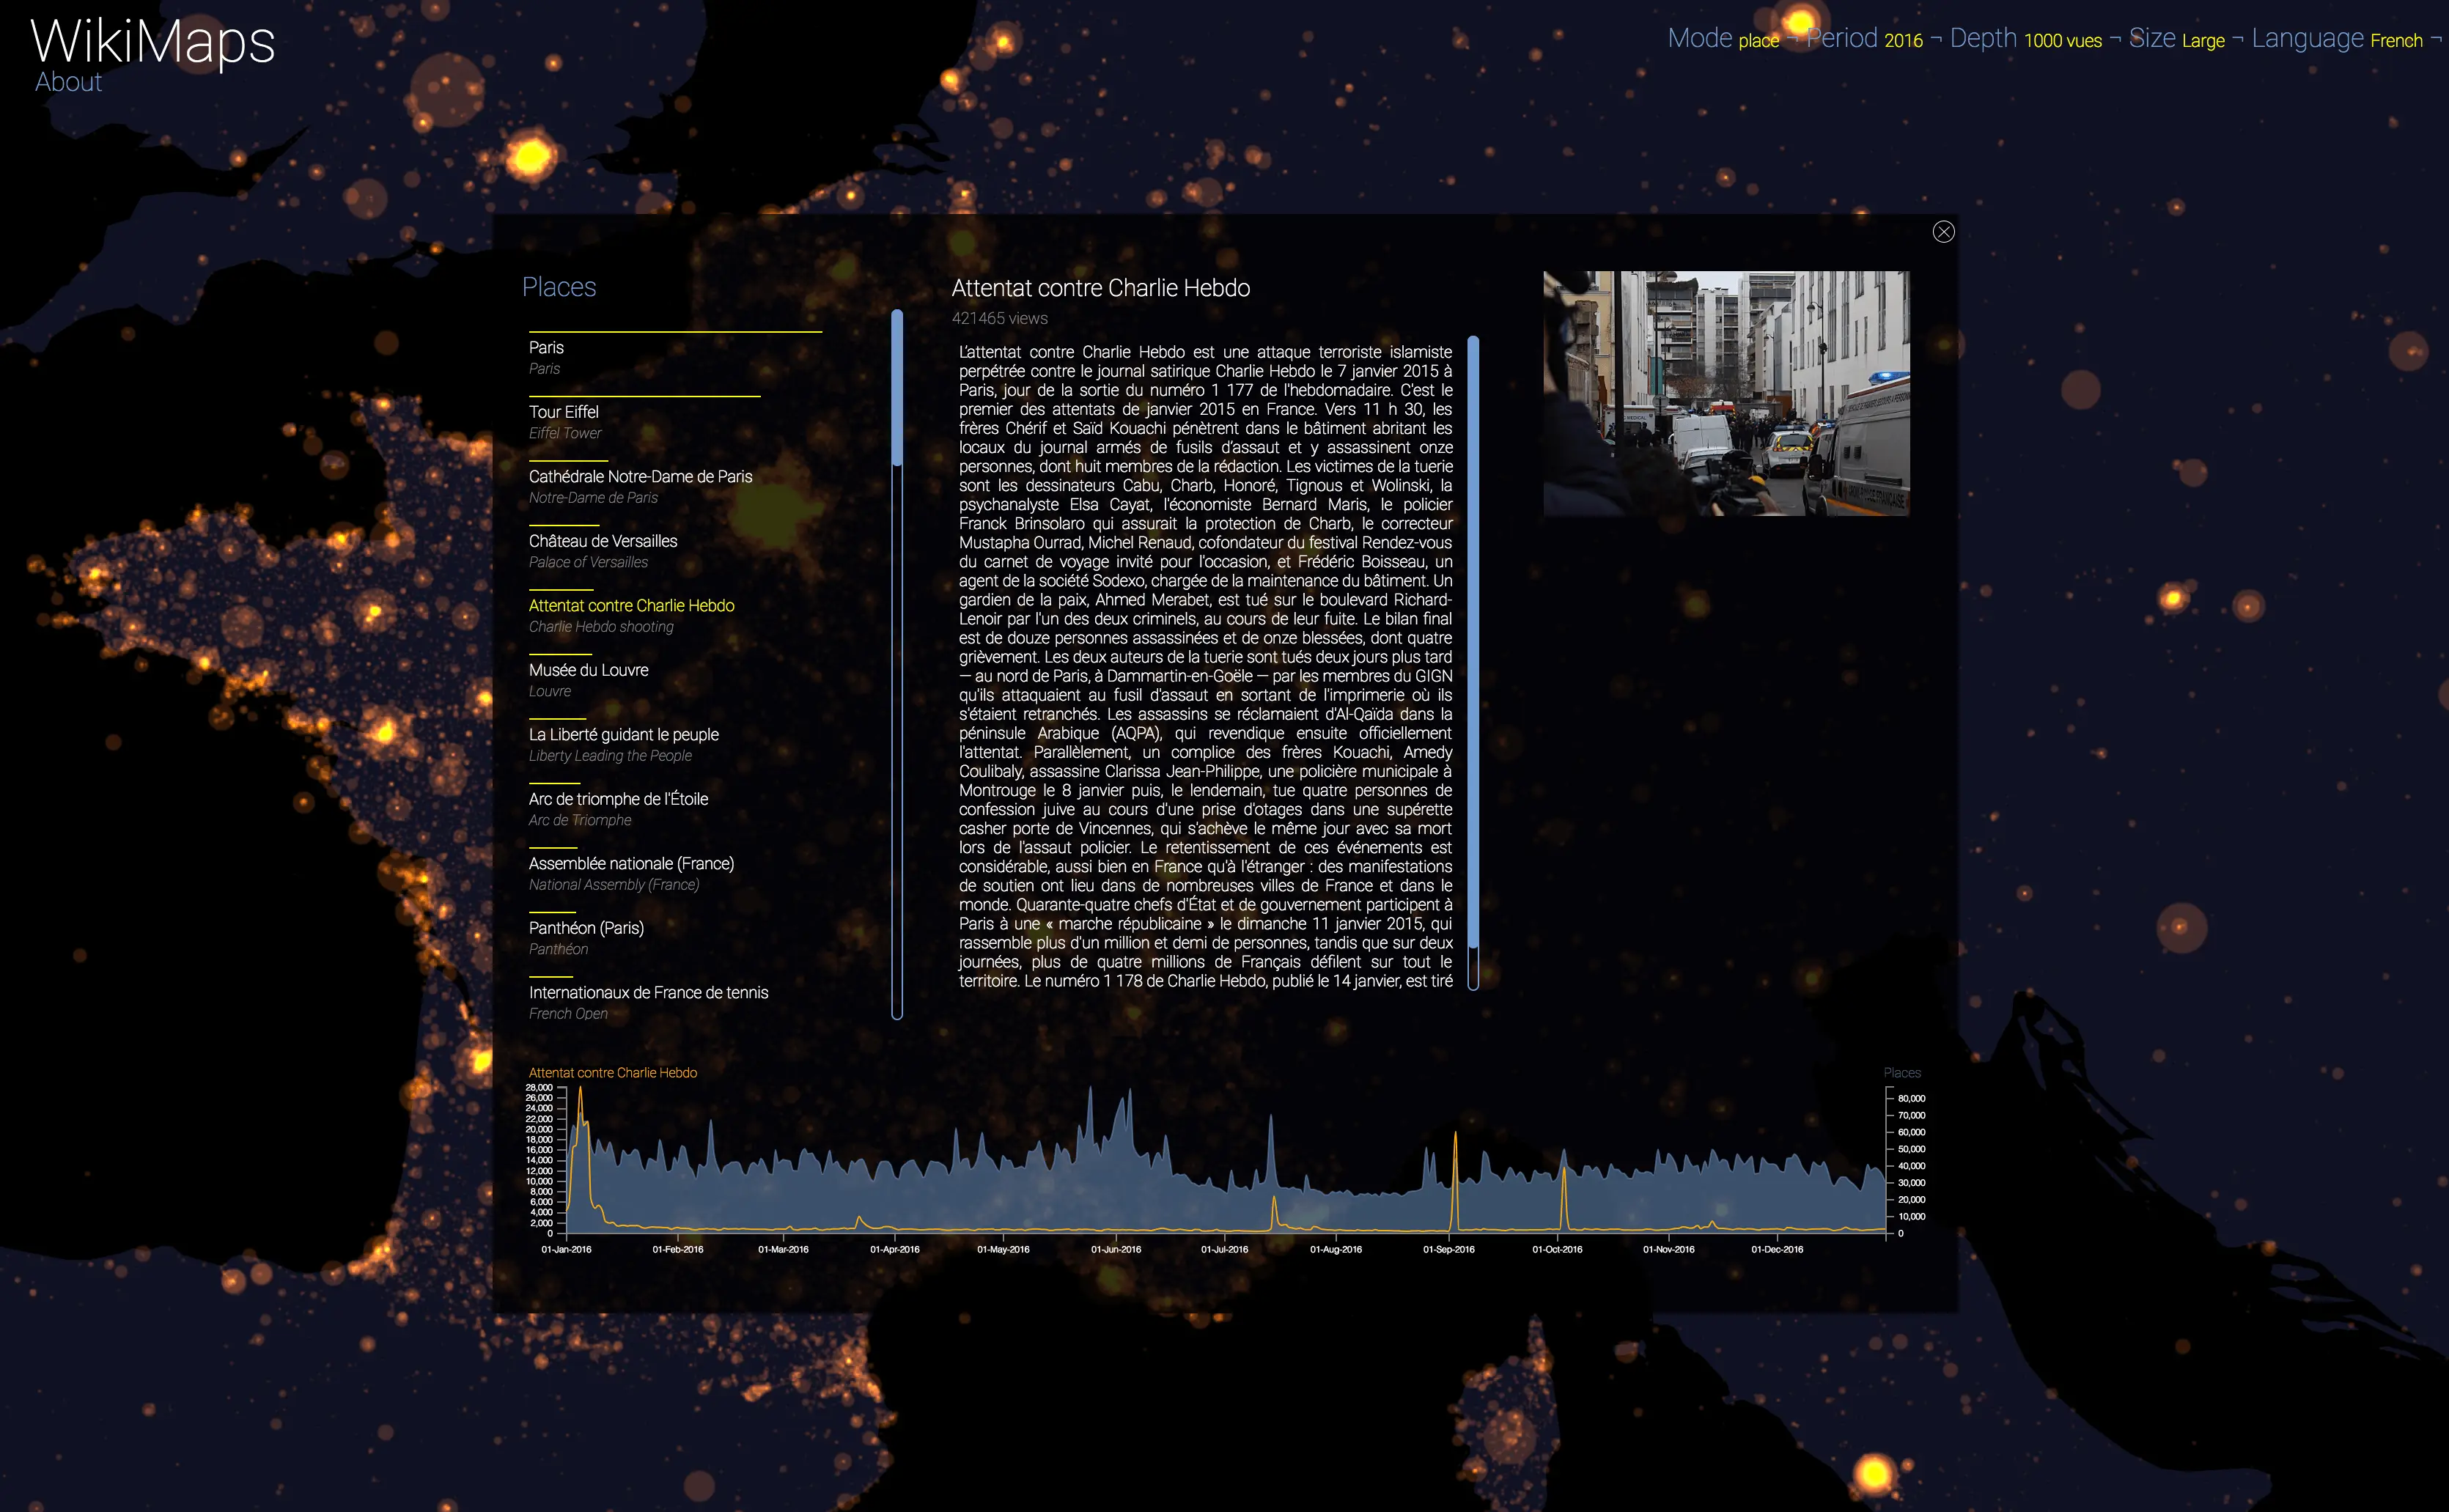
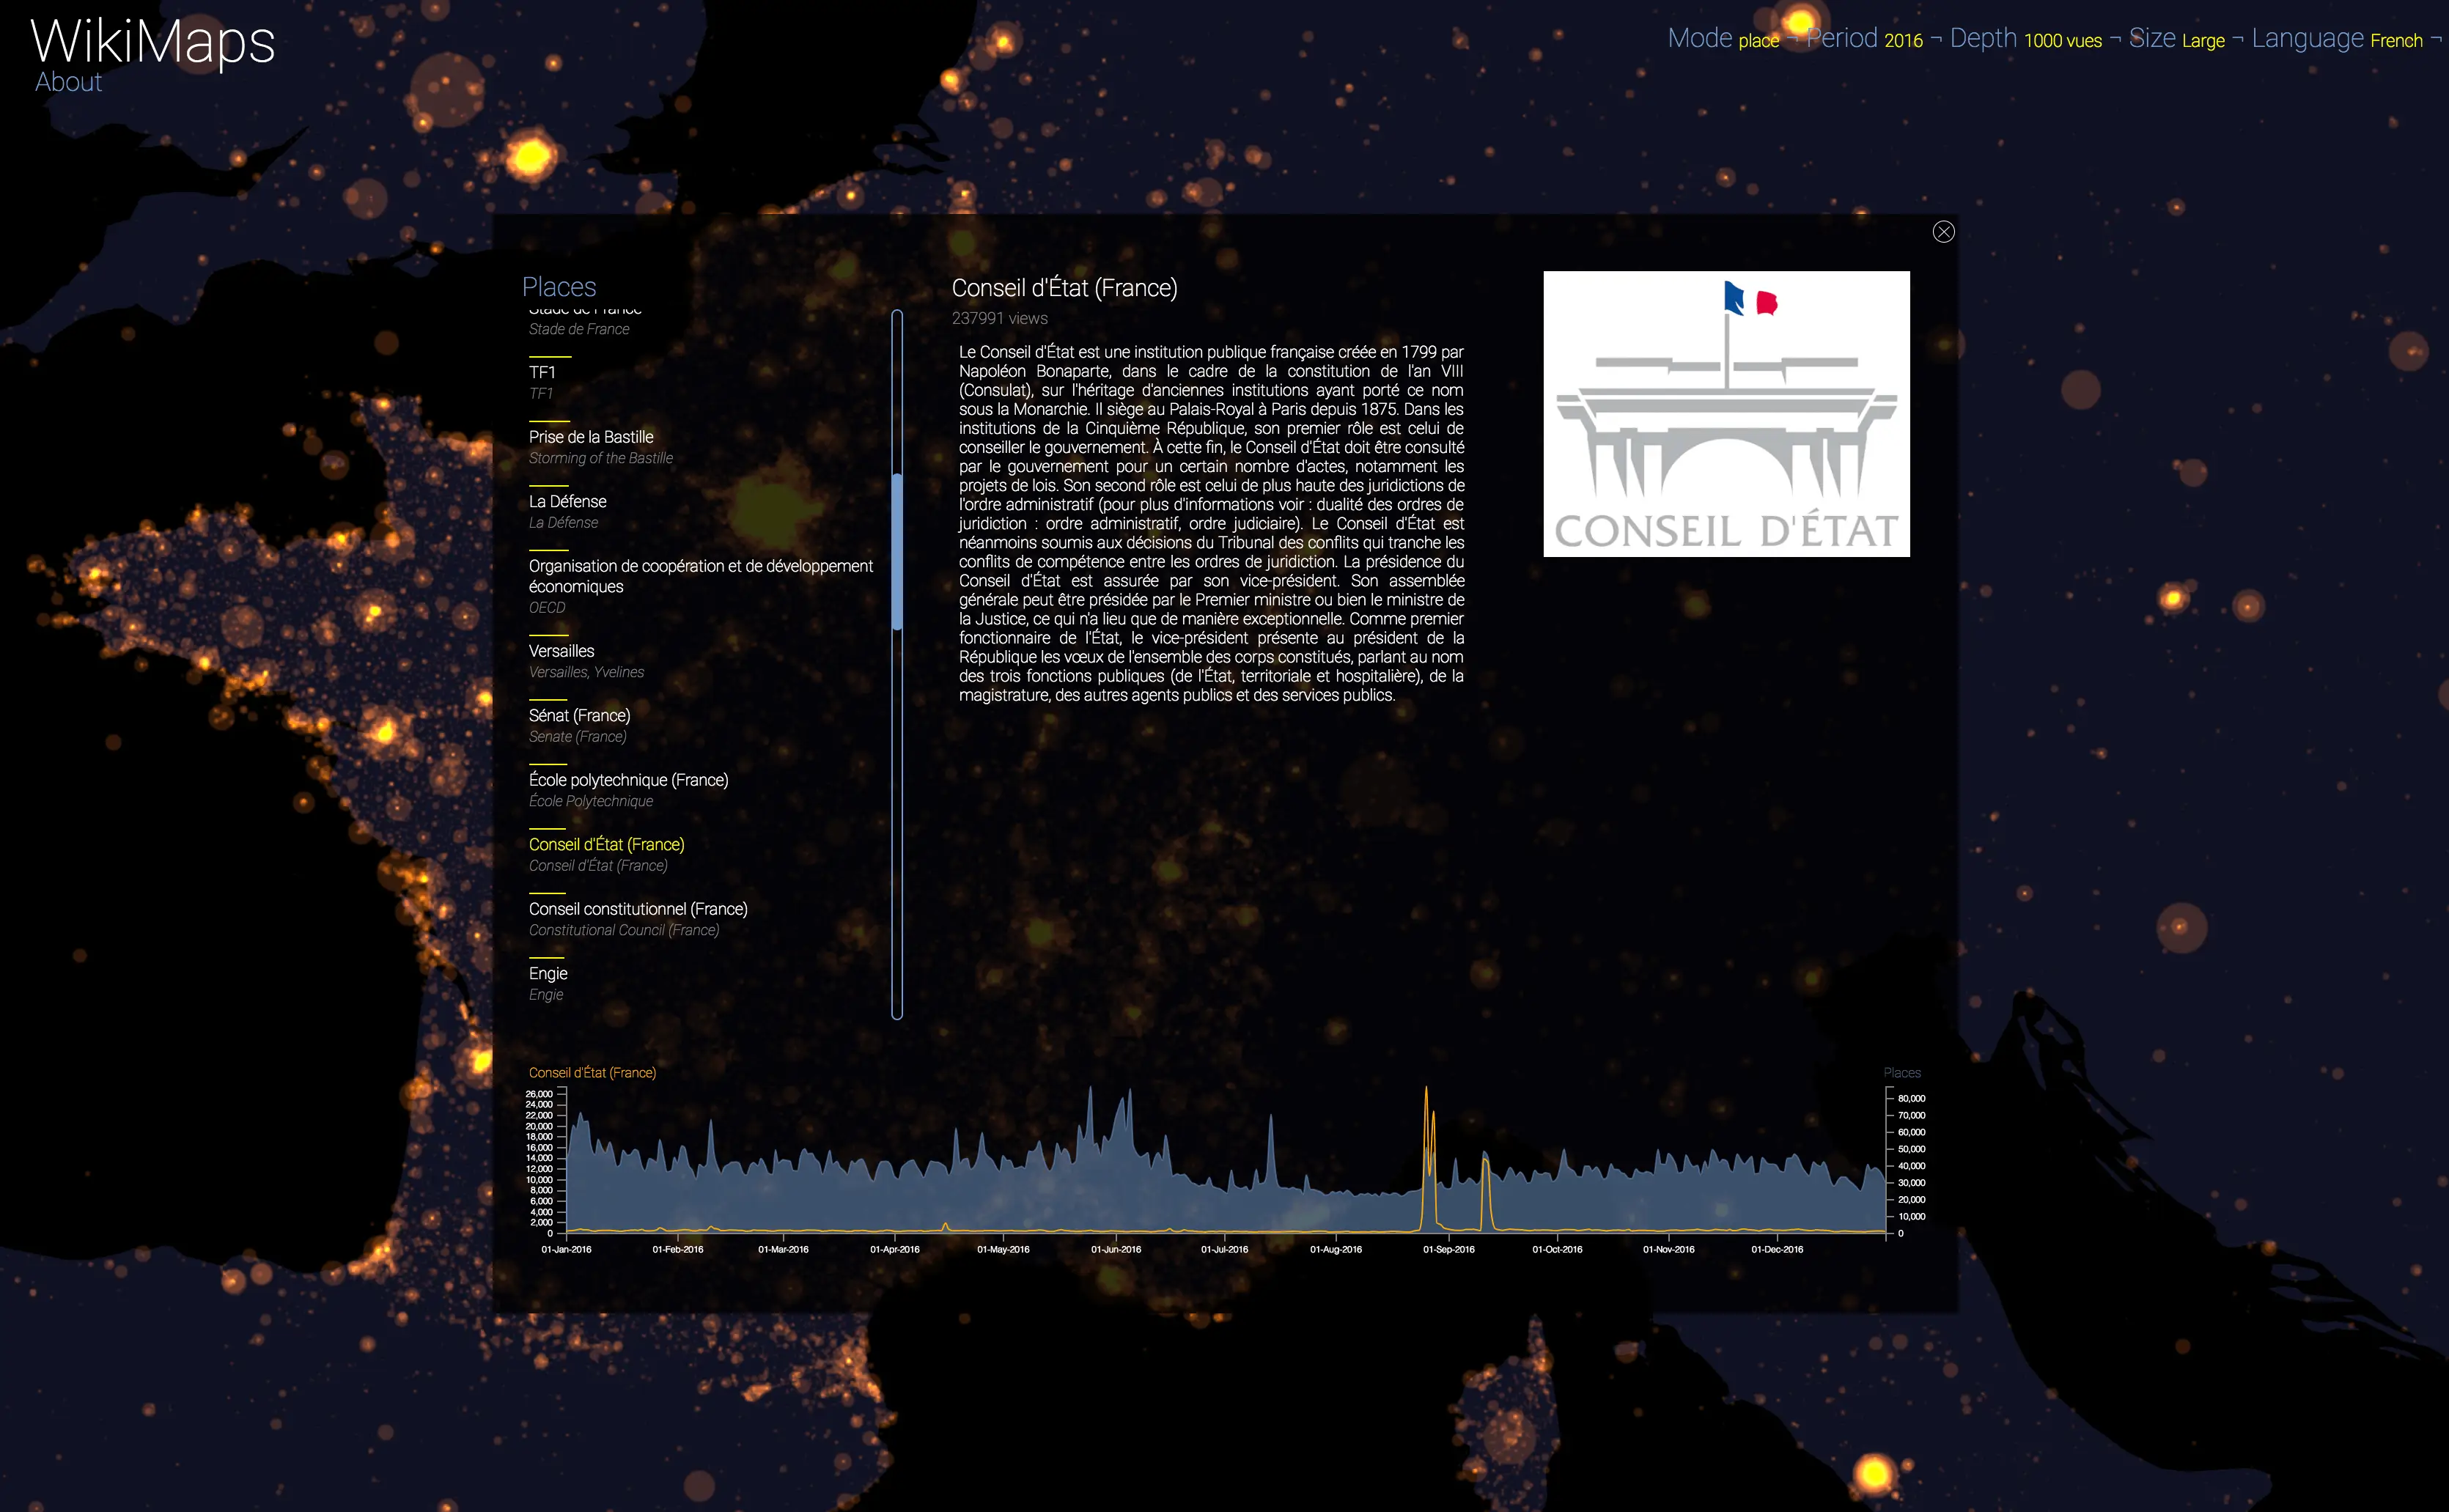
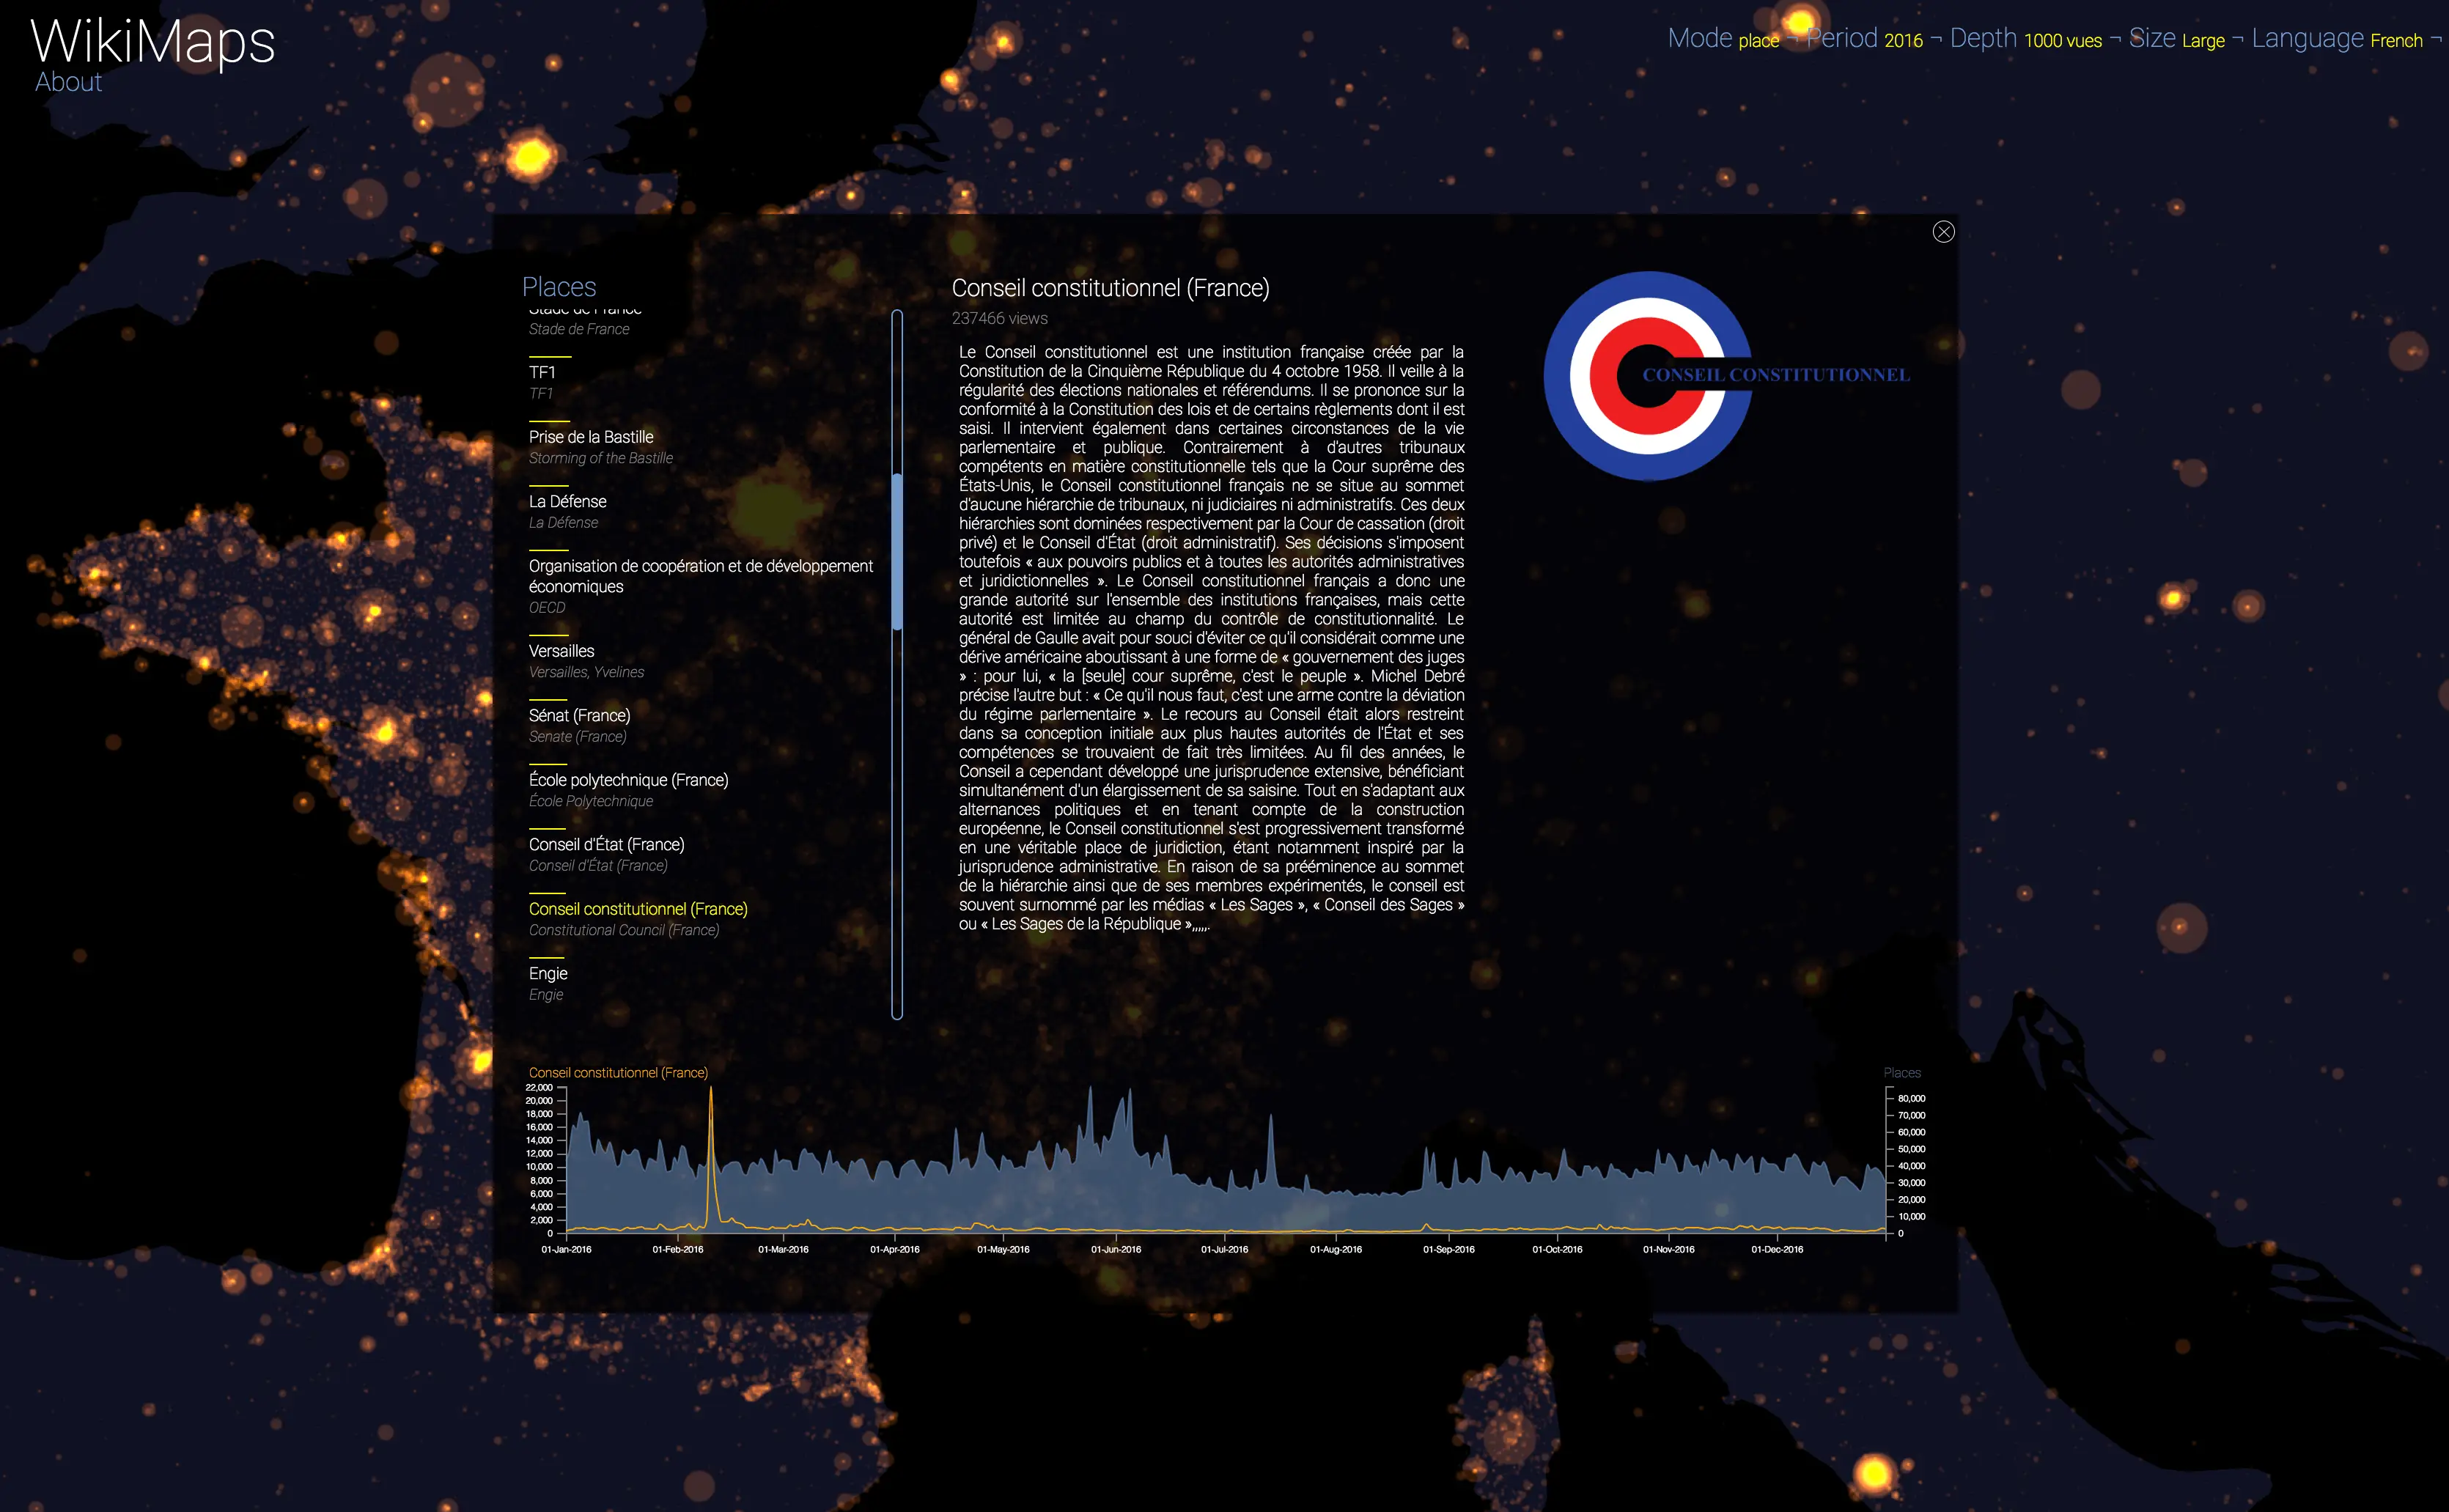
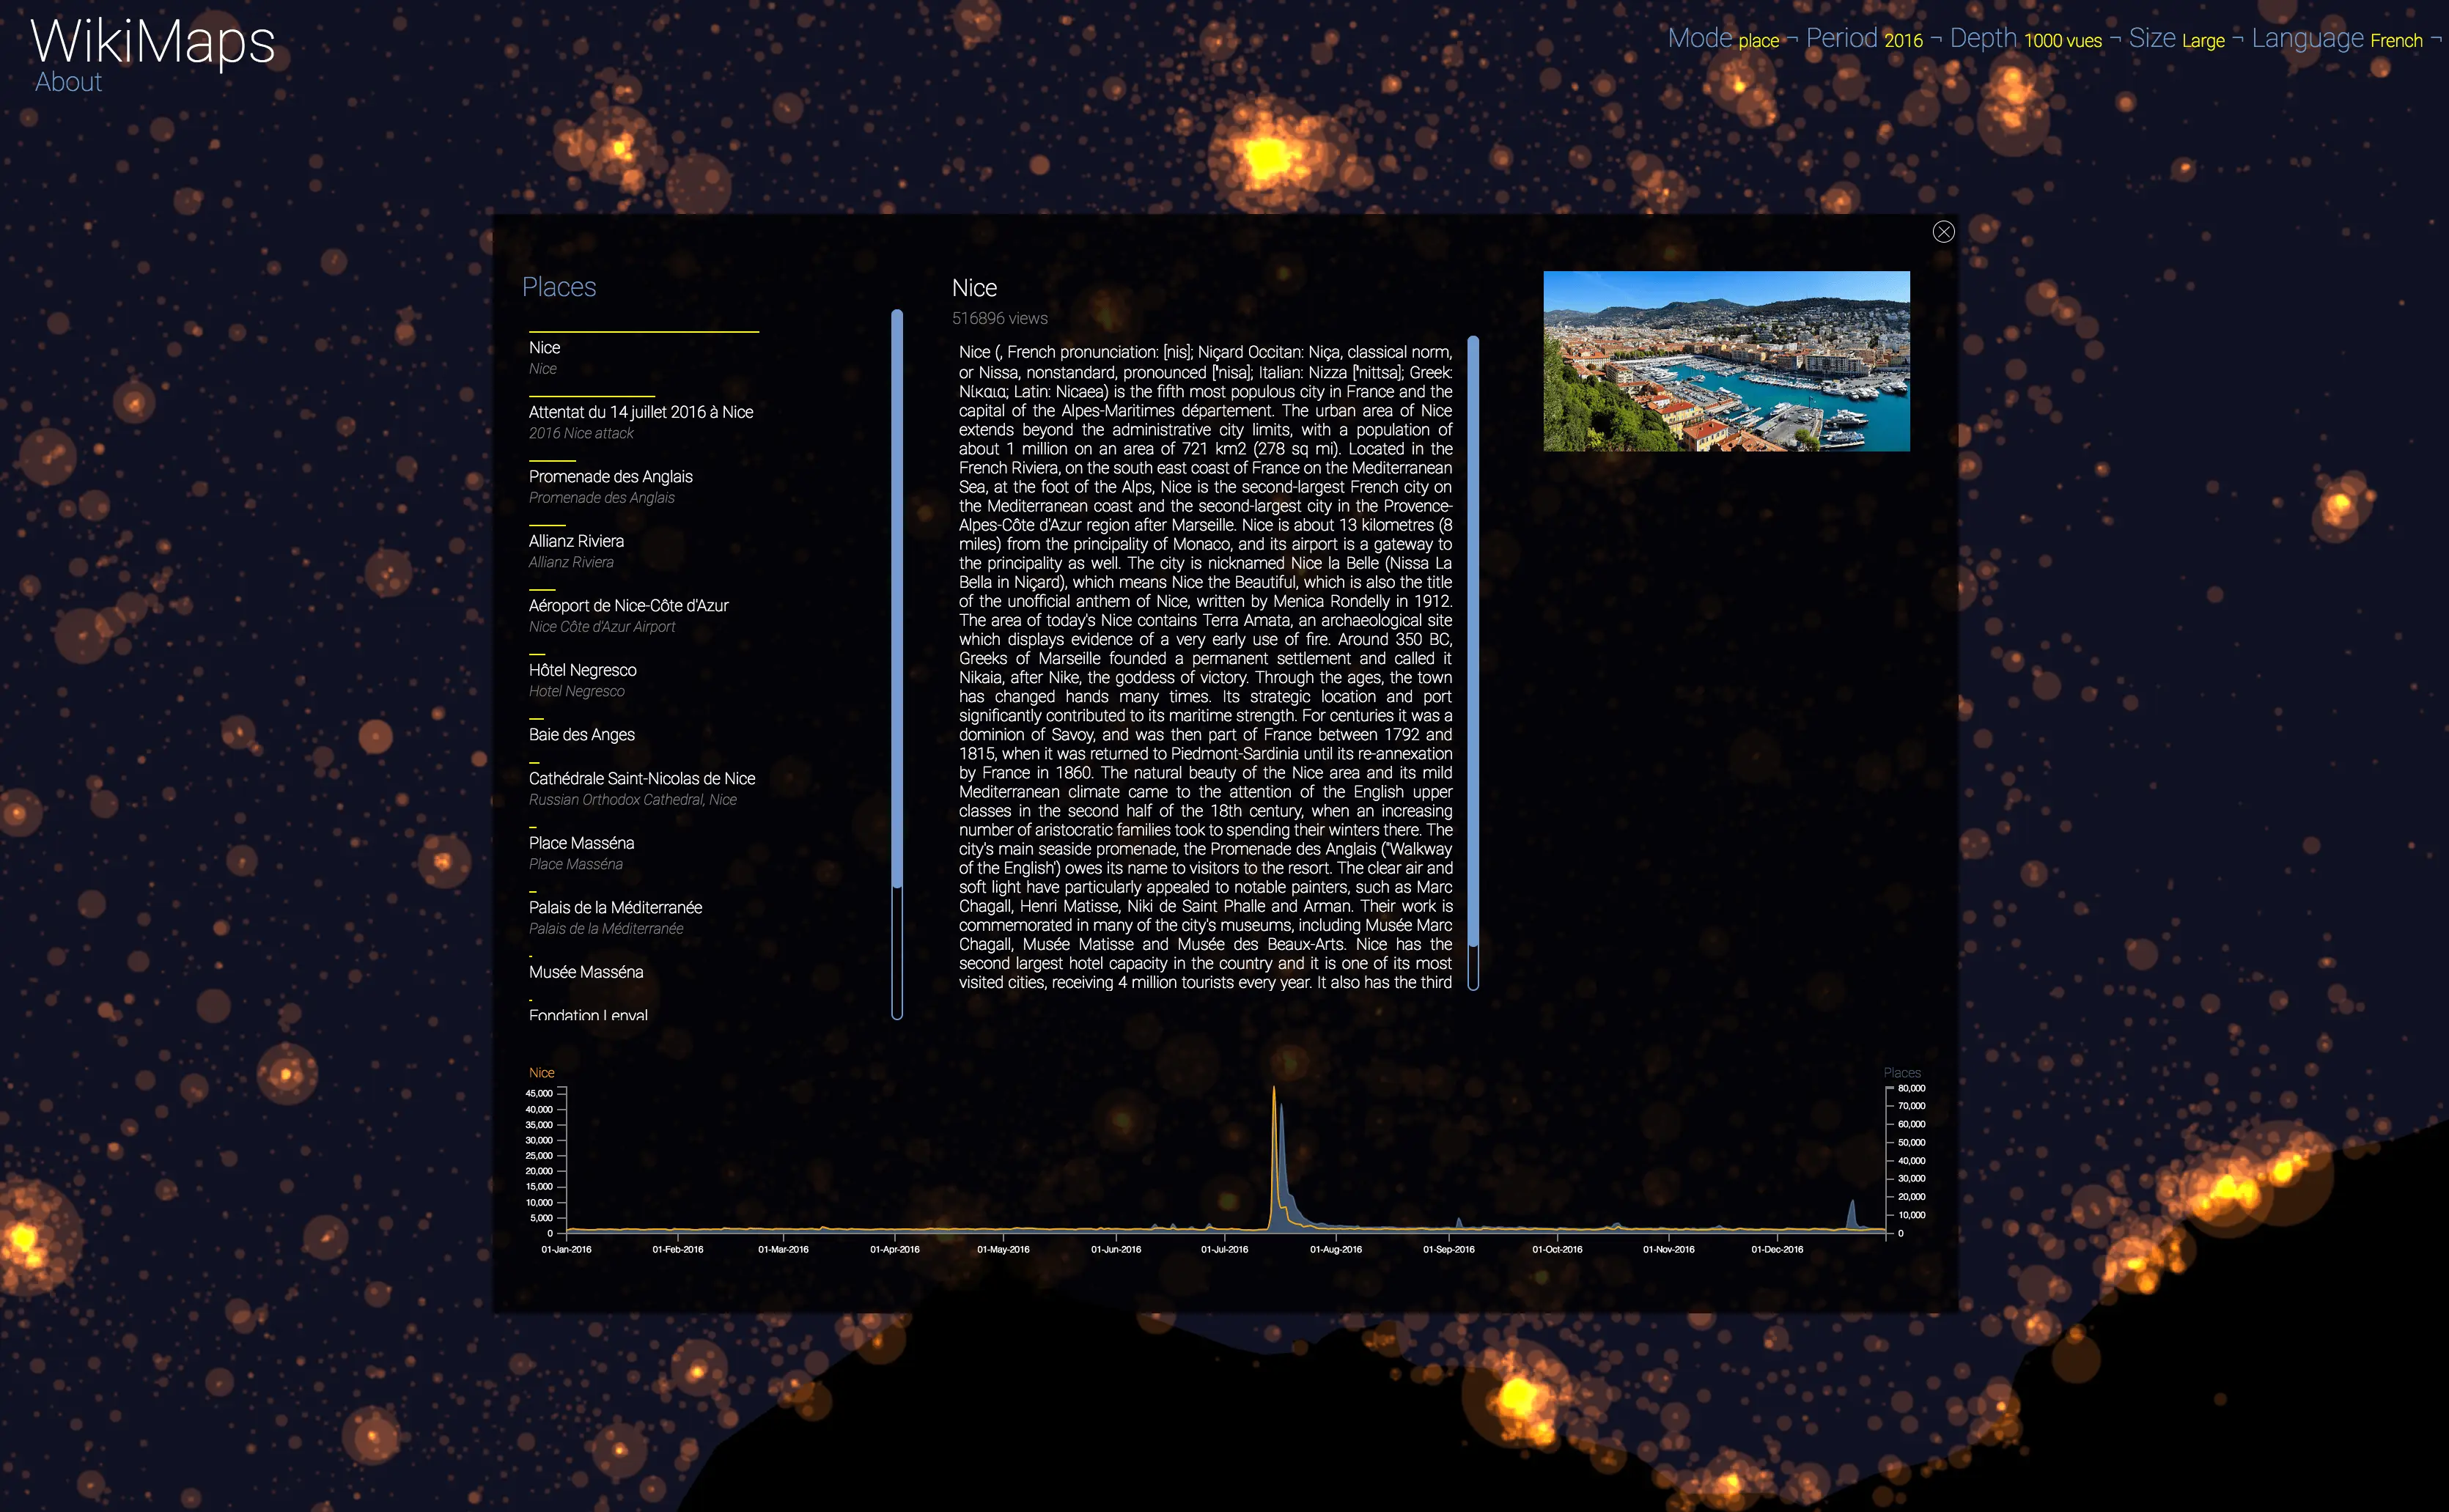
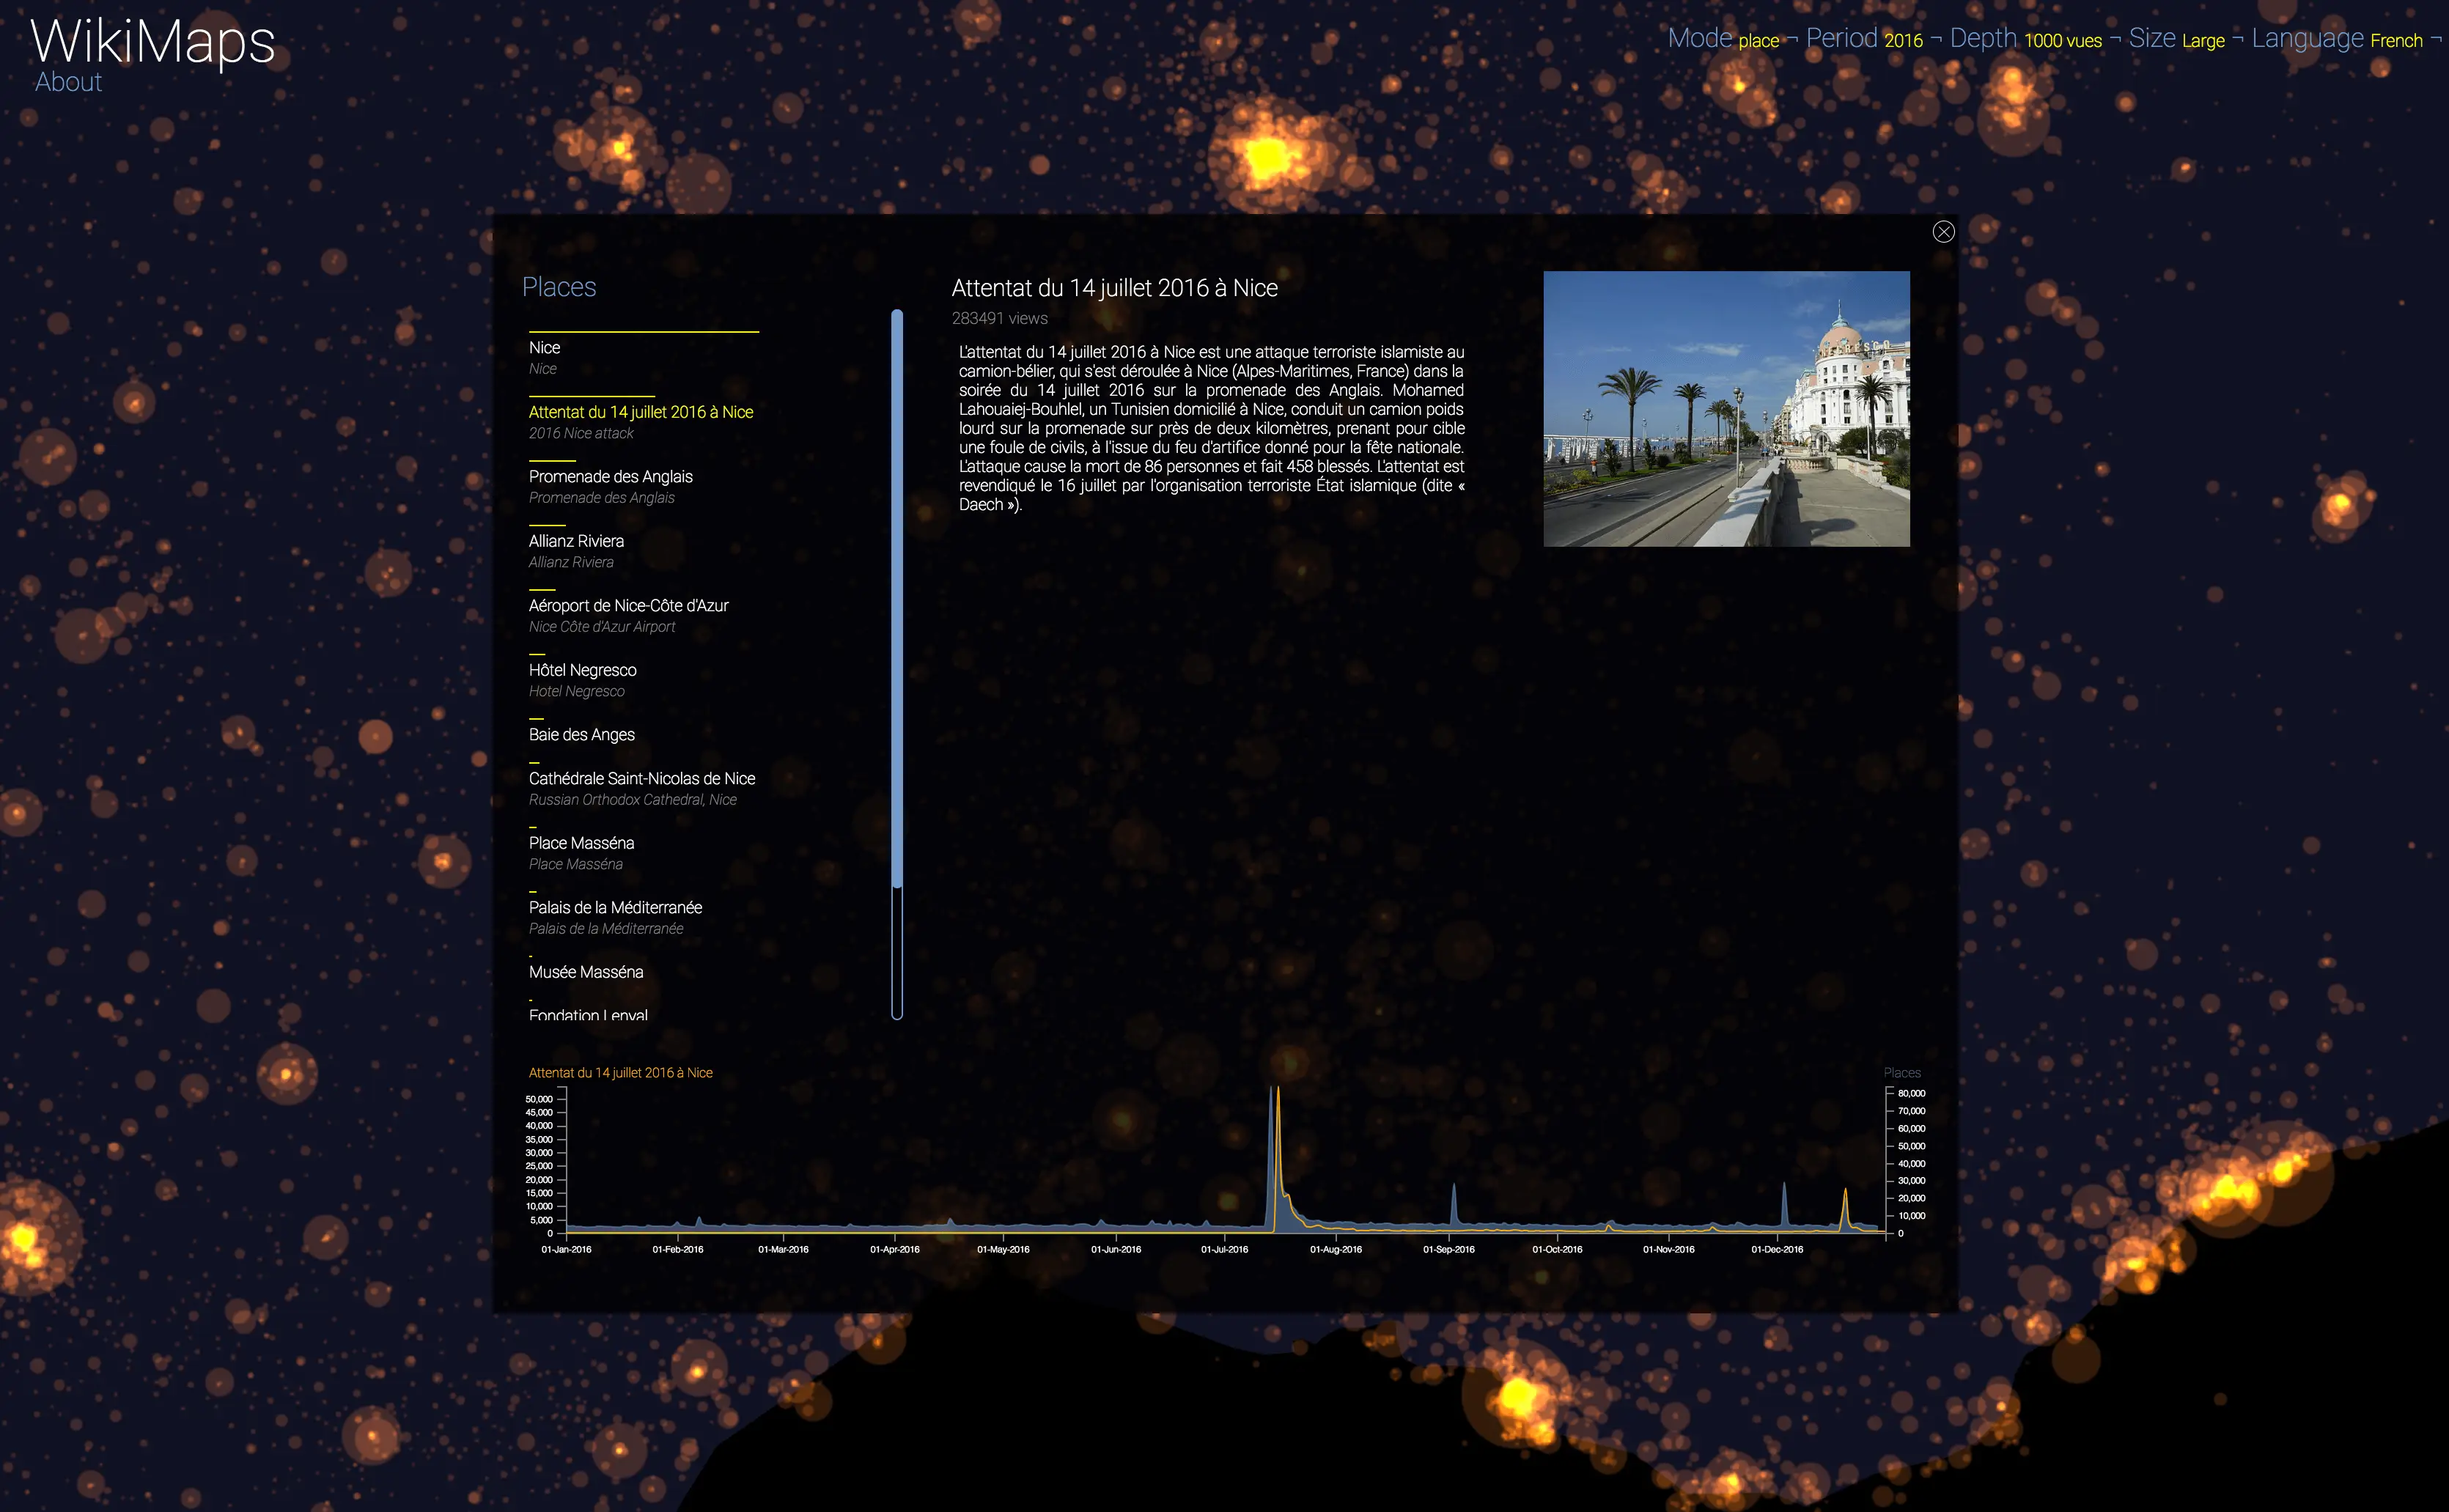
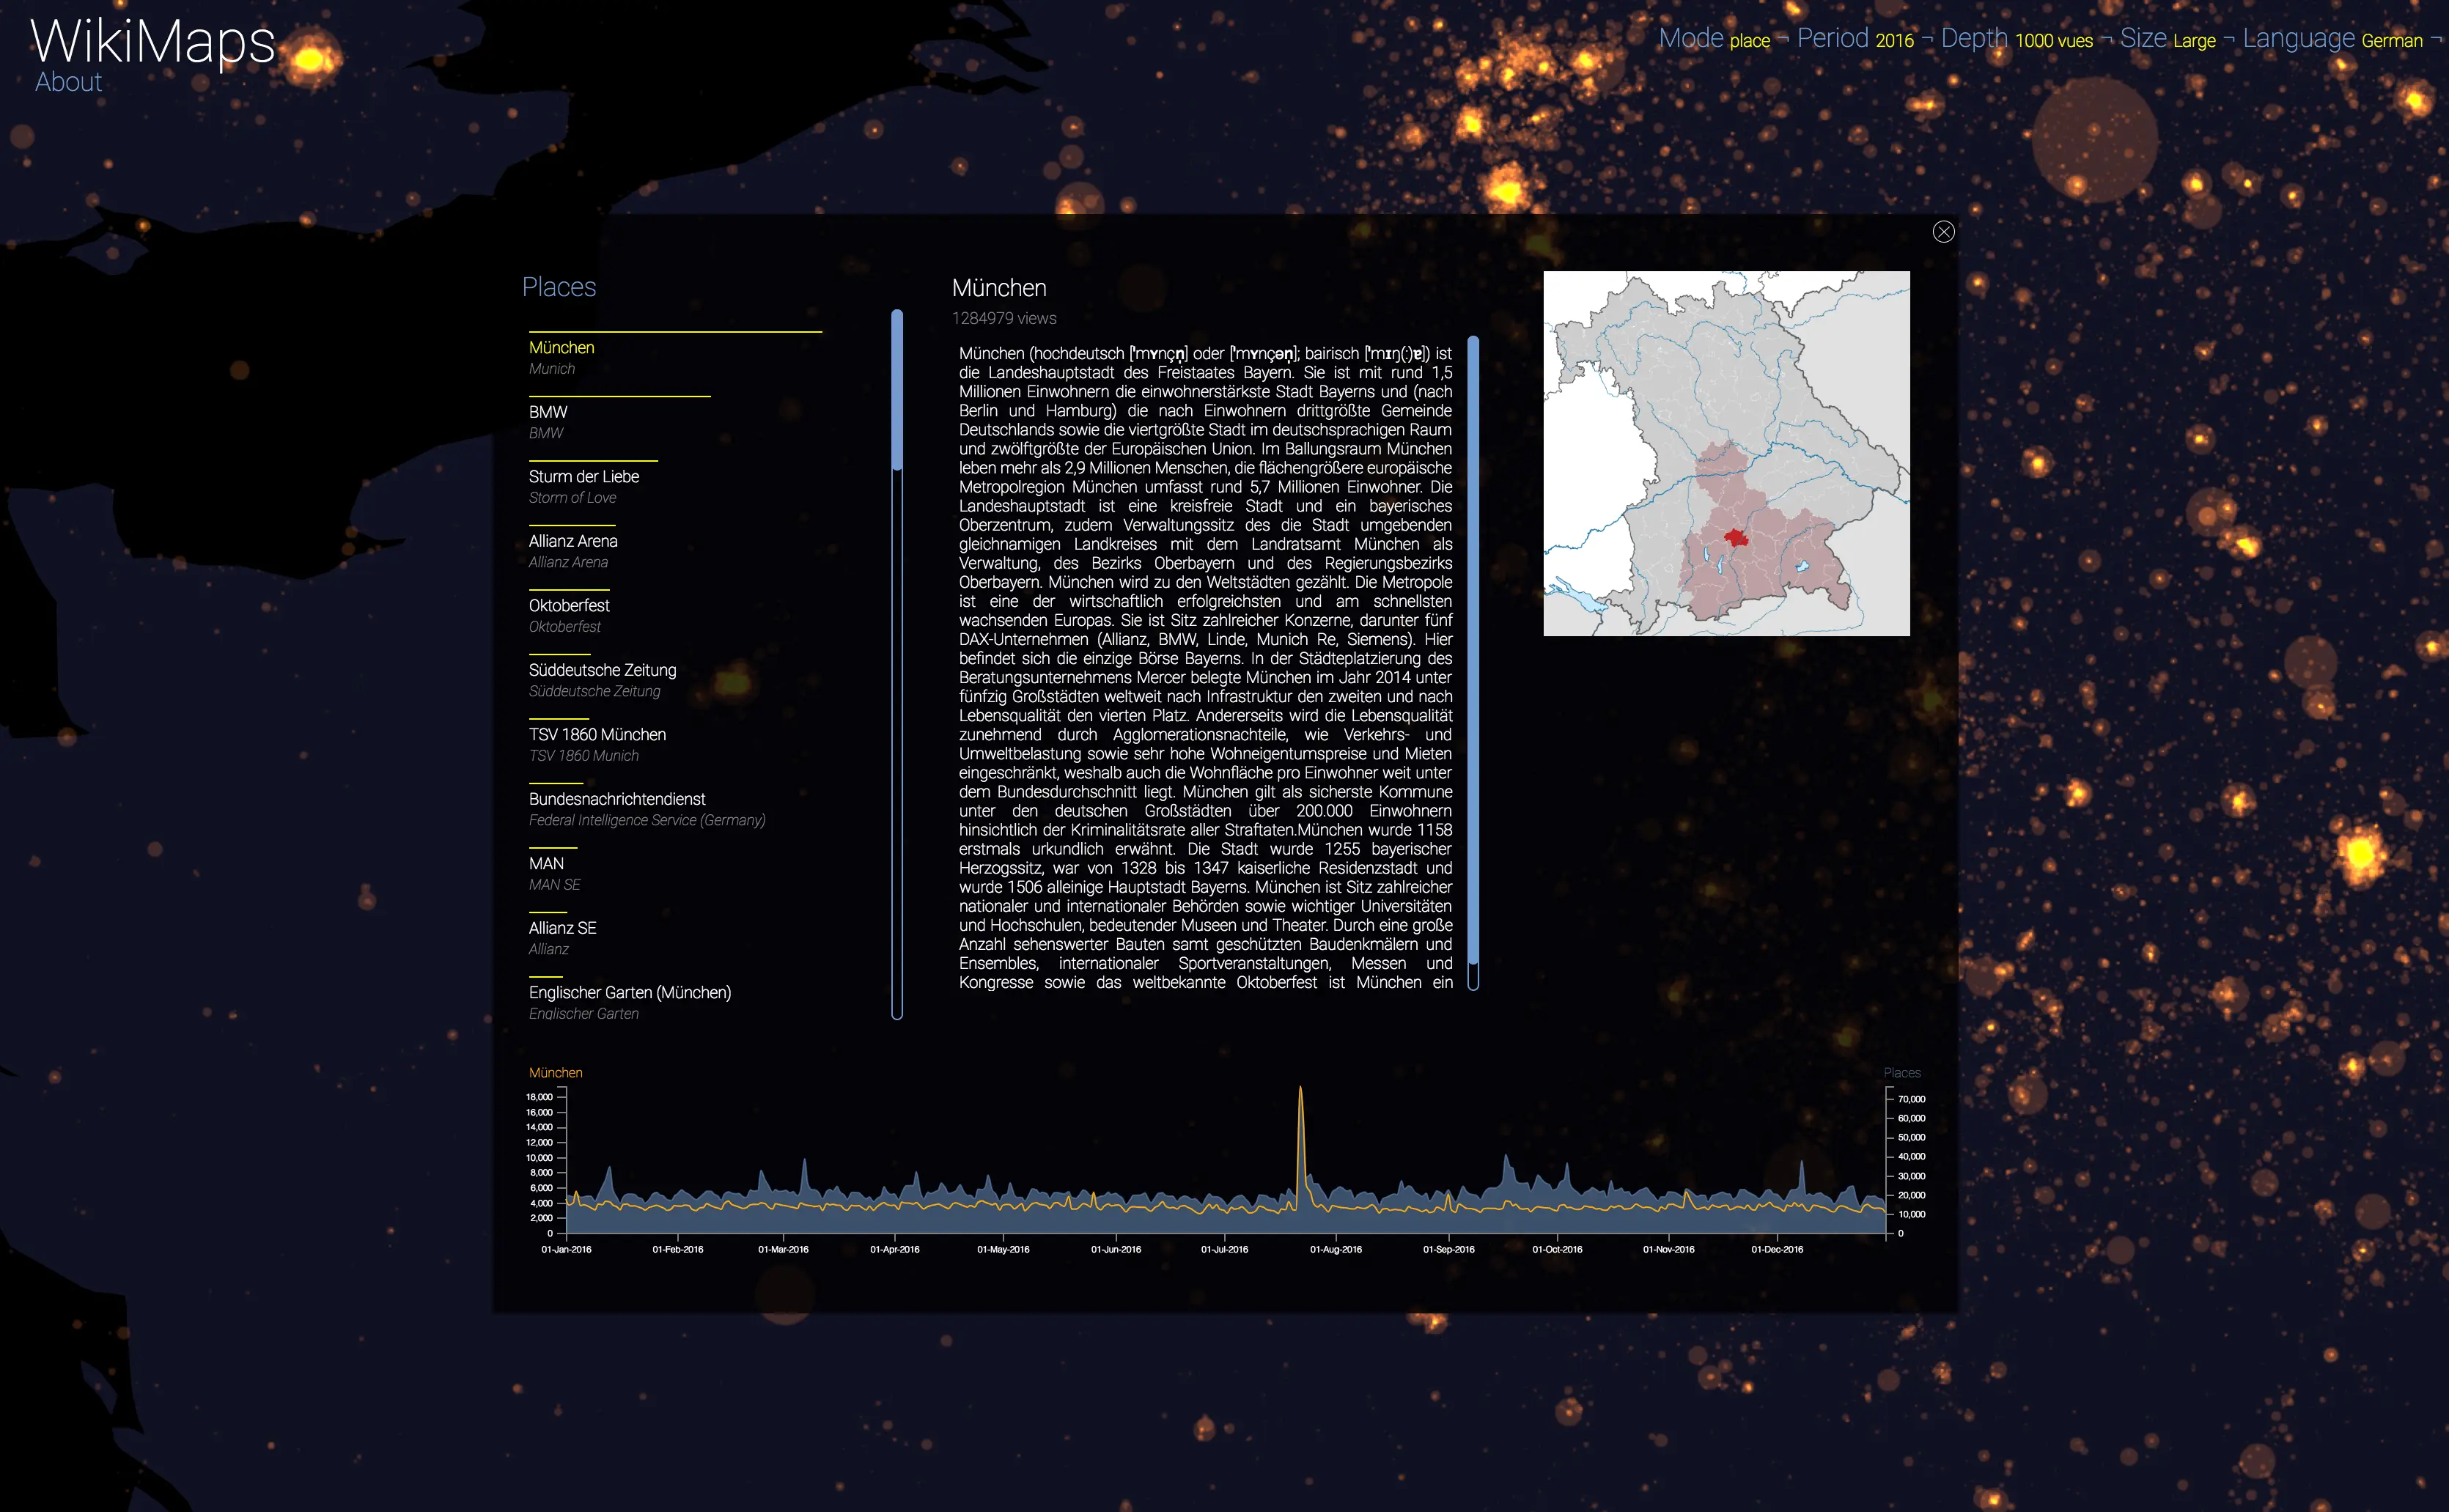
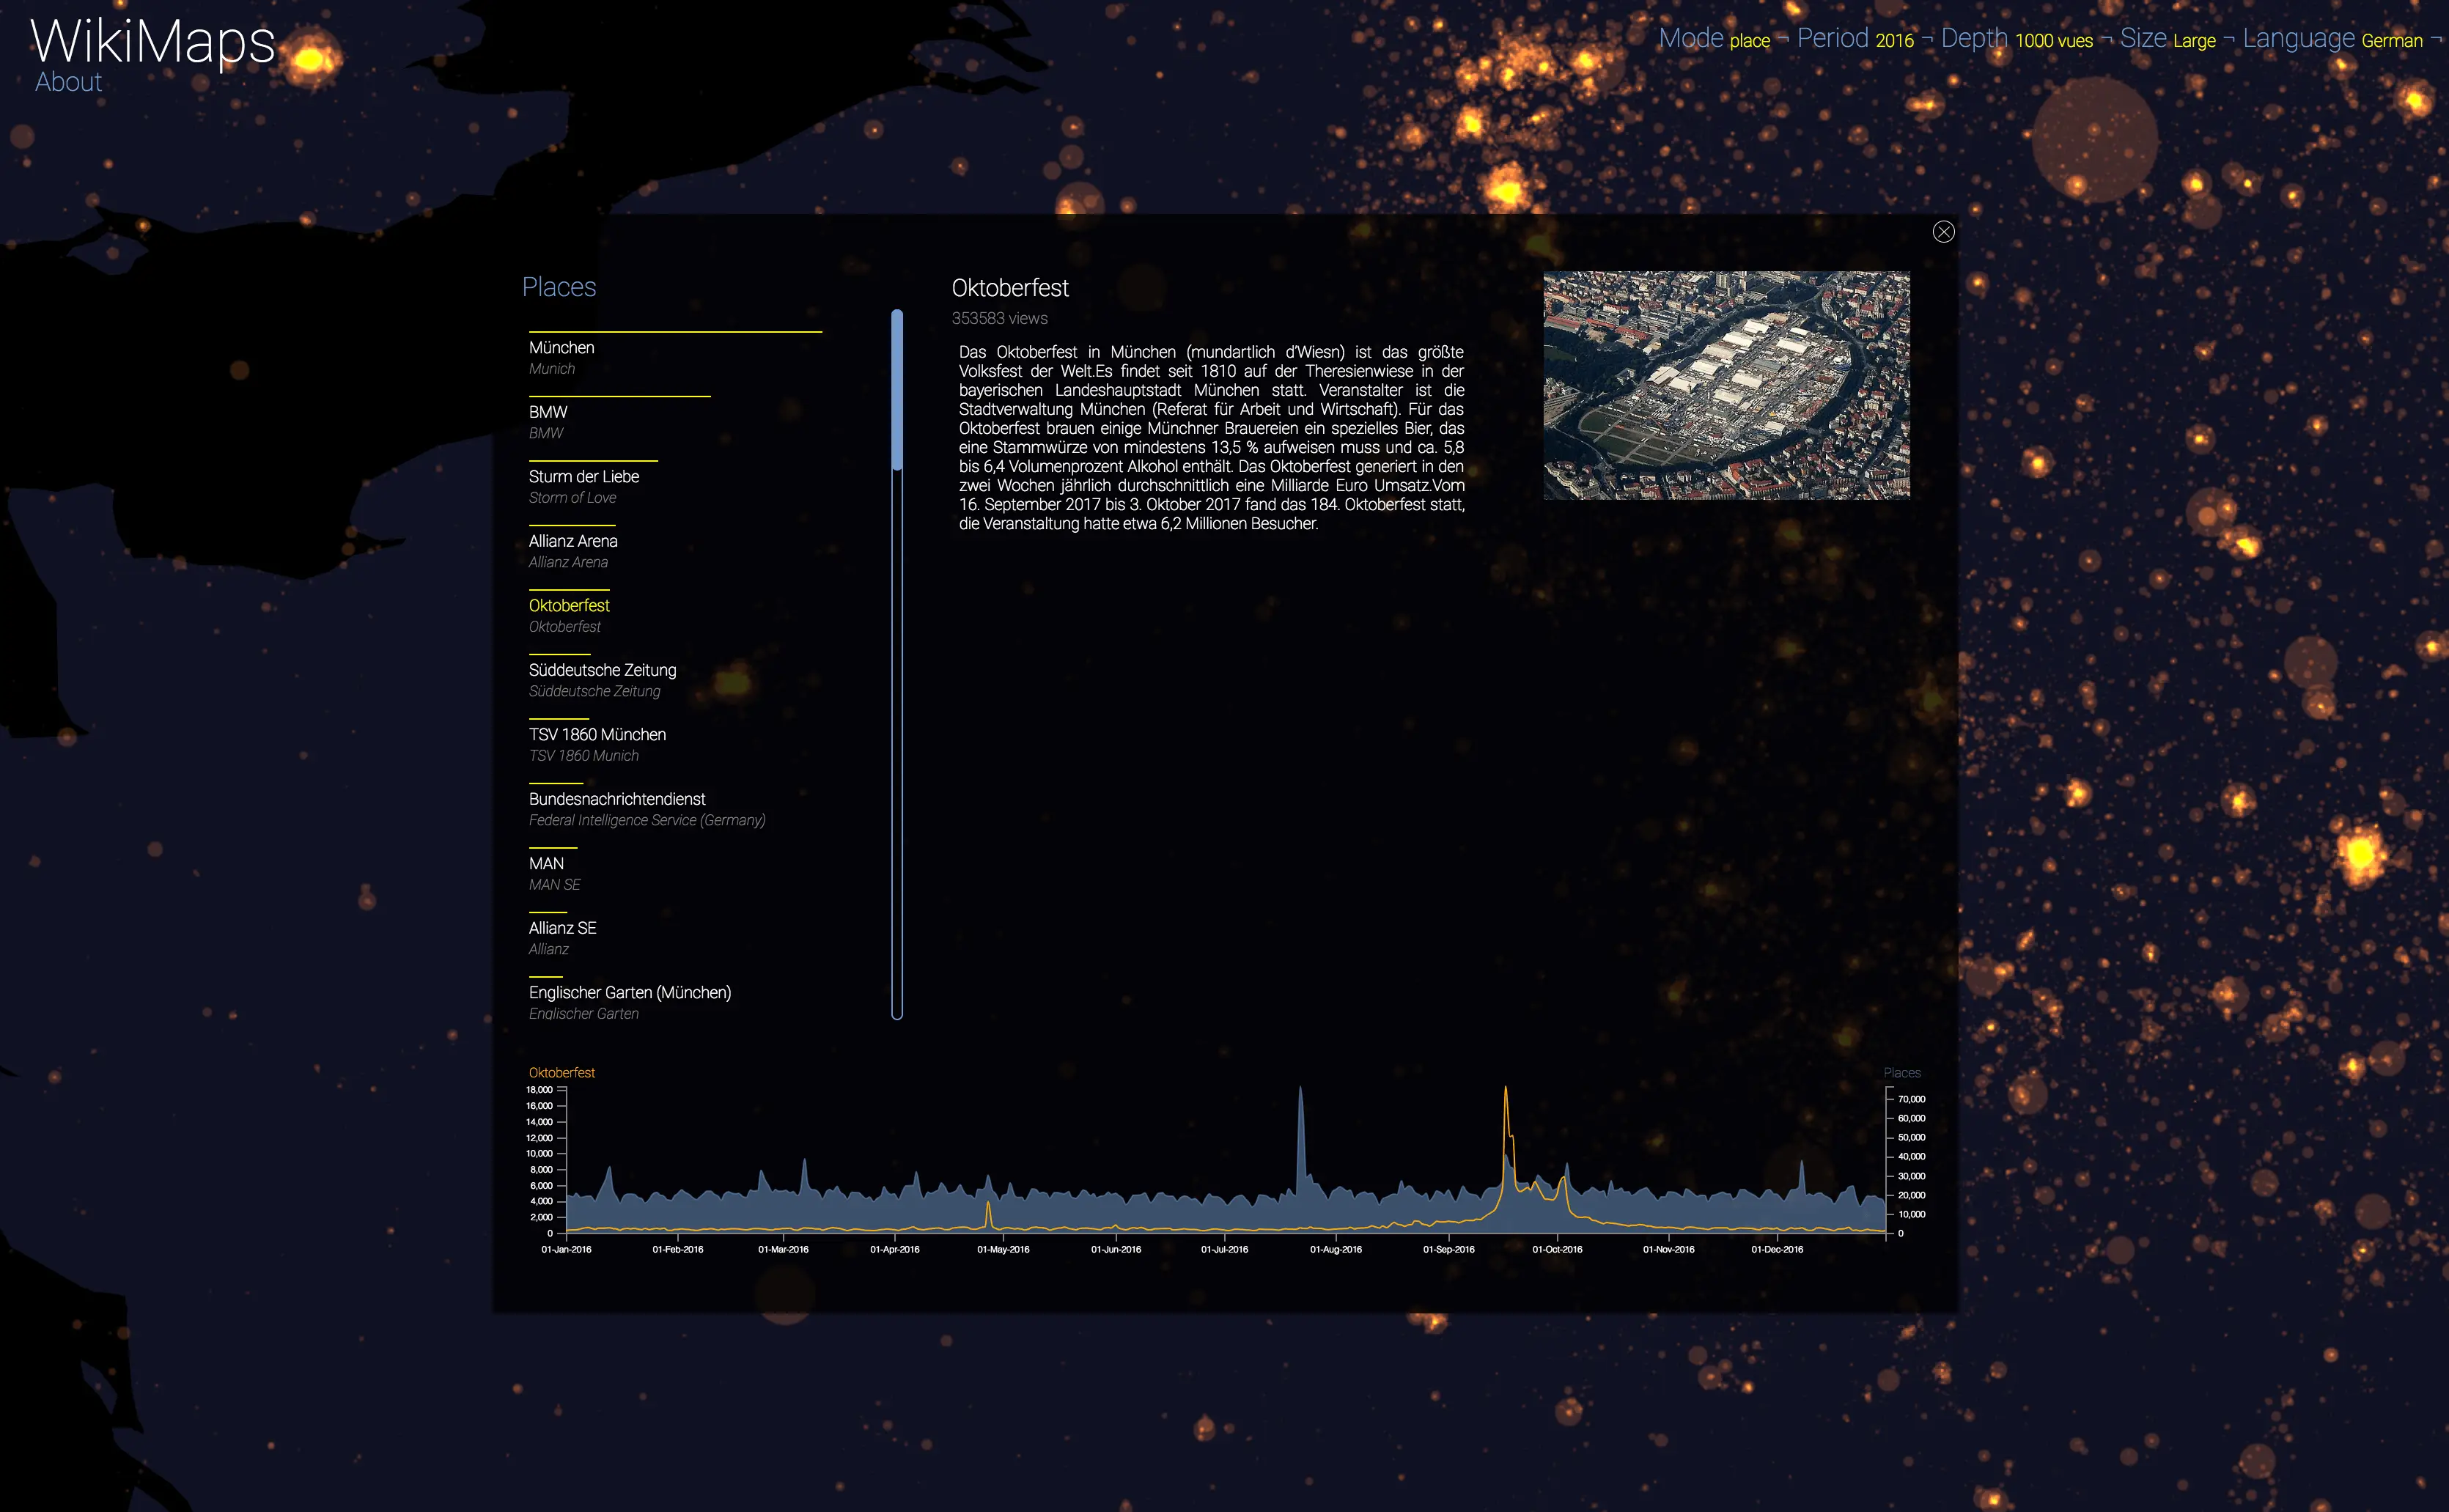
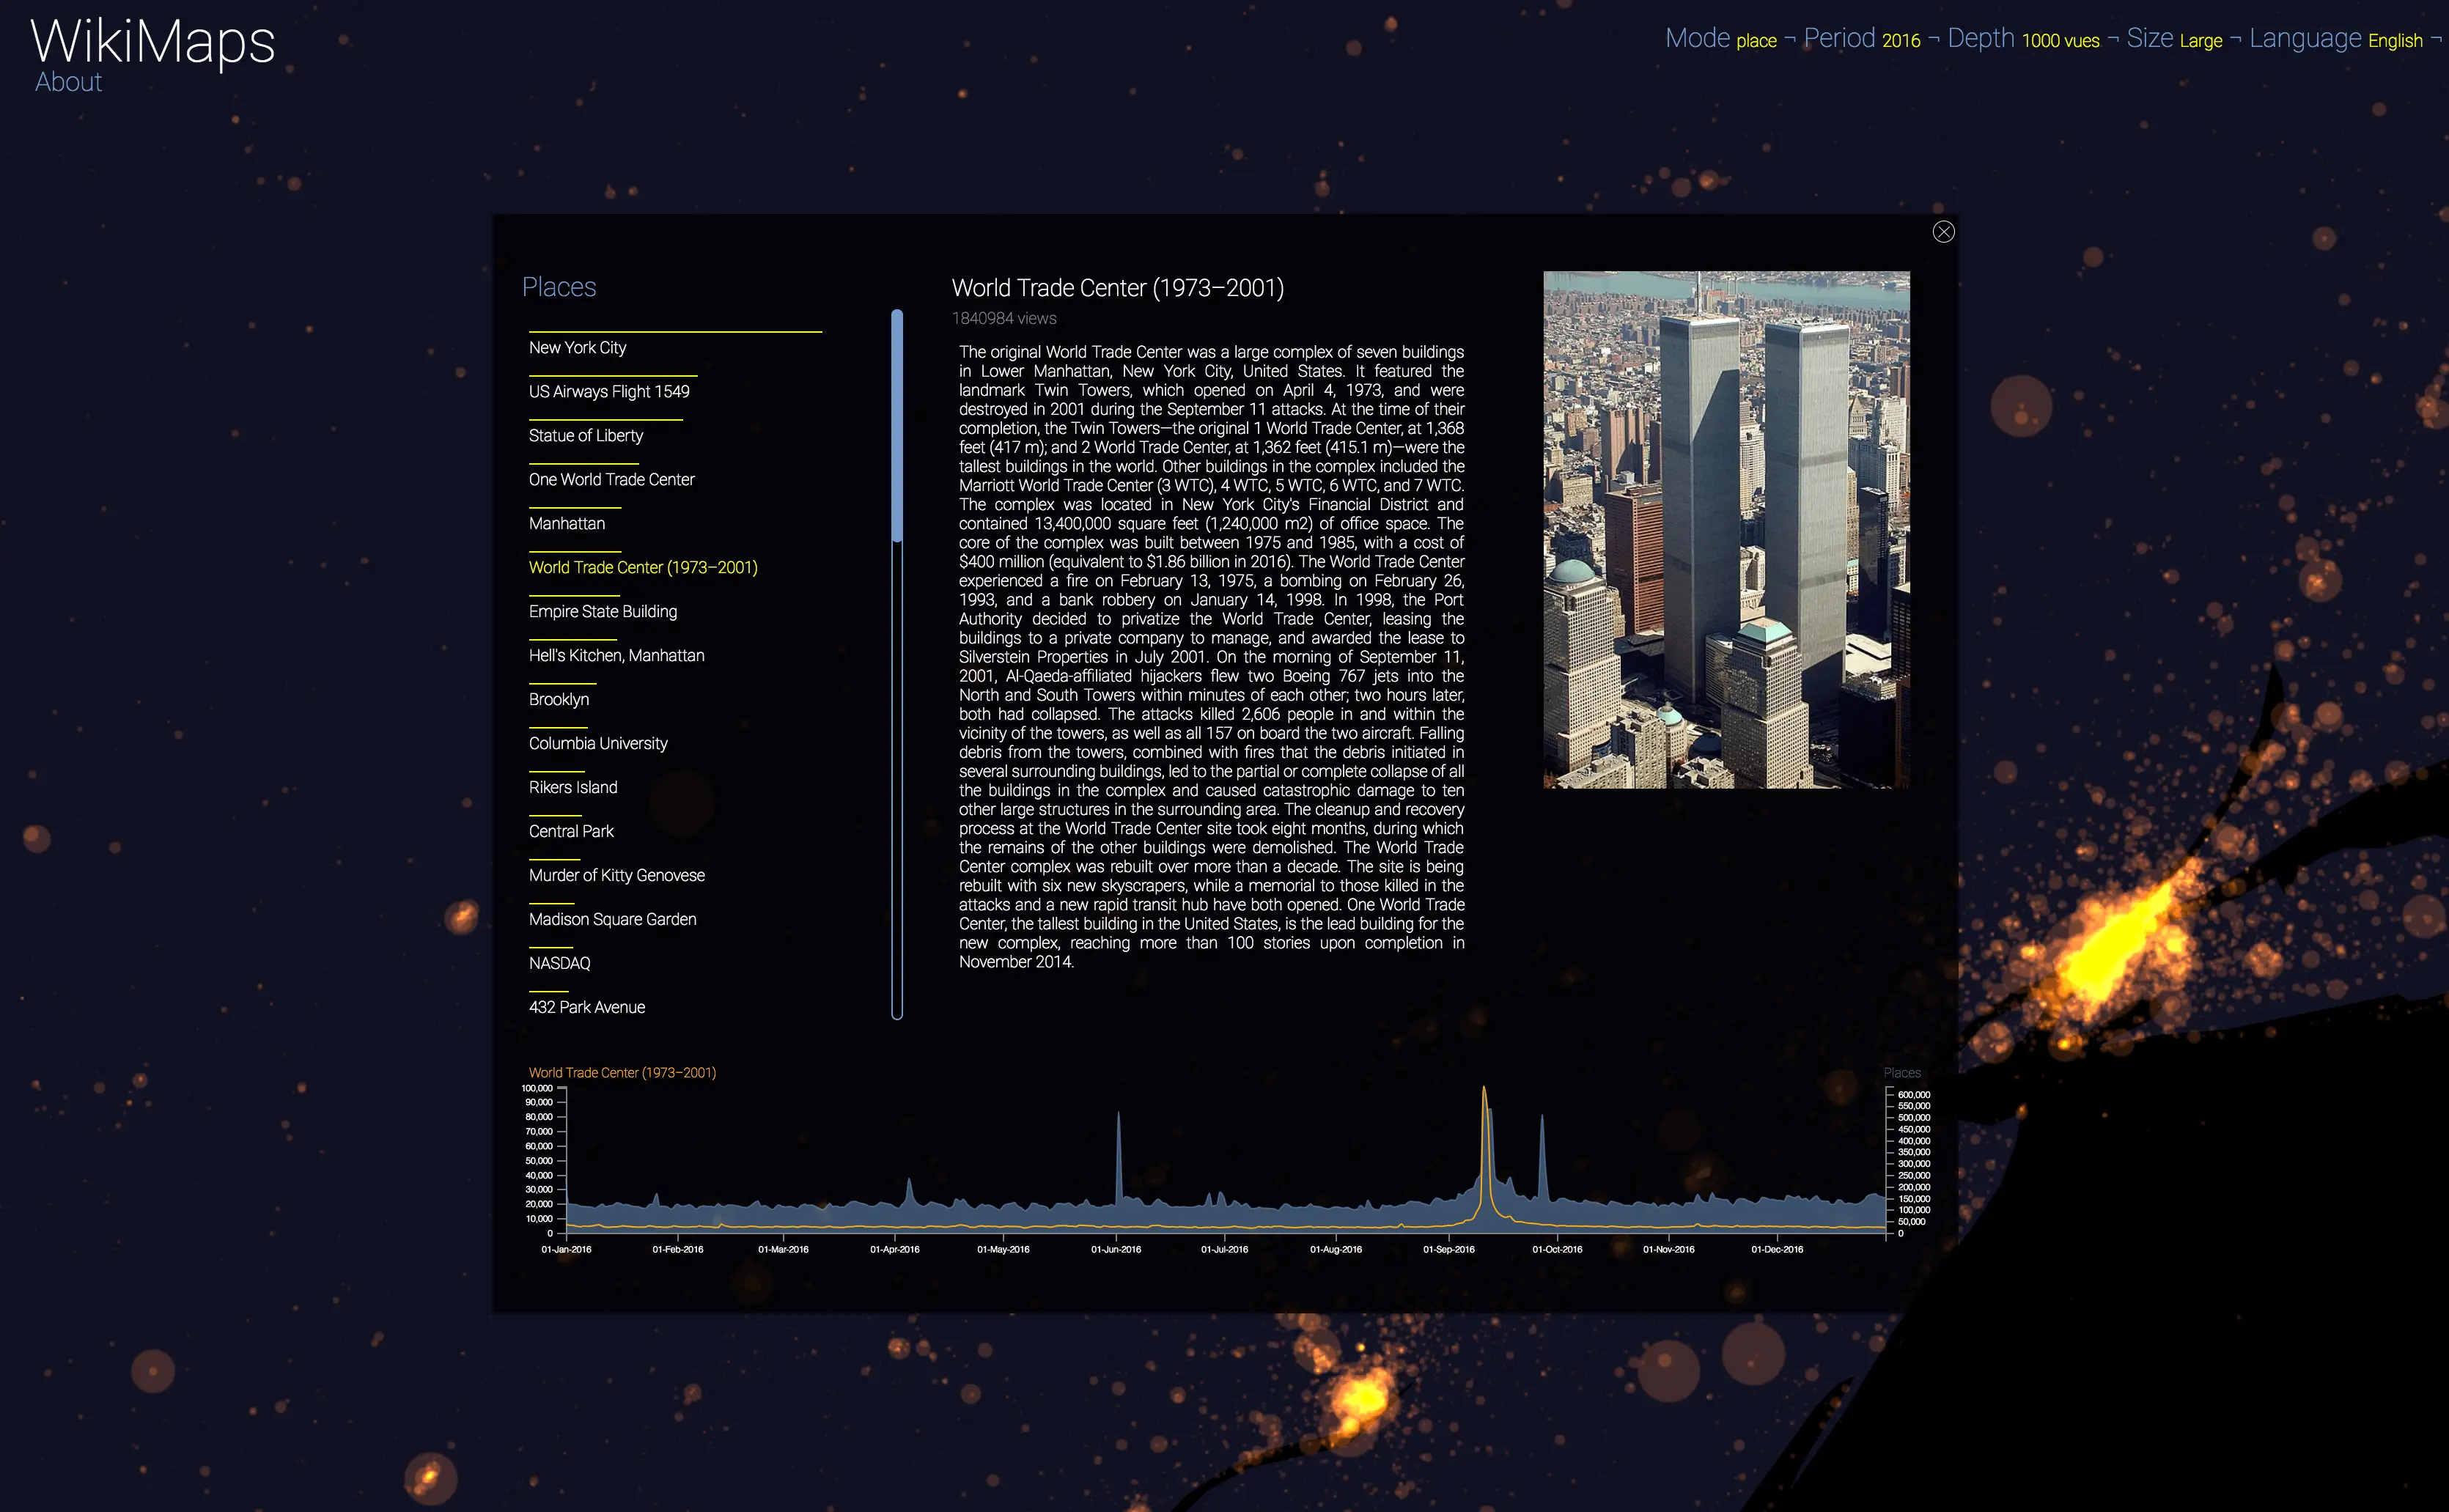
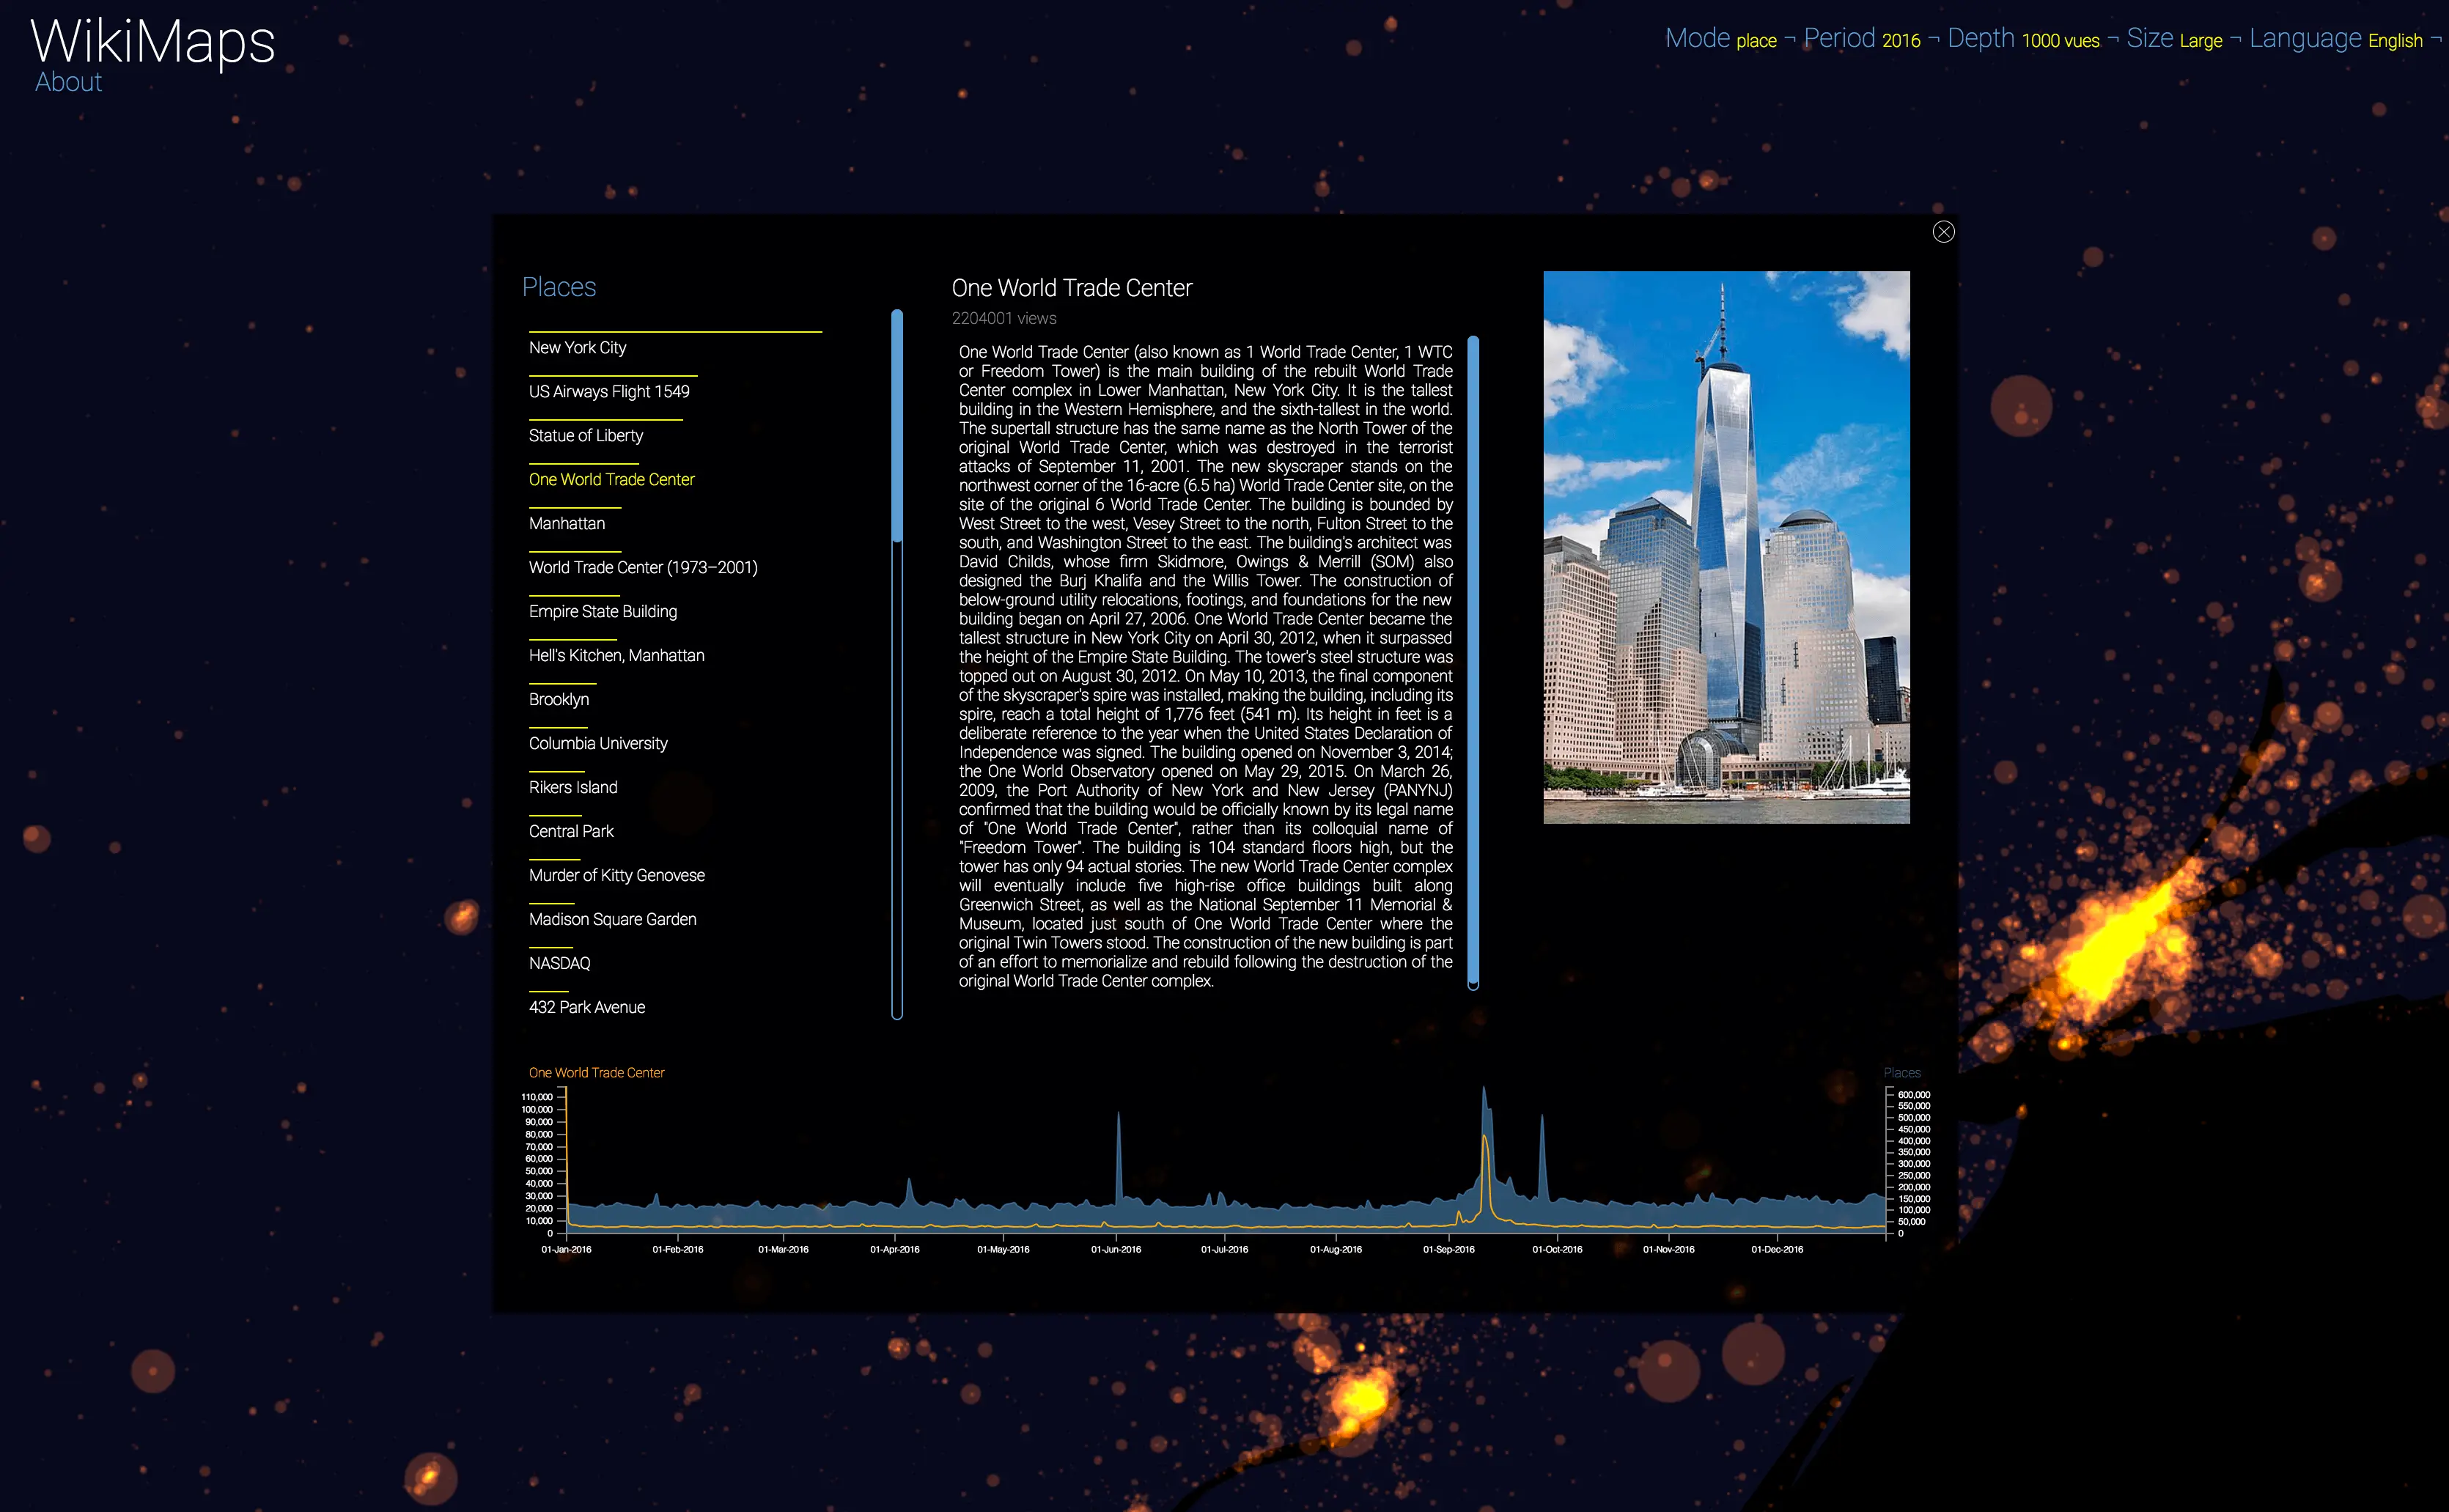
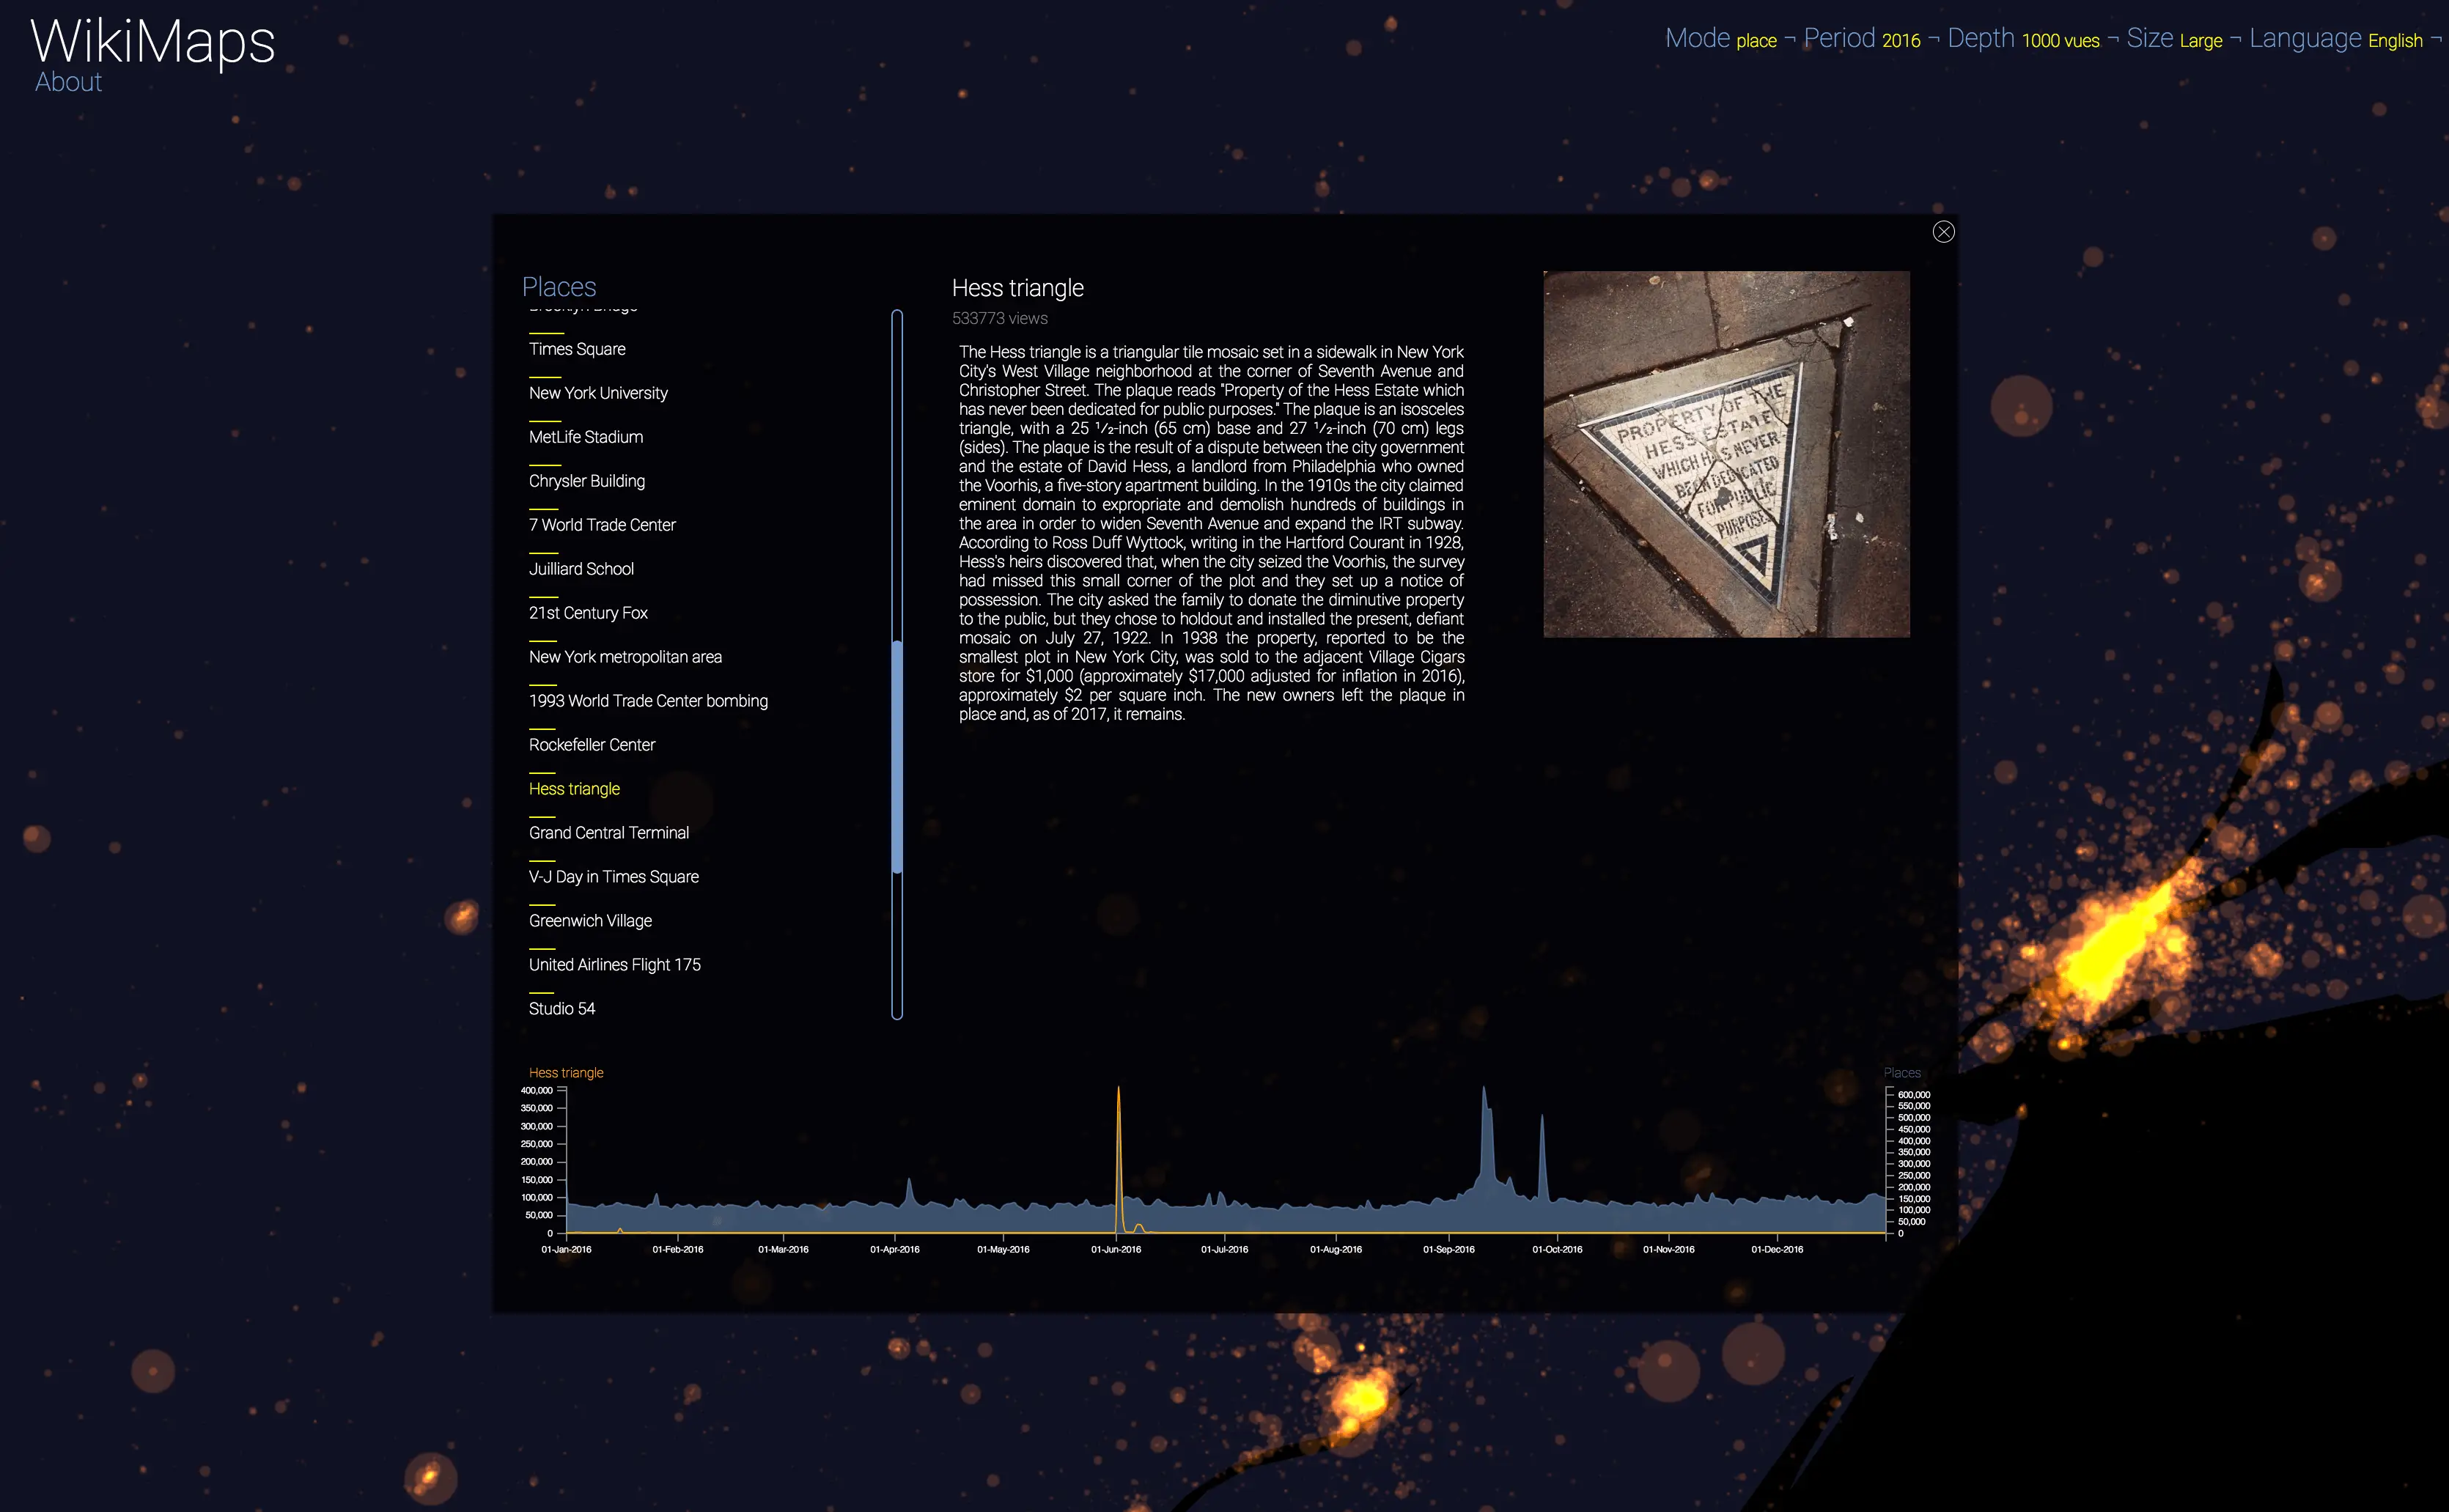
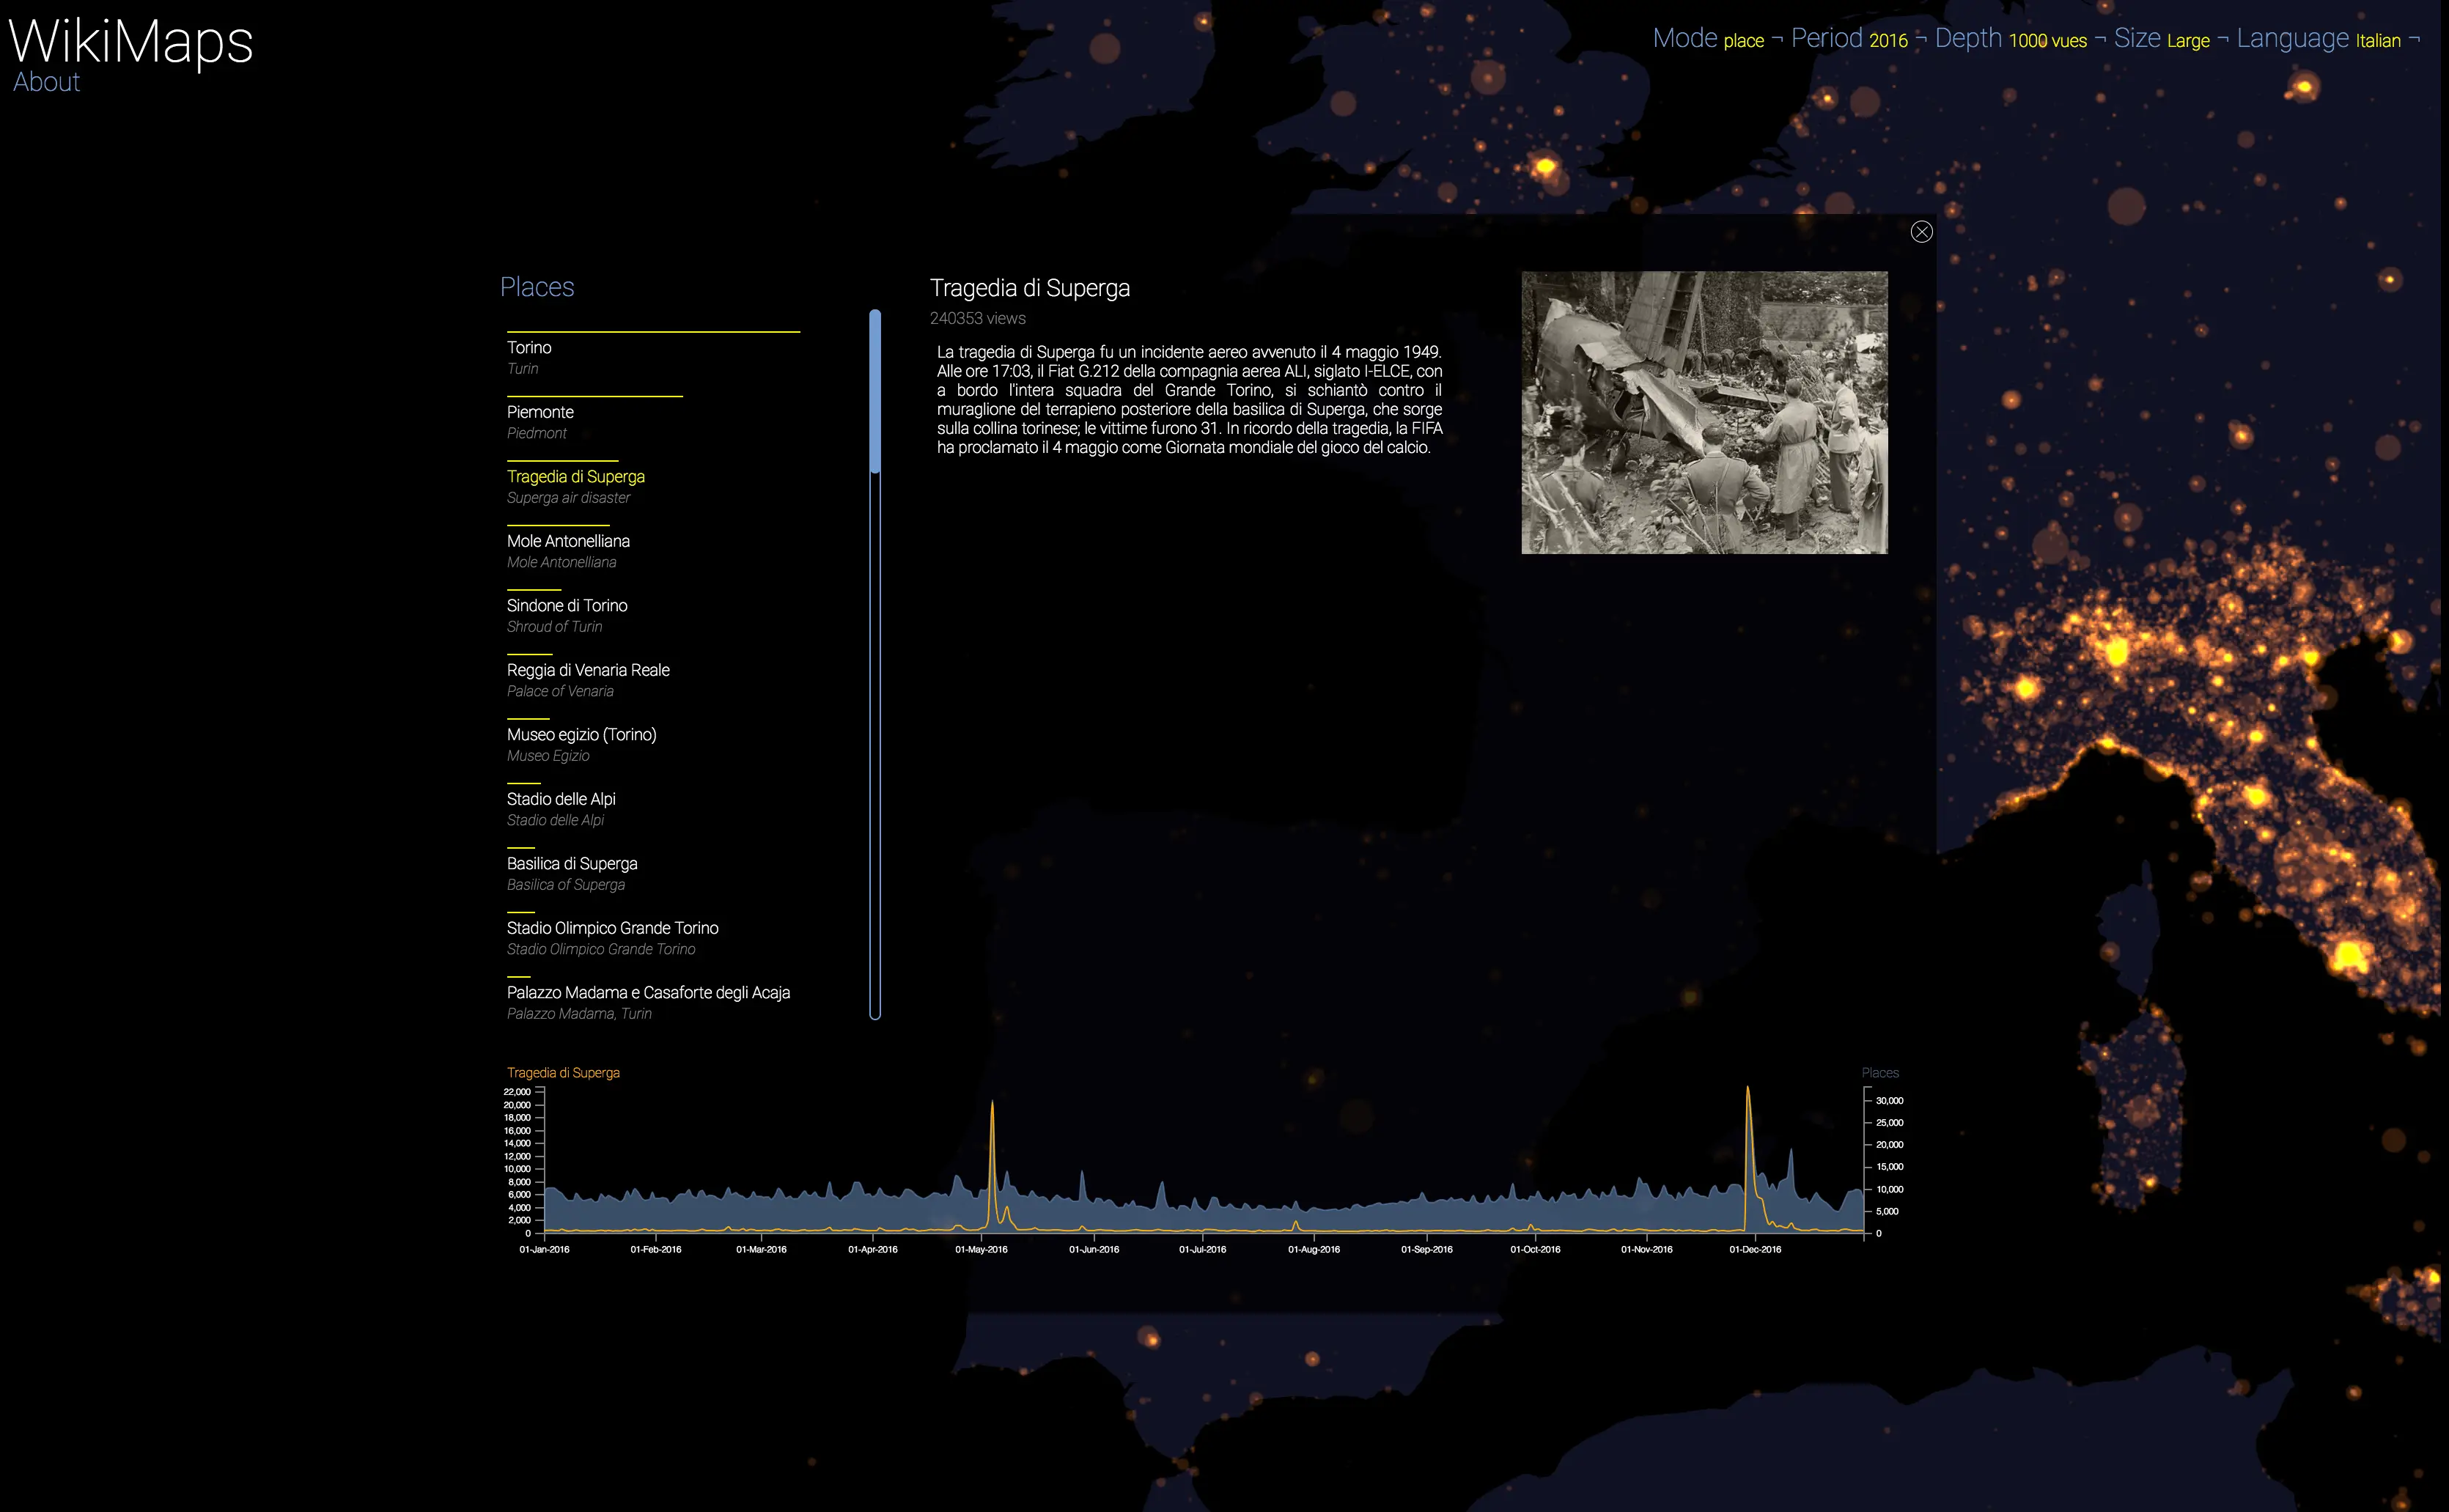
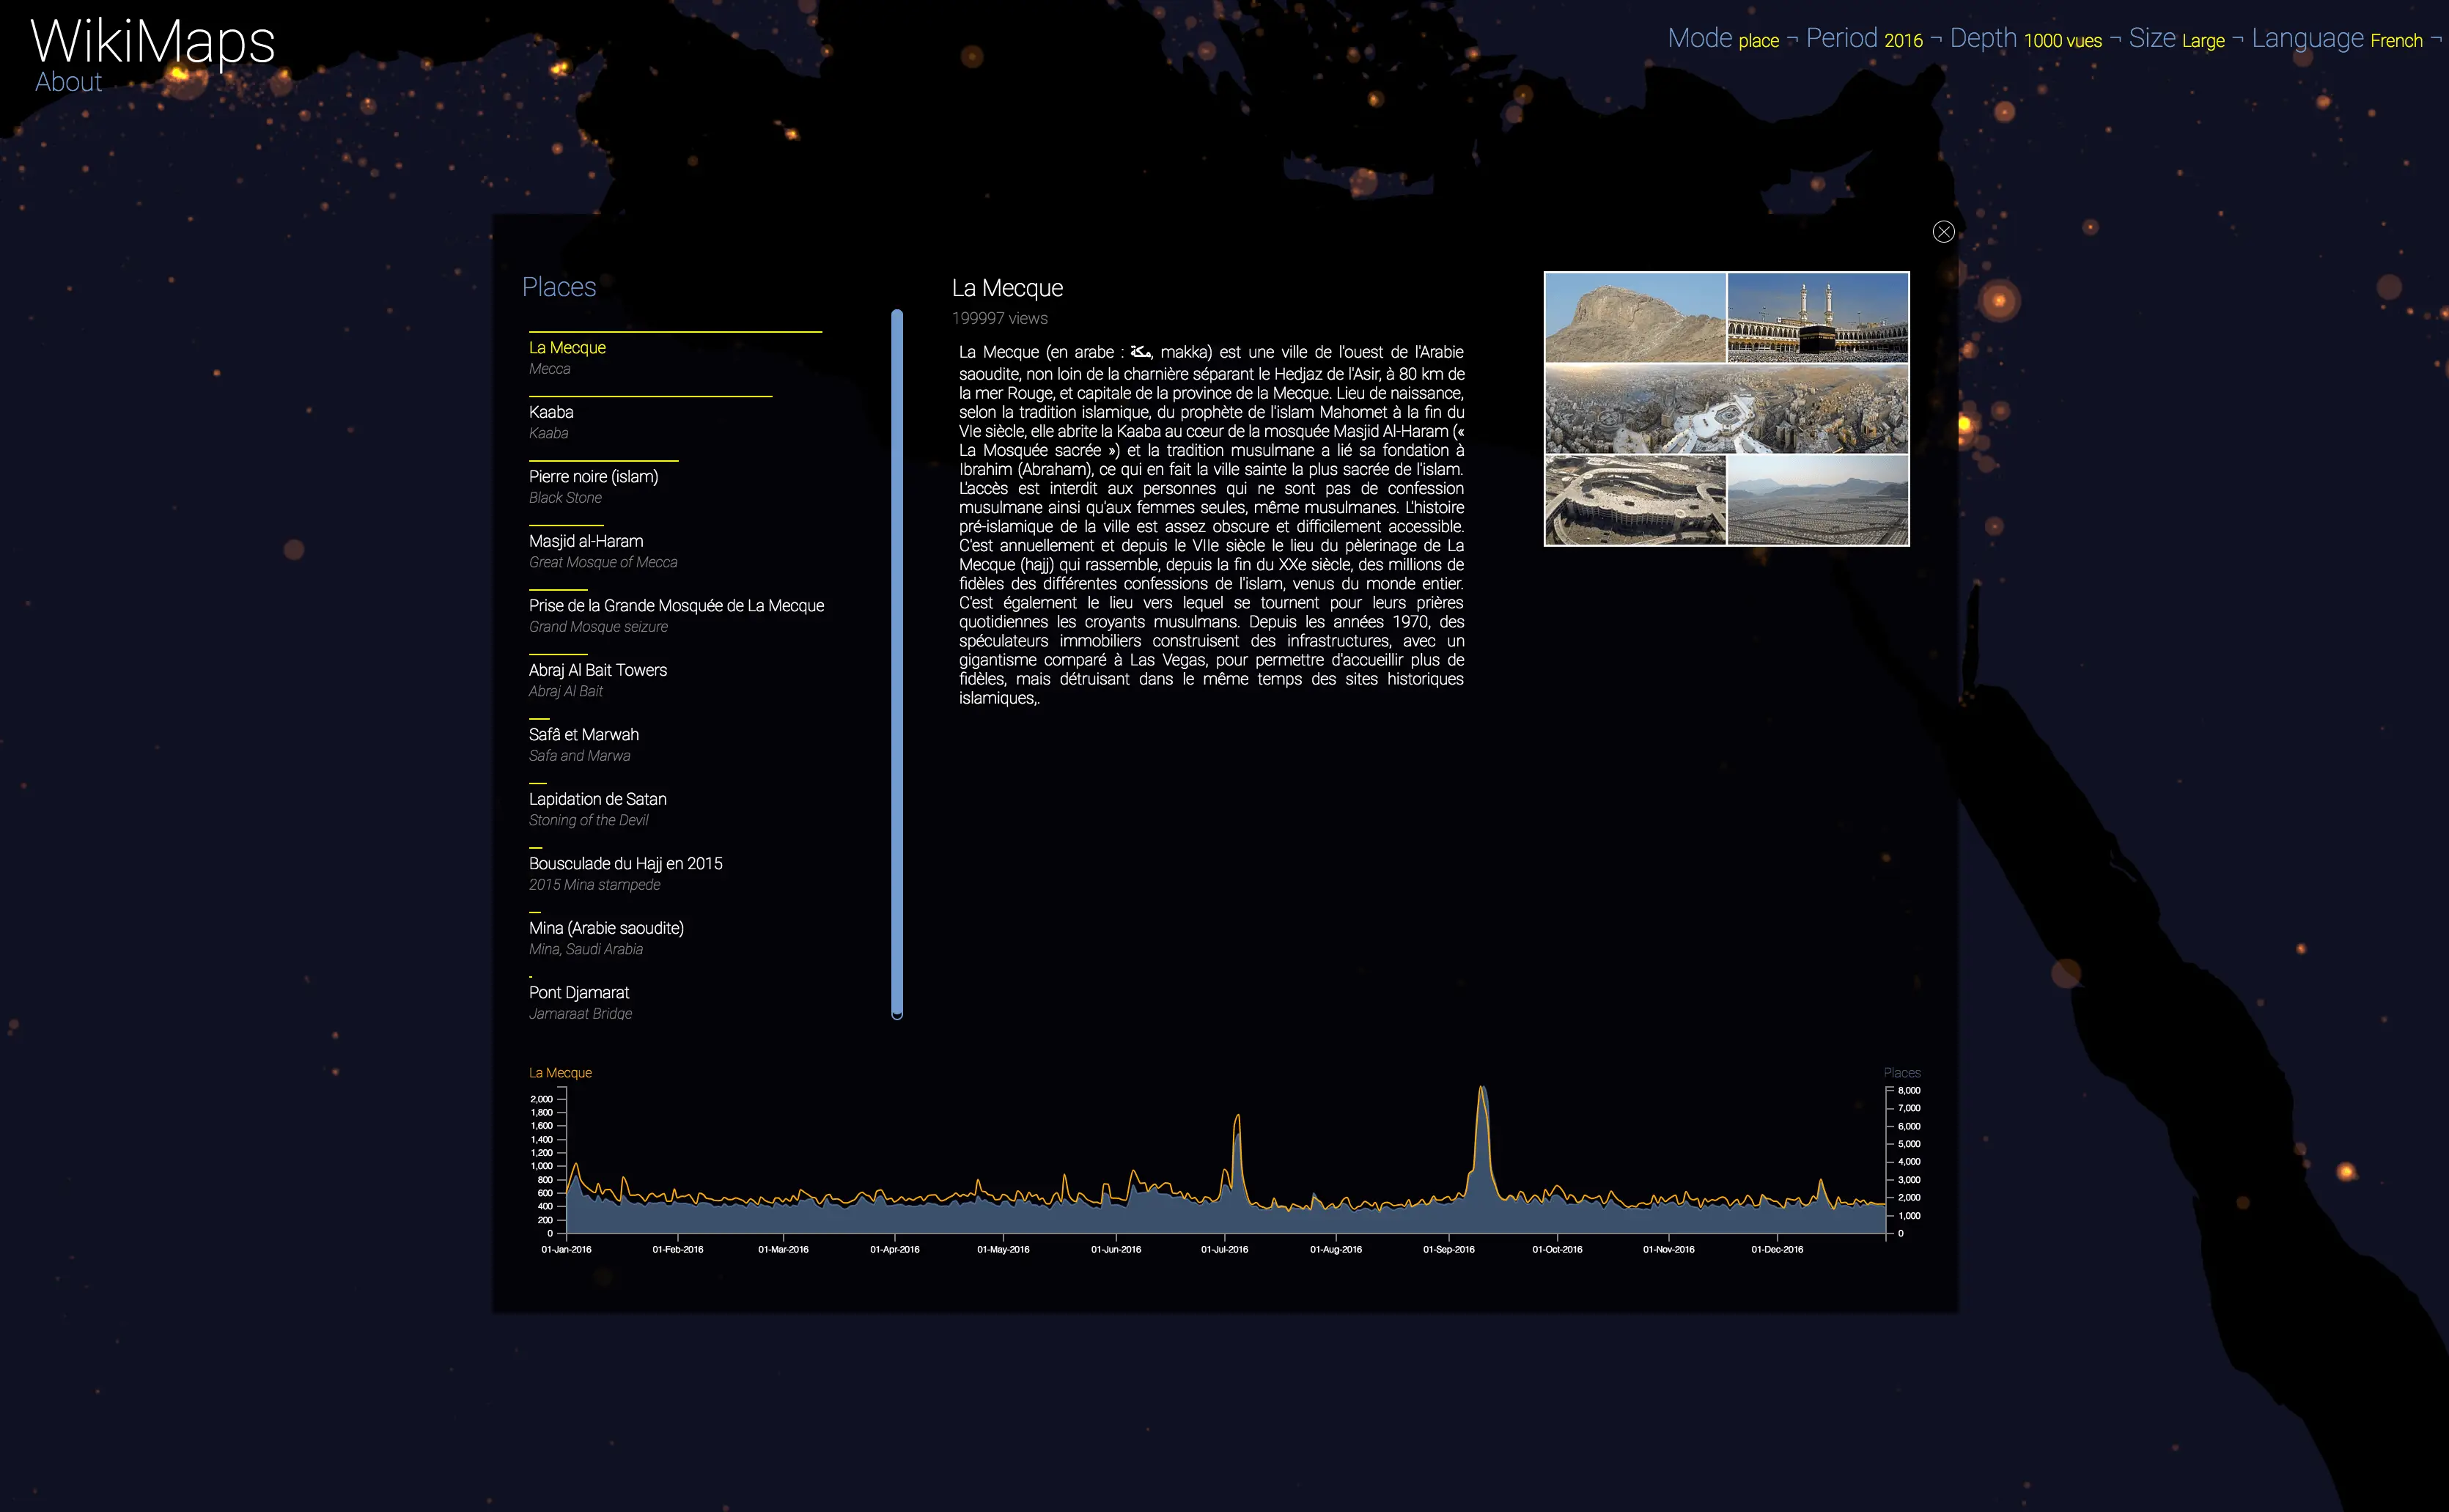
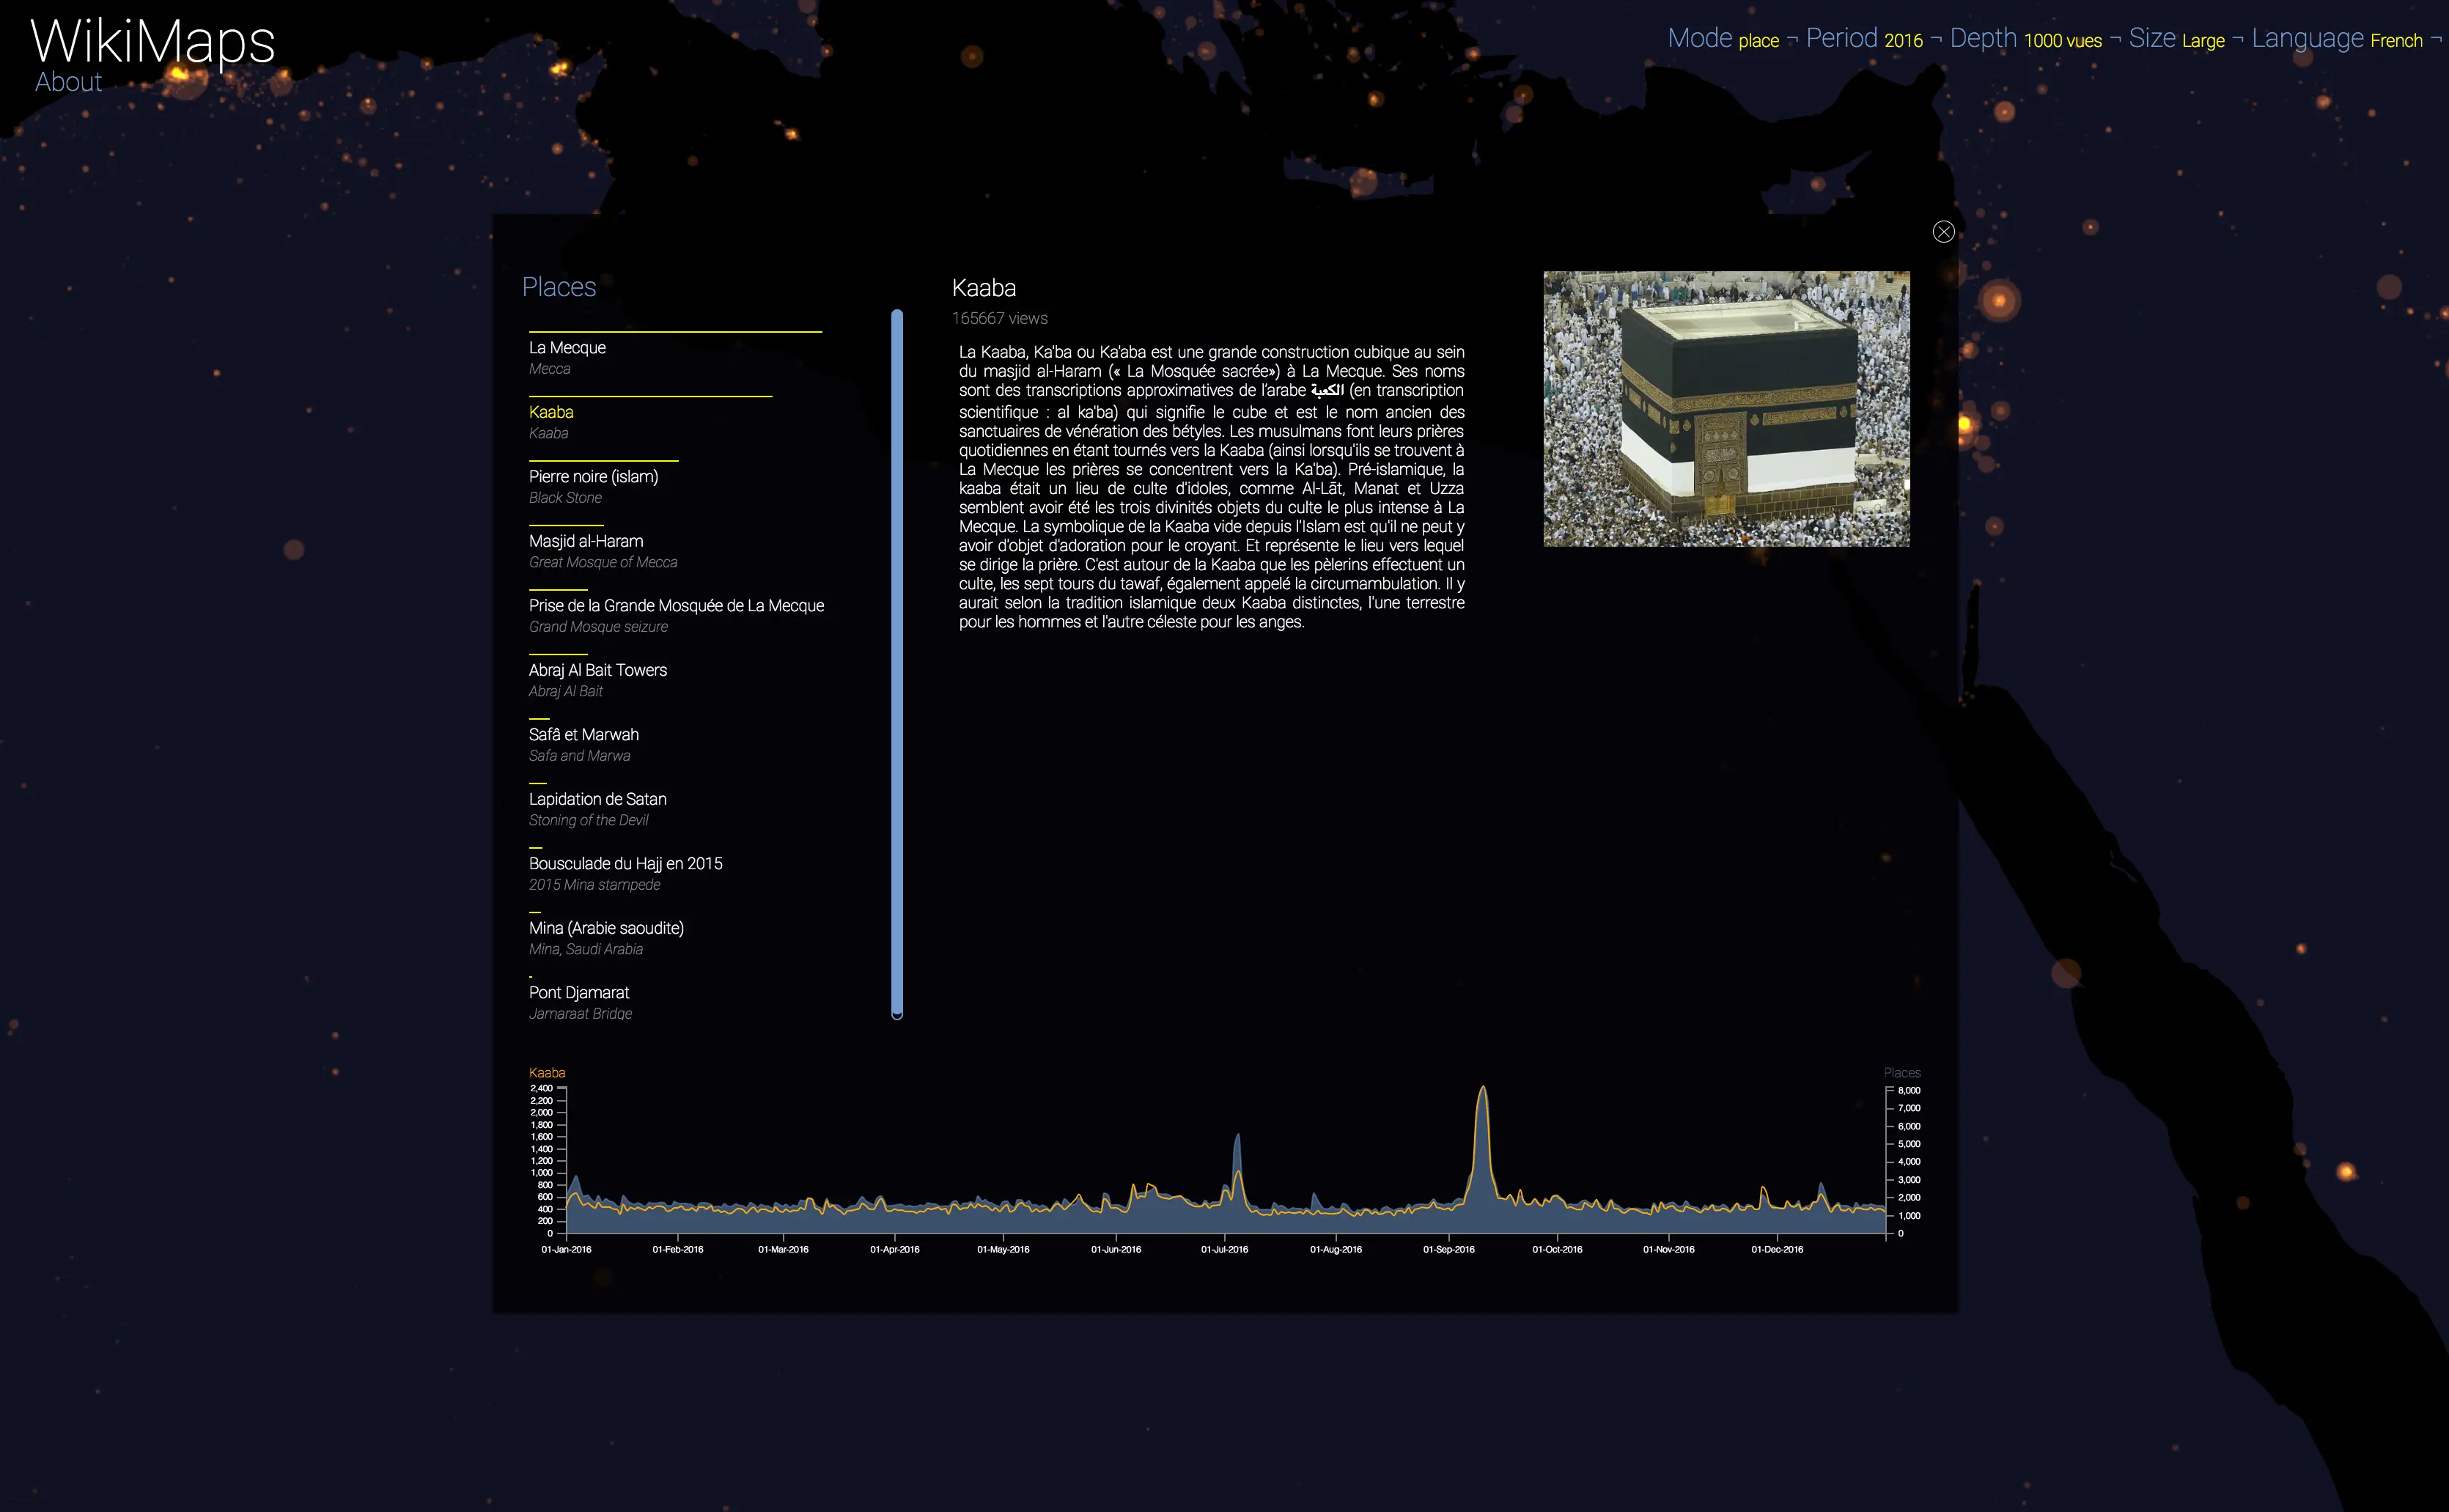
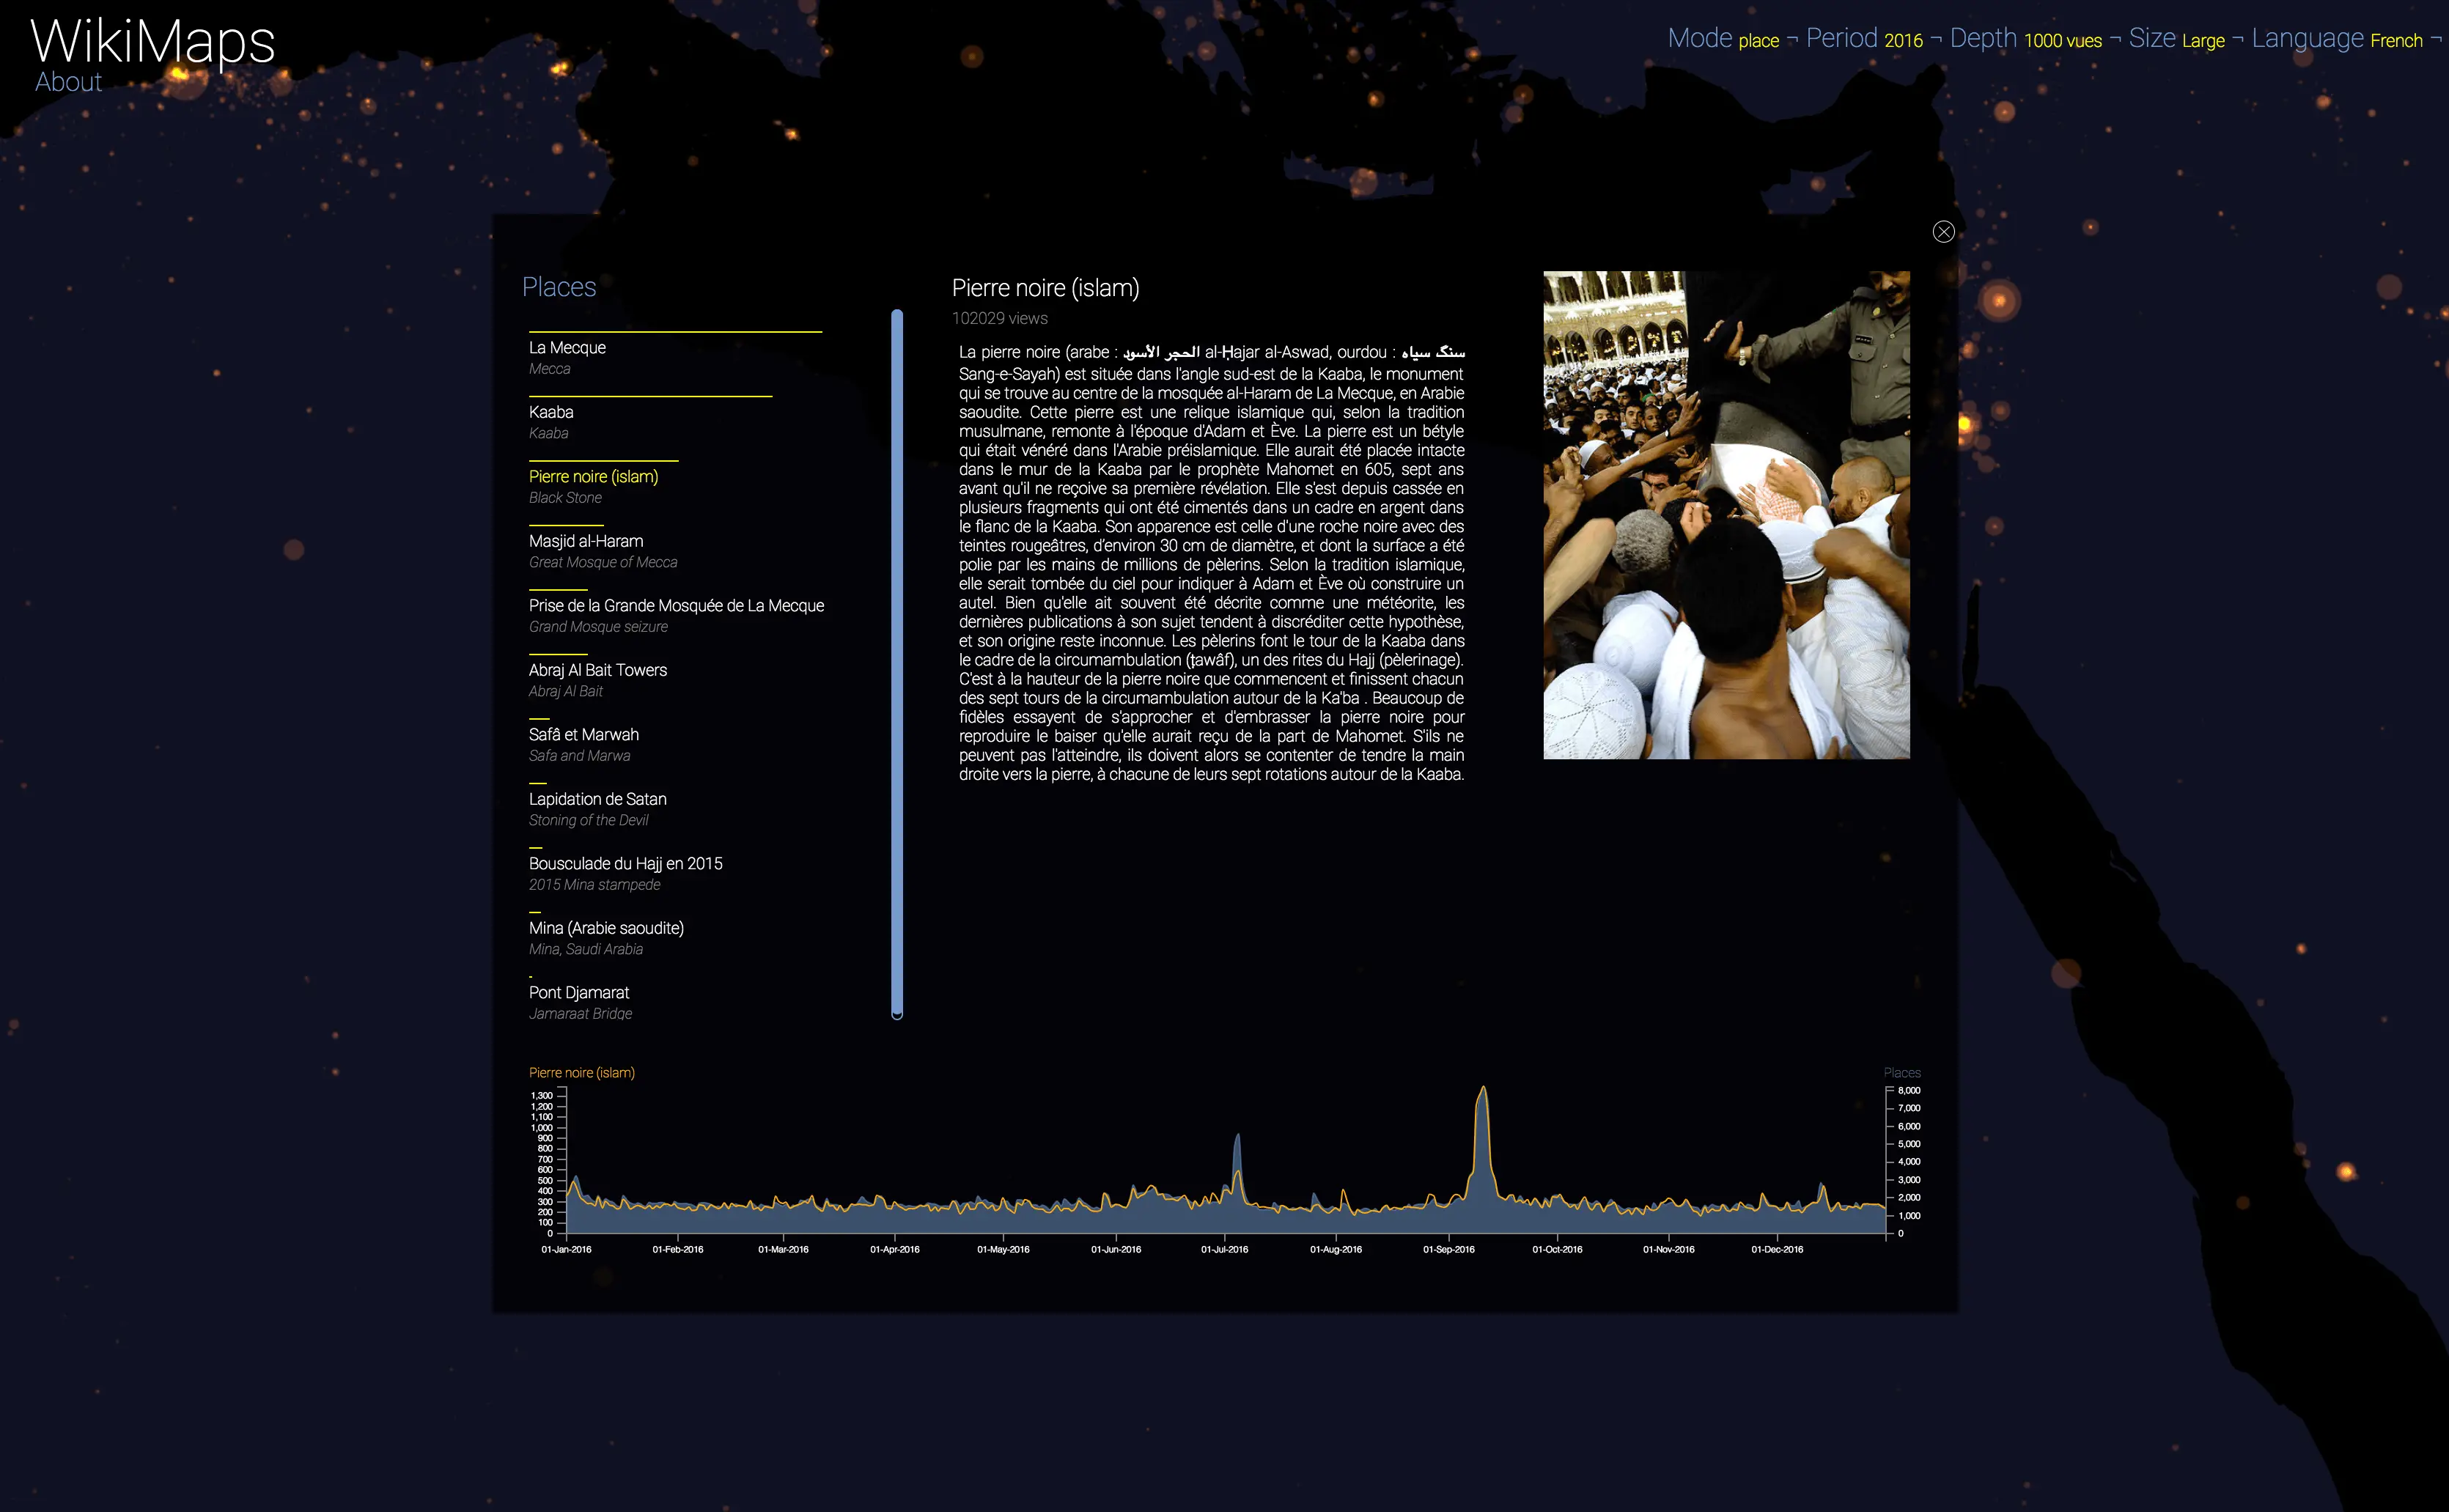
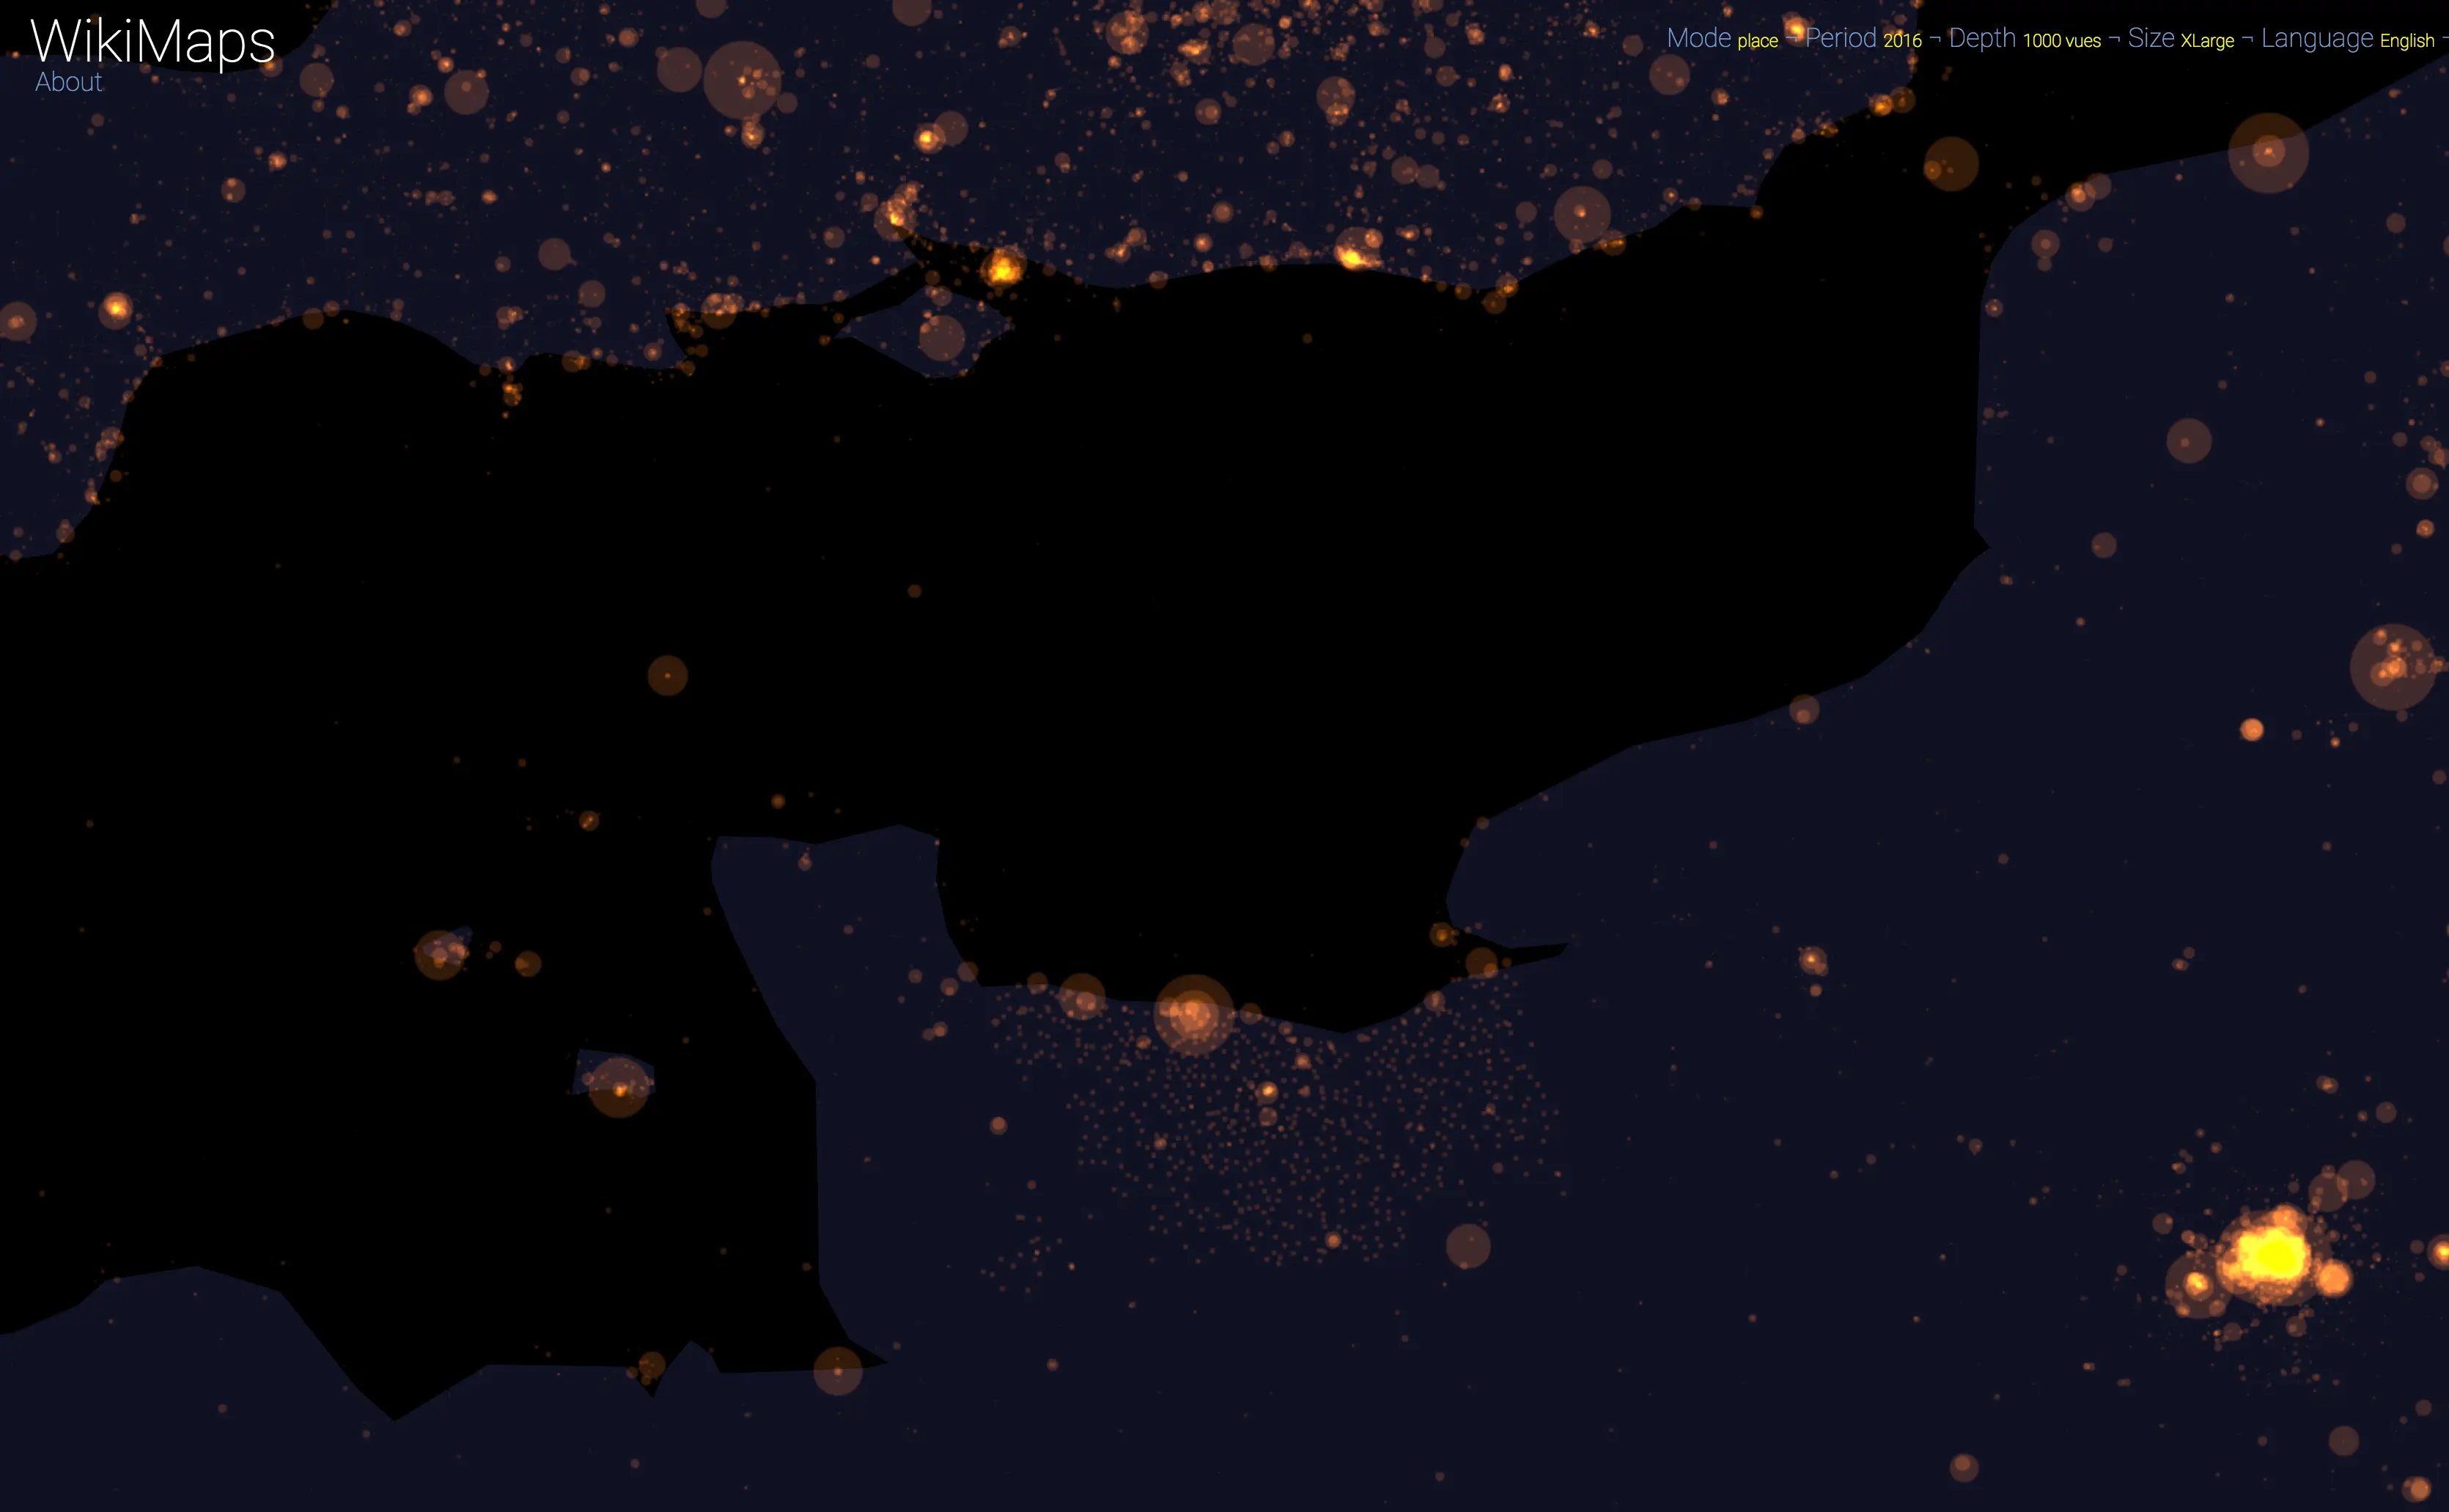
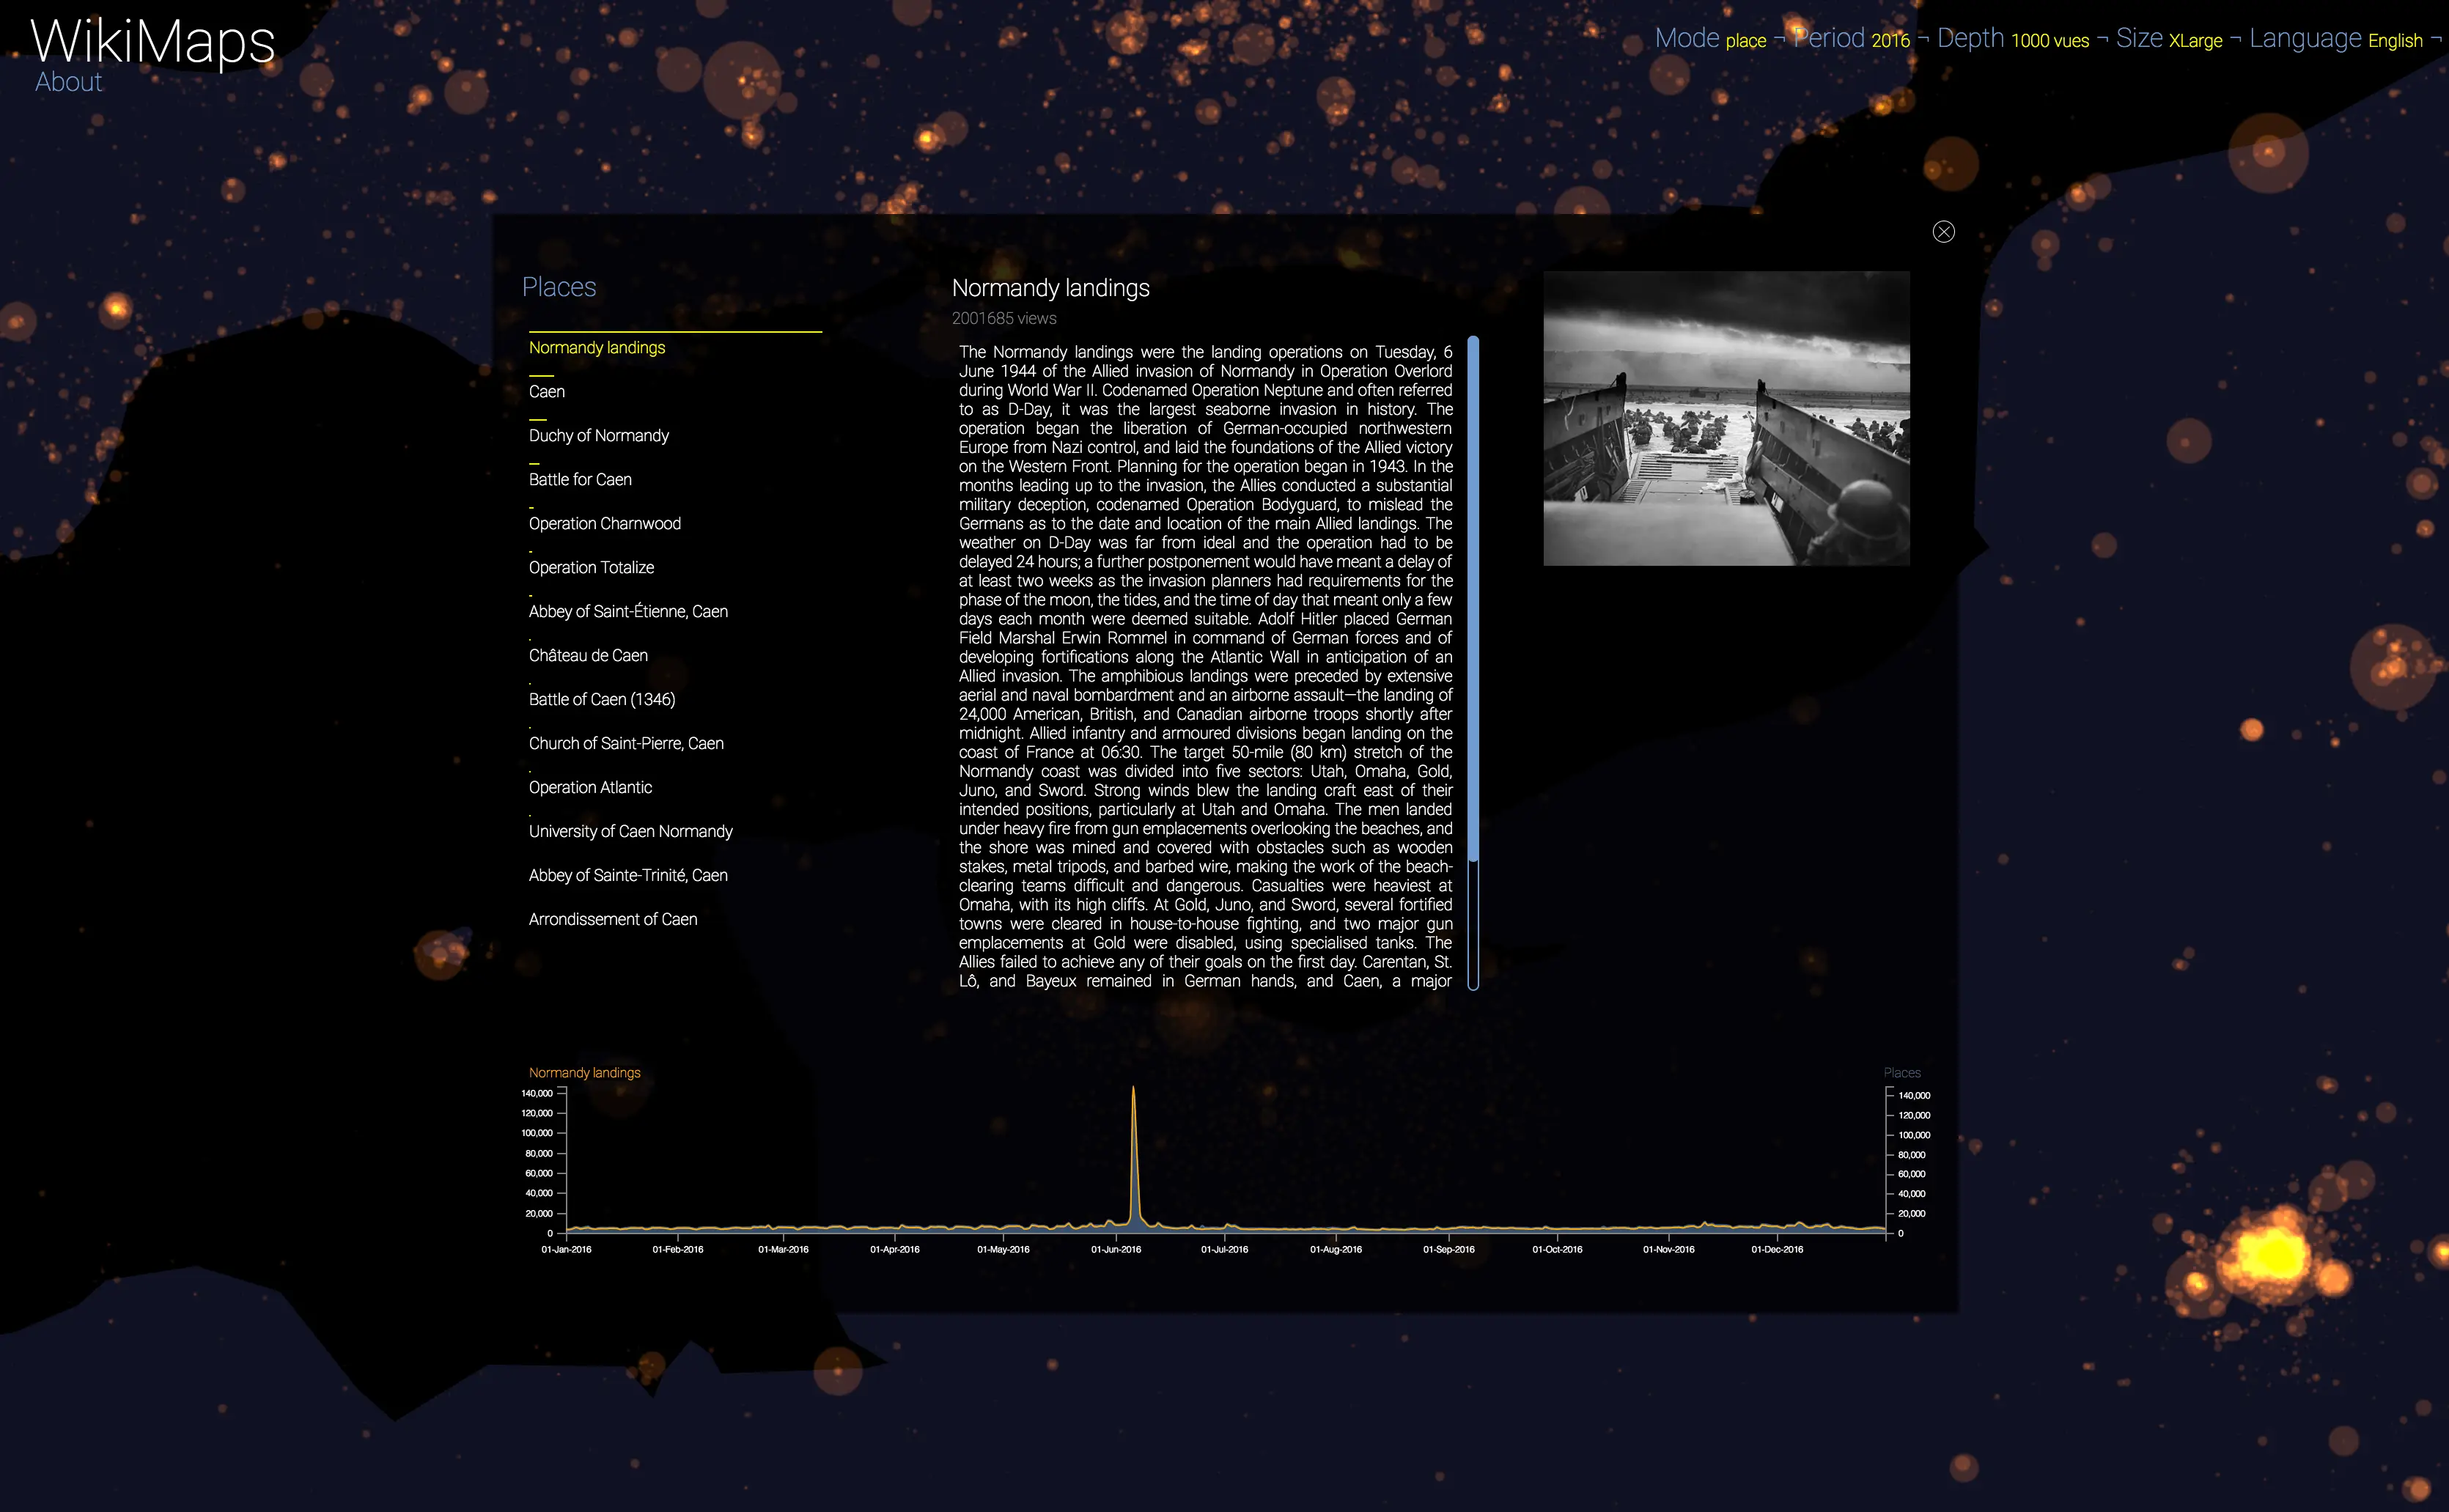
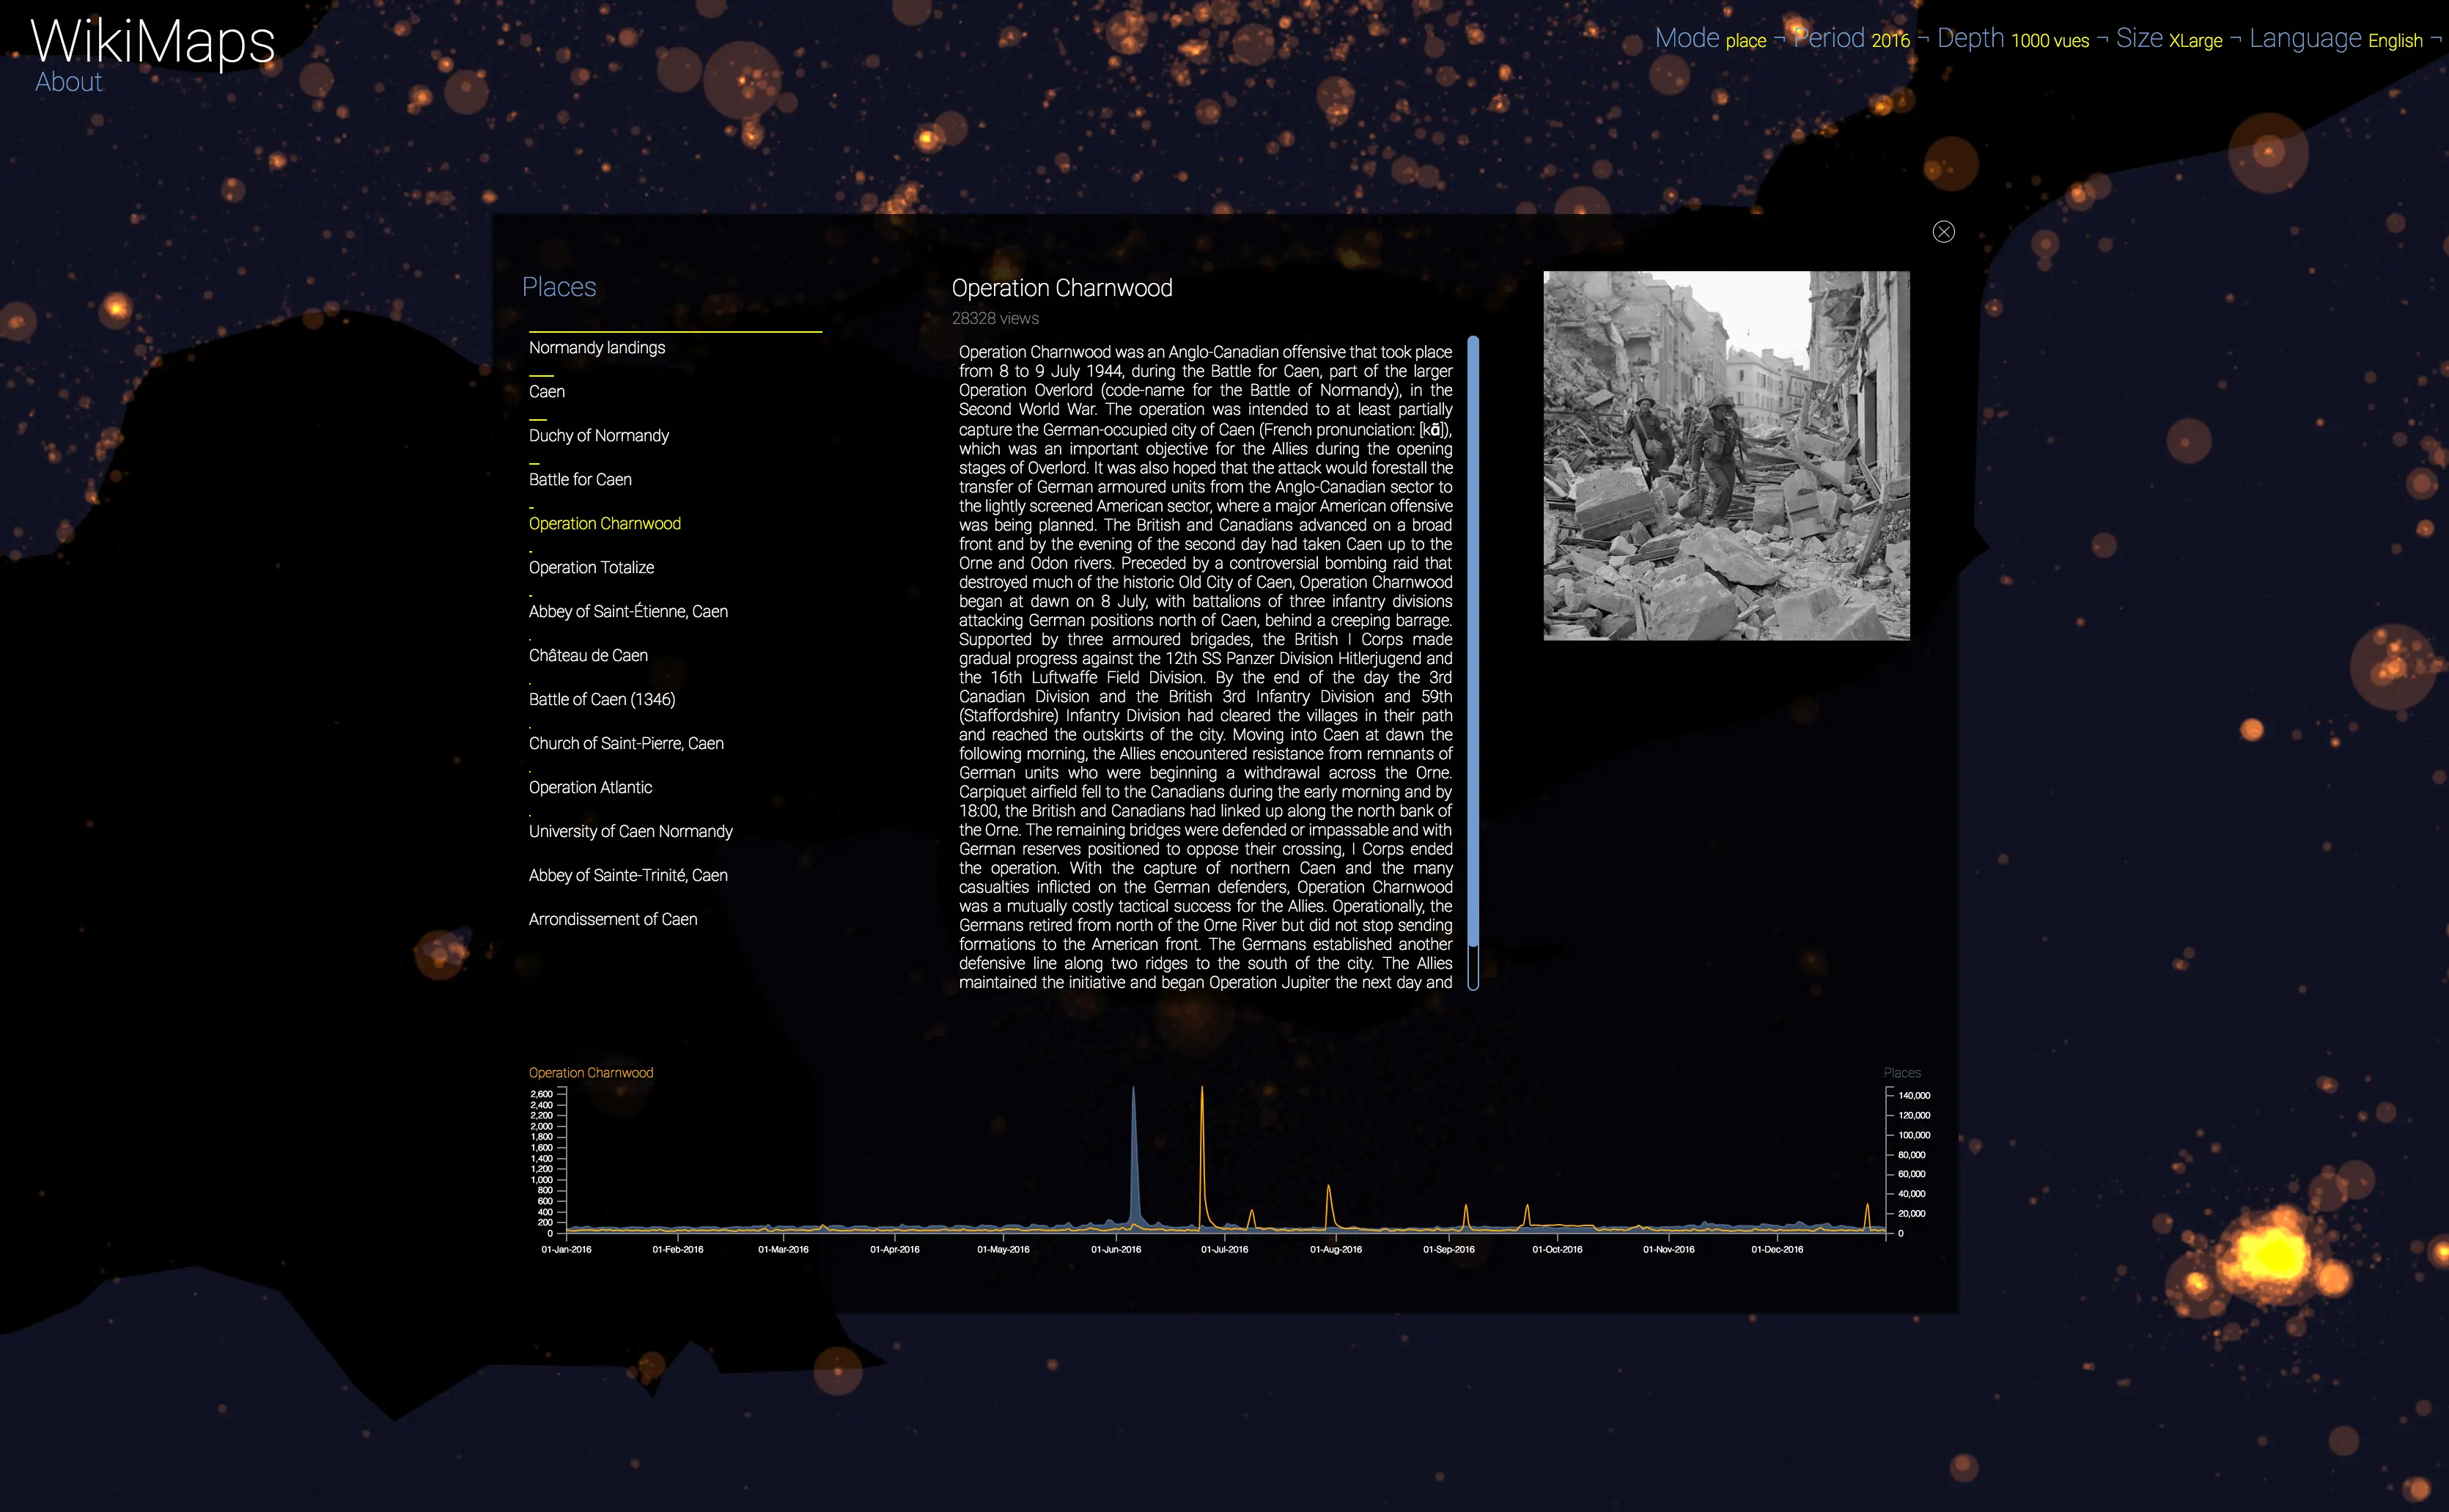
WikiMaps allows you to select any part of the world and identify the places that arouse the greatest interest.
Selecting a location activates a dashboard. It presents on the left the list of the 50 most consulted pages, on the right an automatic description of the most consulted page, as well as the evolution of its daily consultations during the considered year at the bottom.
Once the dashboard is activated, it is possible to select any of the locations and compare the evolution of its consultations (in yellow) with that of the entire area considered (in blue).
The plurality of phenomena that attract collective attention is thus clearly perceptible, with a precision difficult to observe by other means. It appears that attacks, cultural and sporting events and broadcasts constitute the main part of identifiable events.
Distribution 2008–2020 version
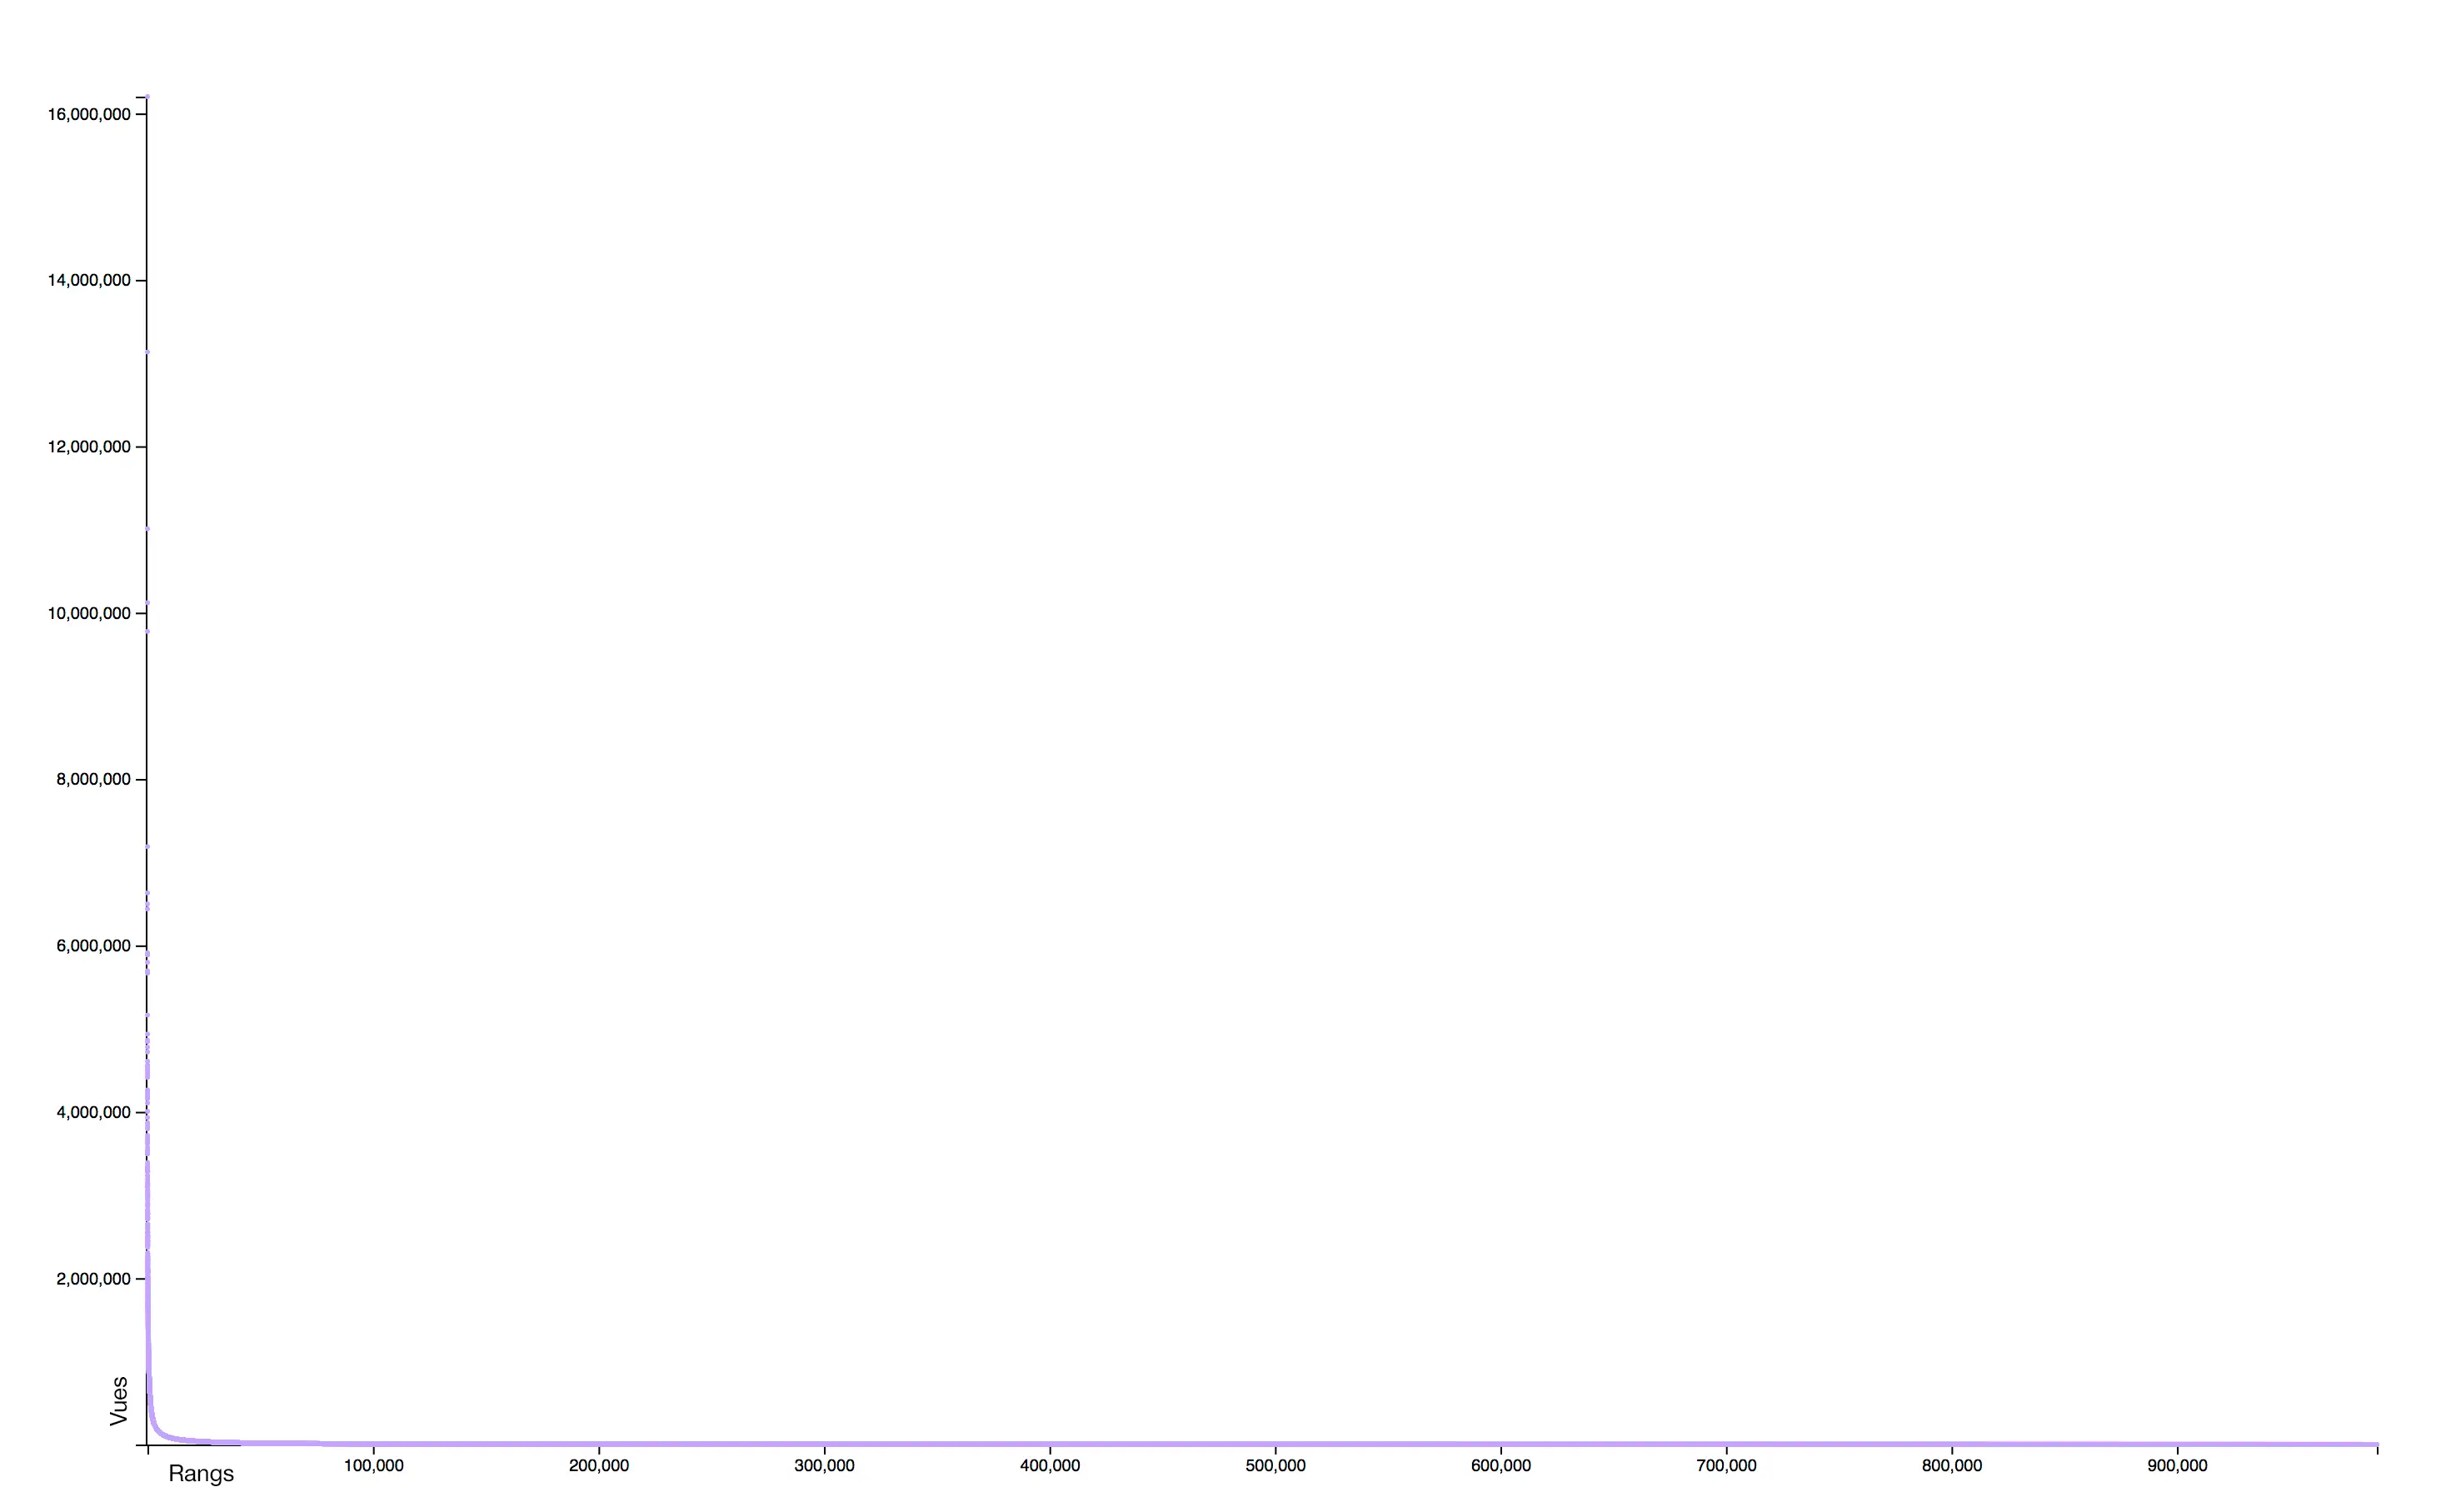
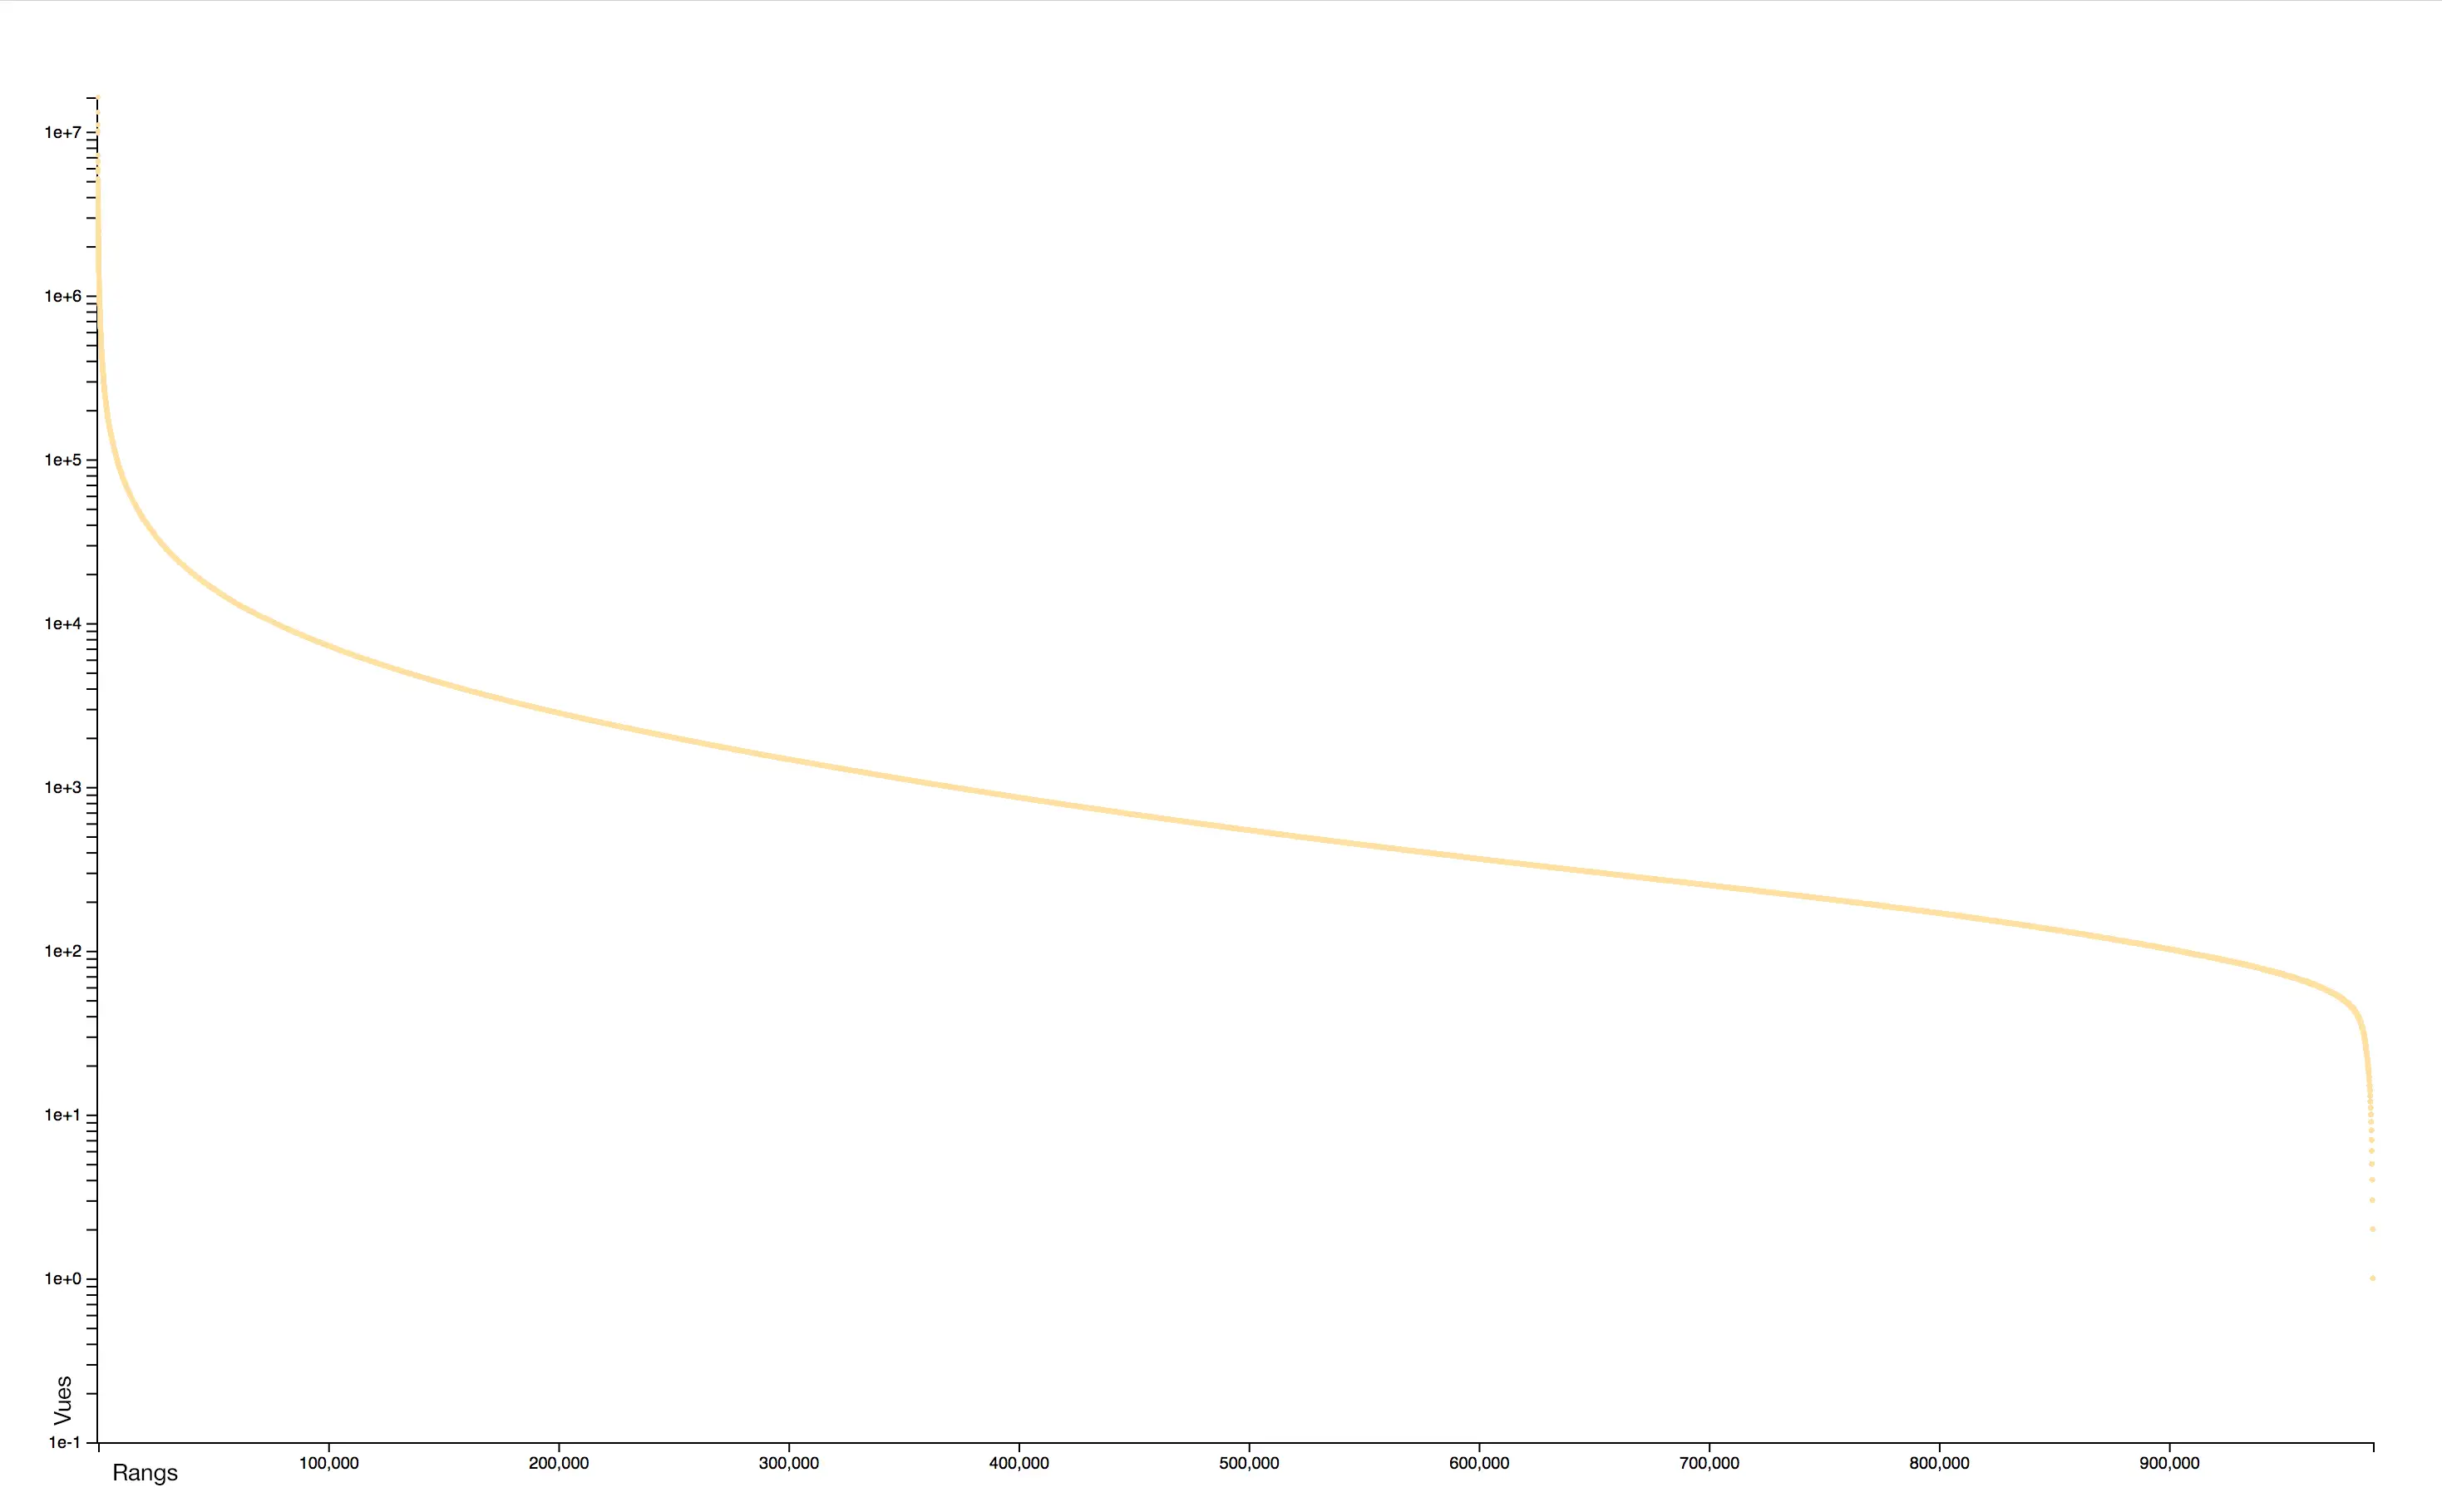
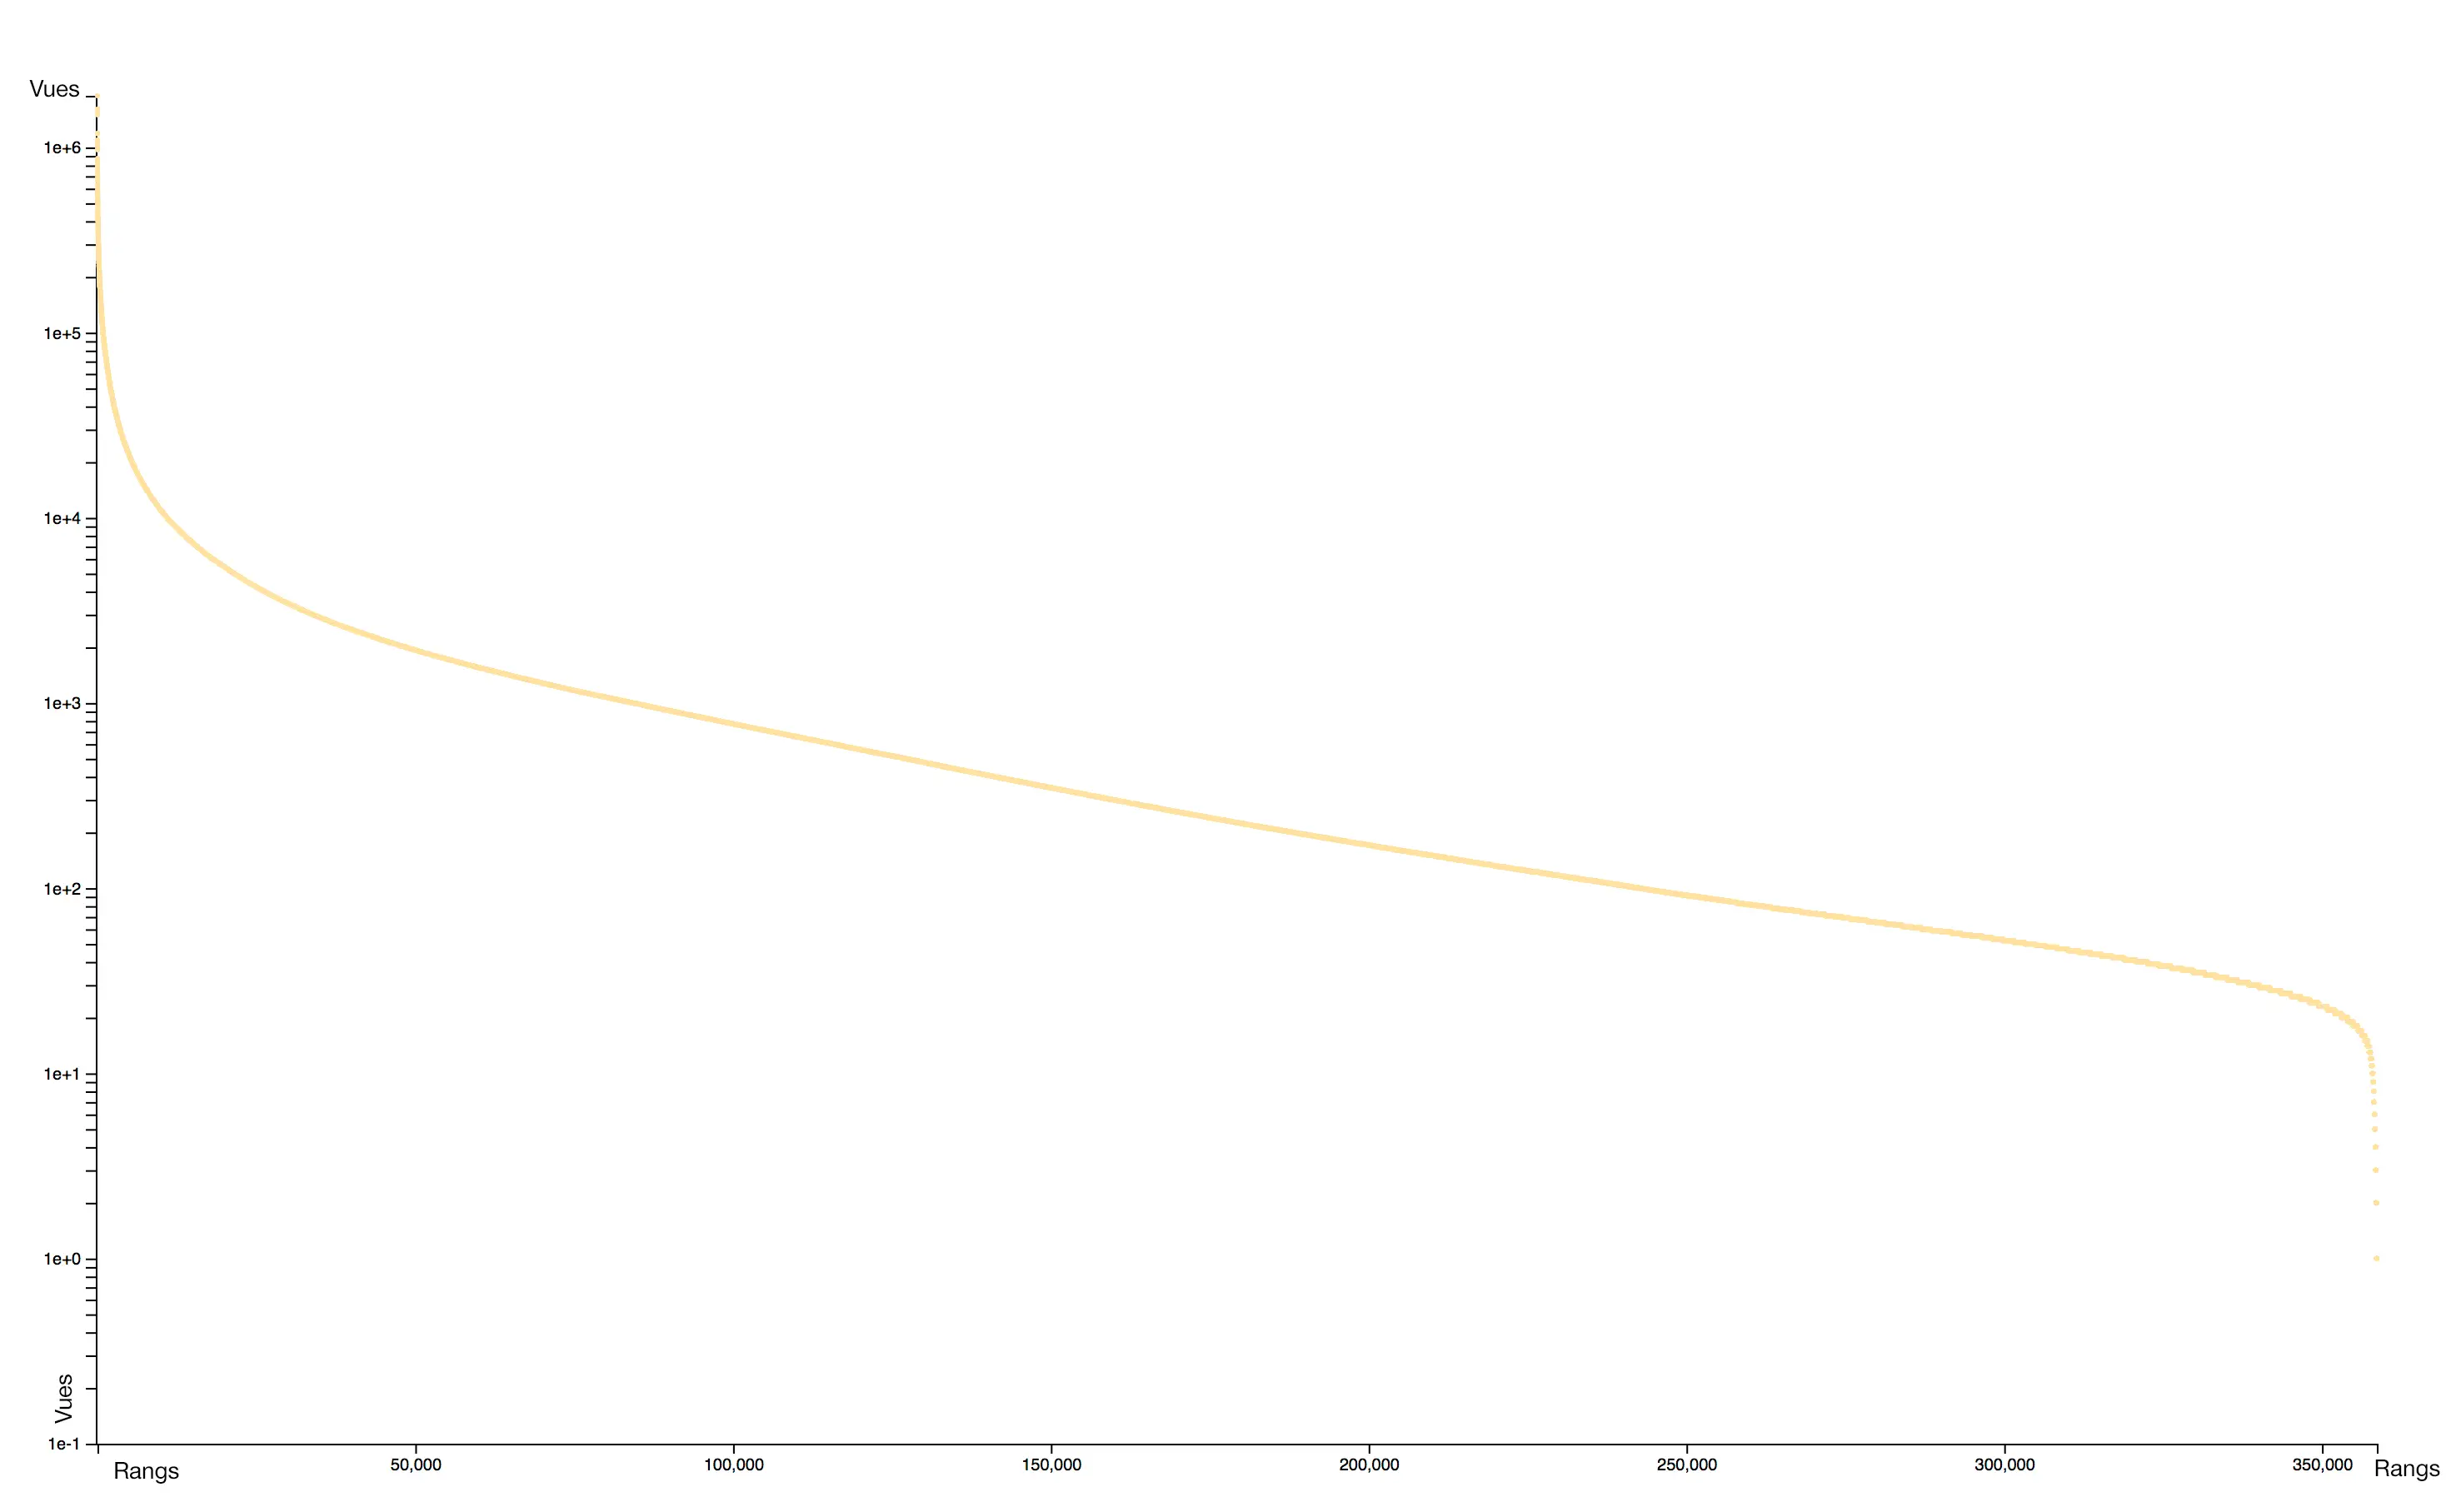
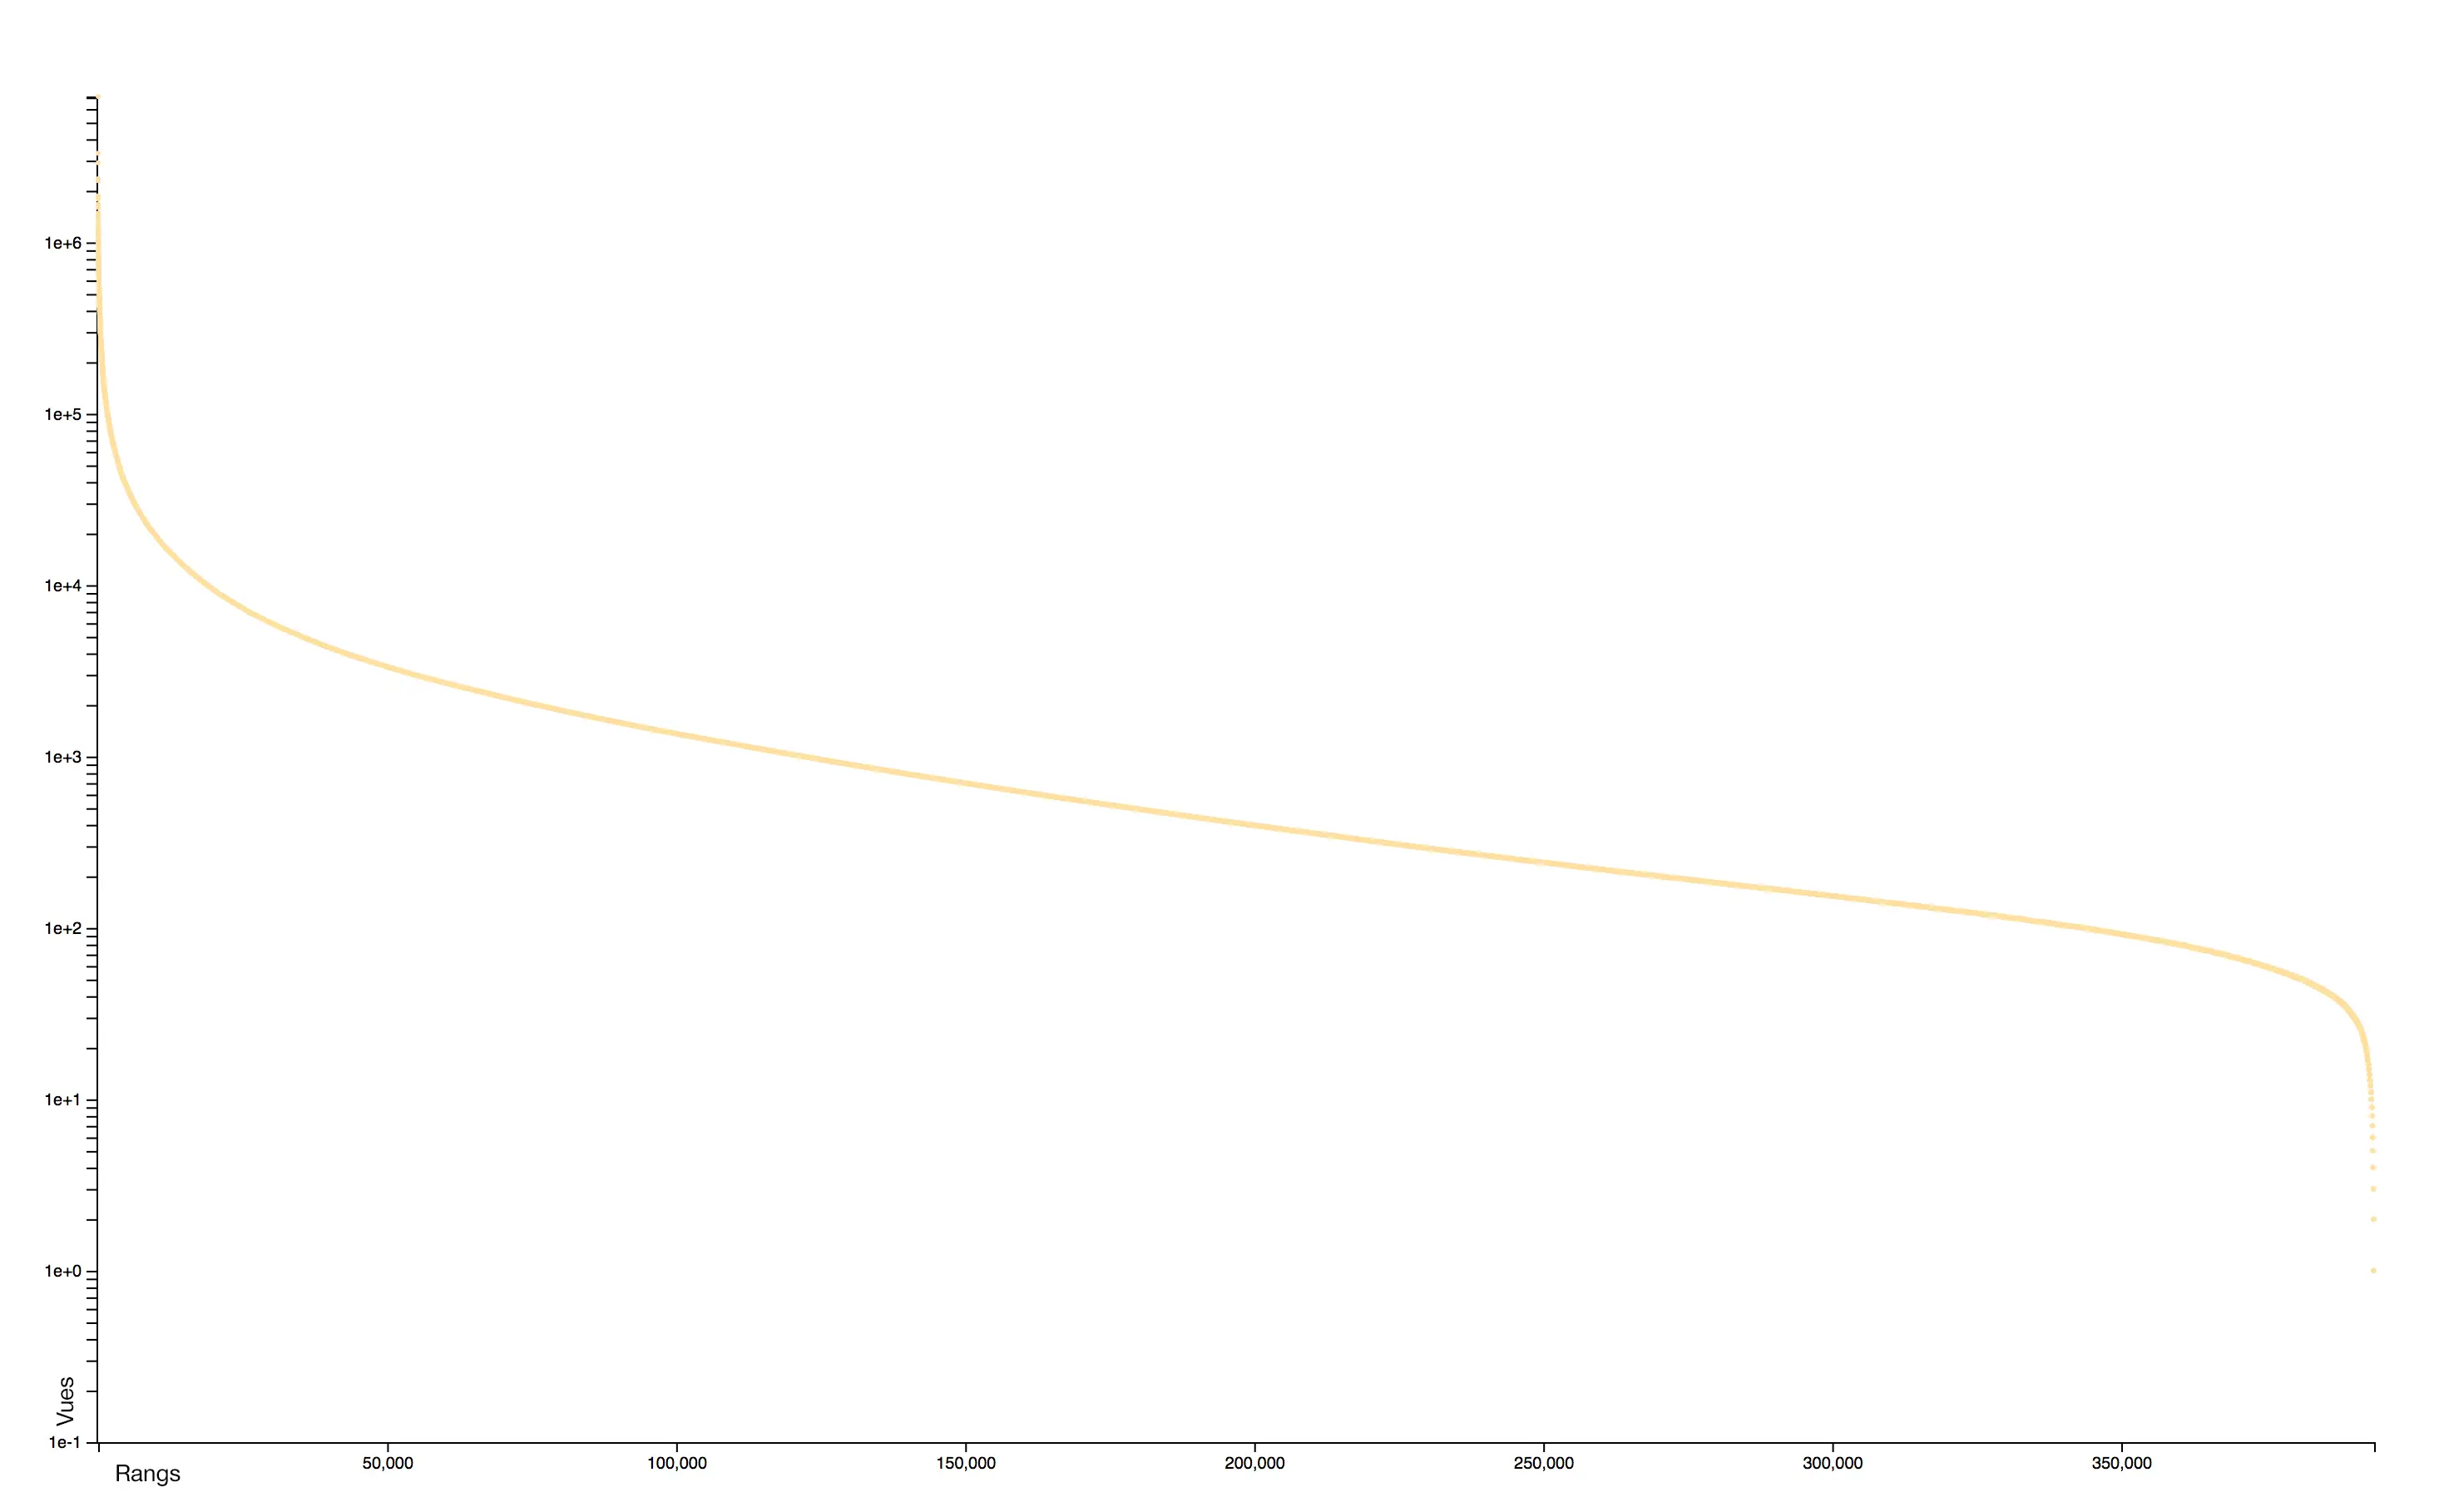
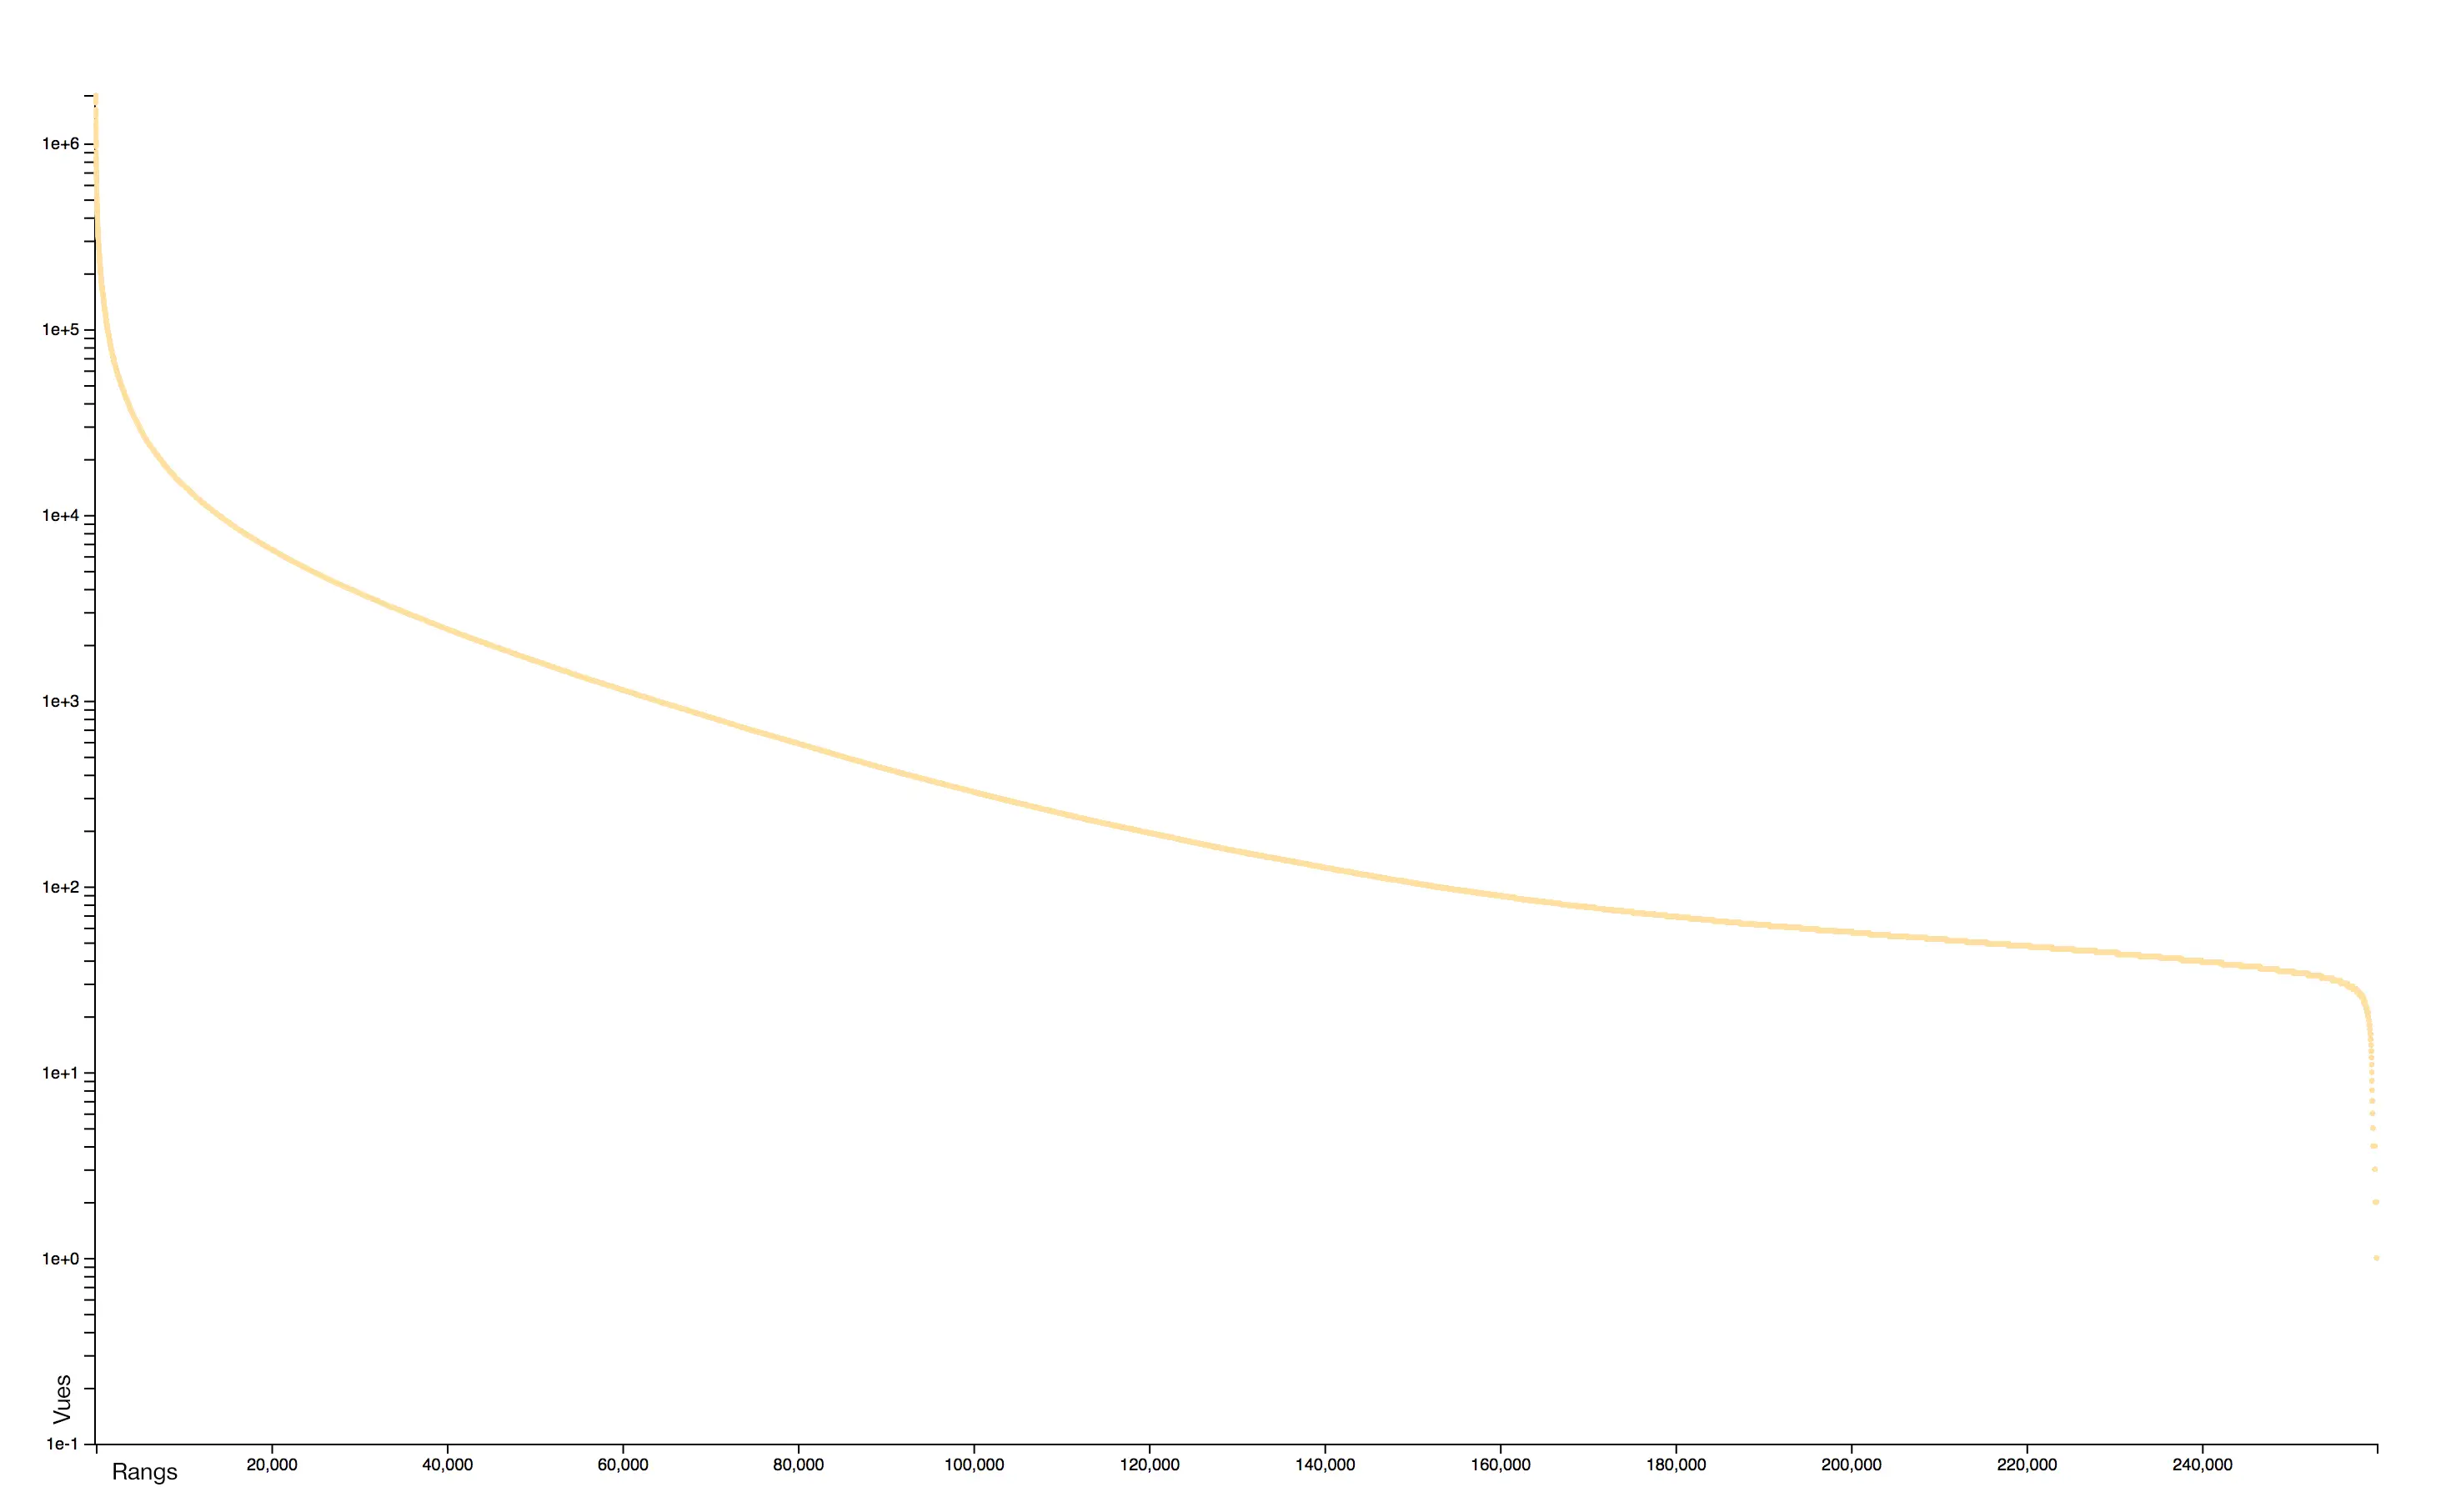
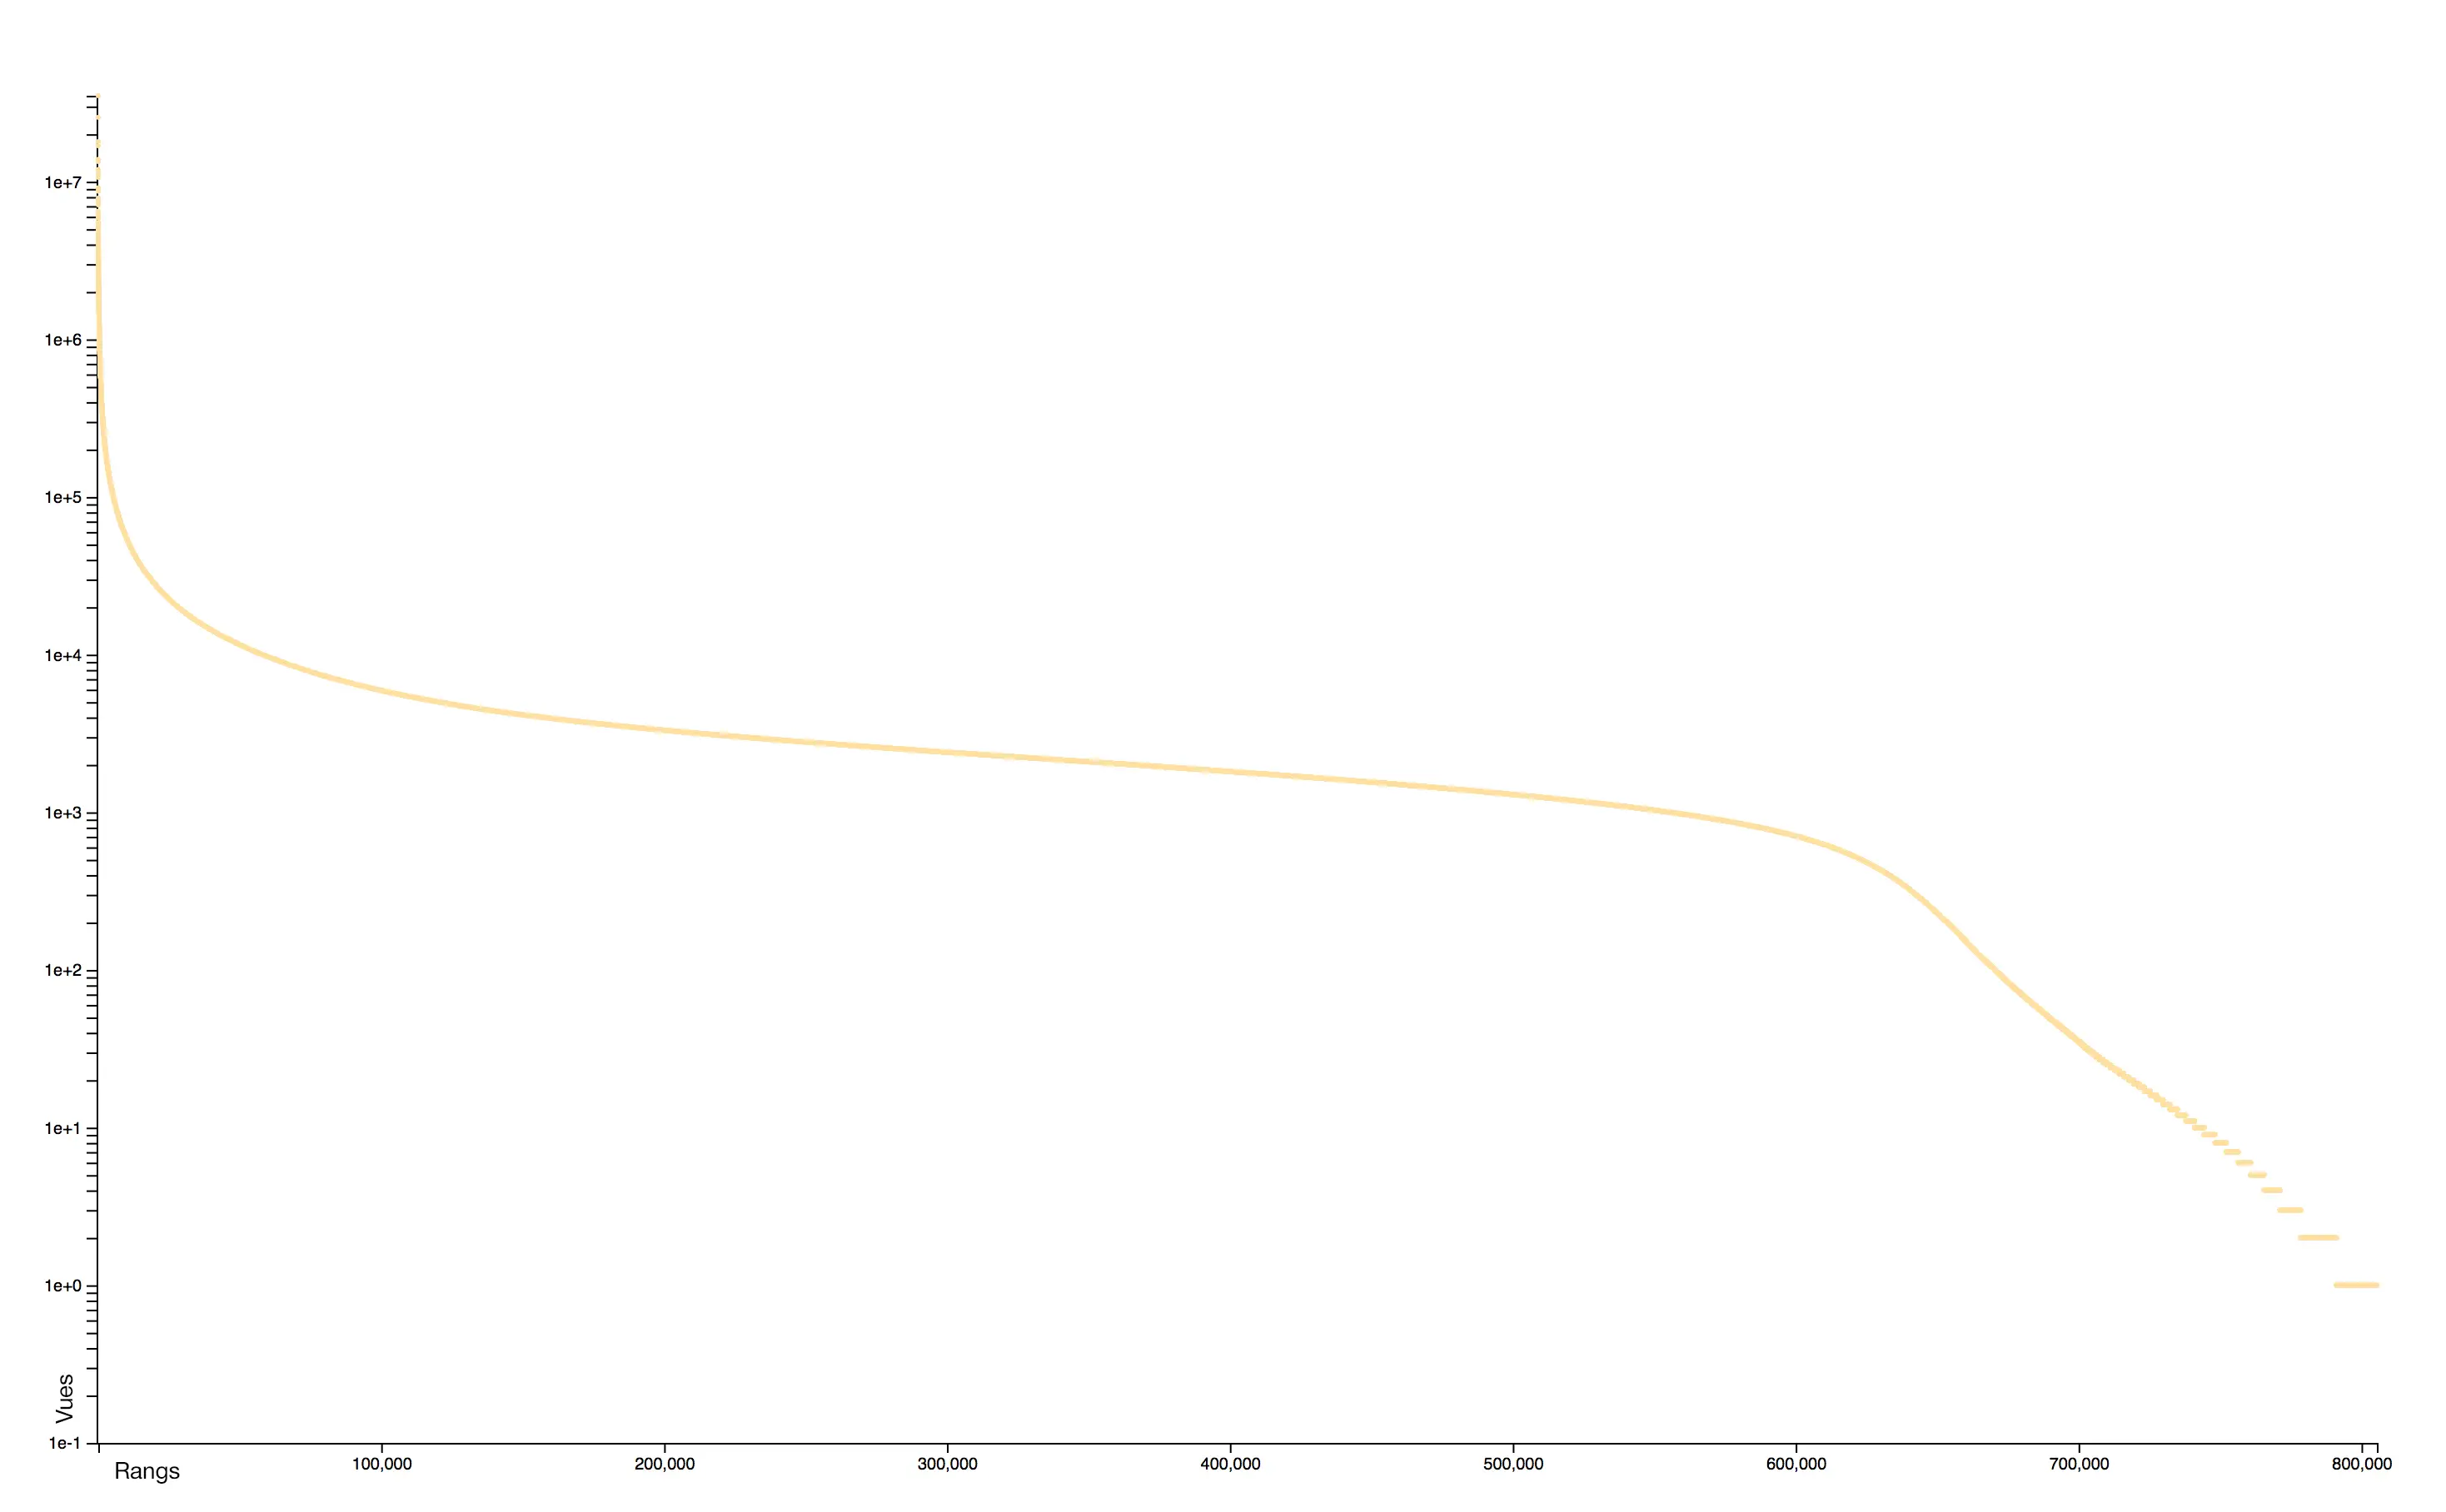
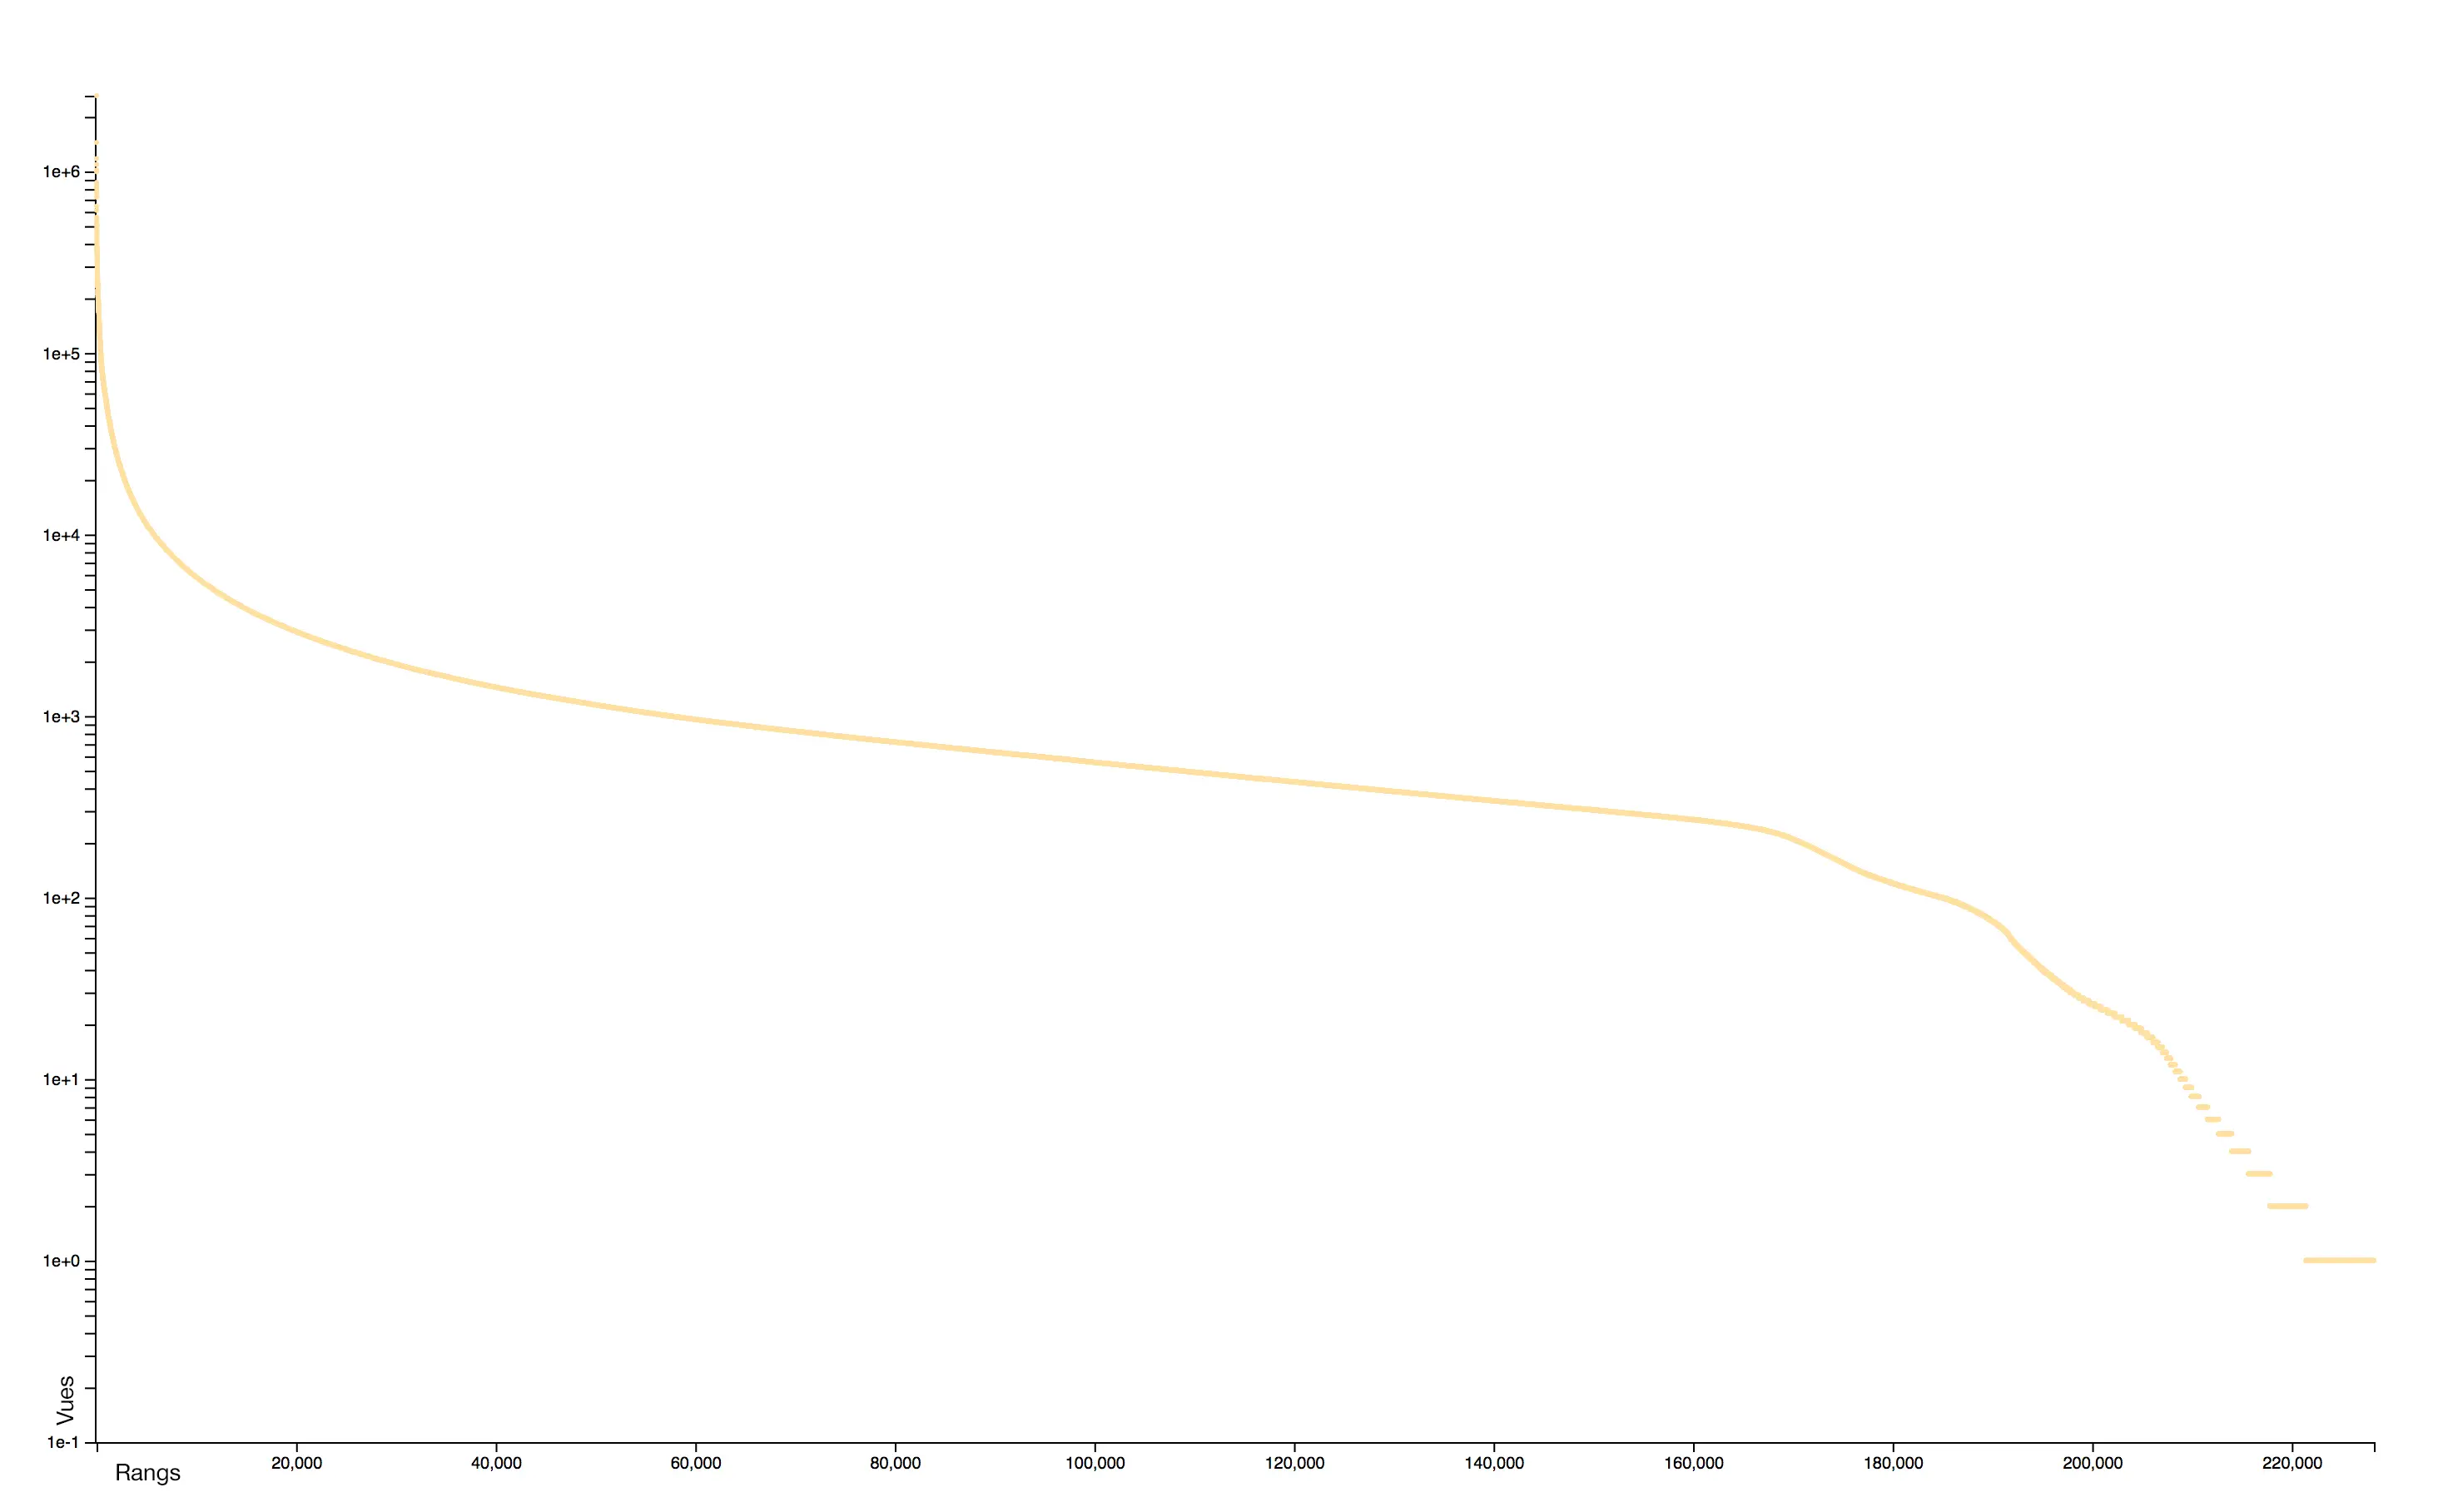
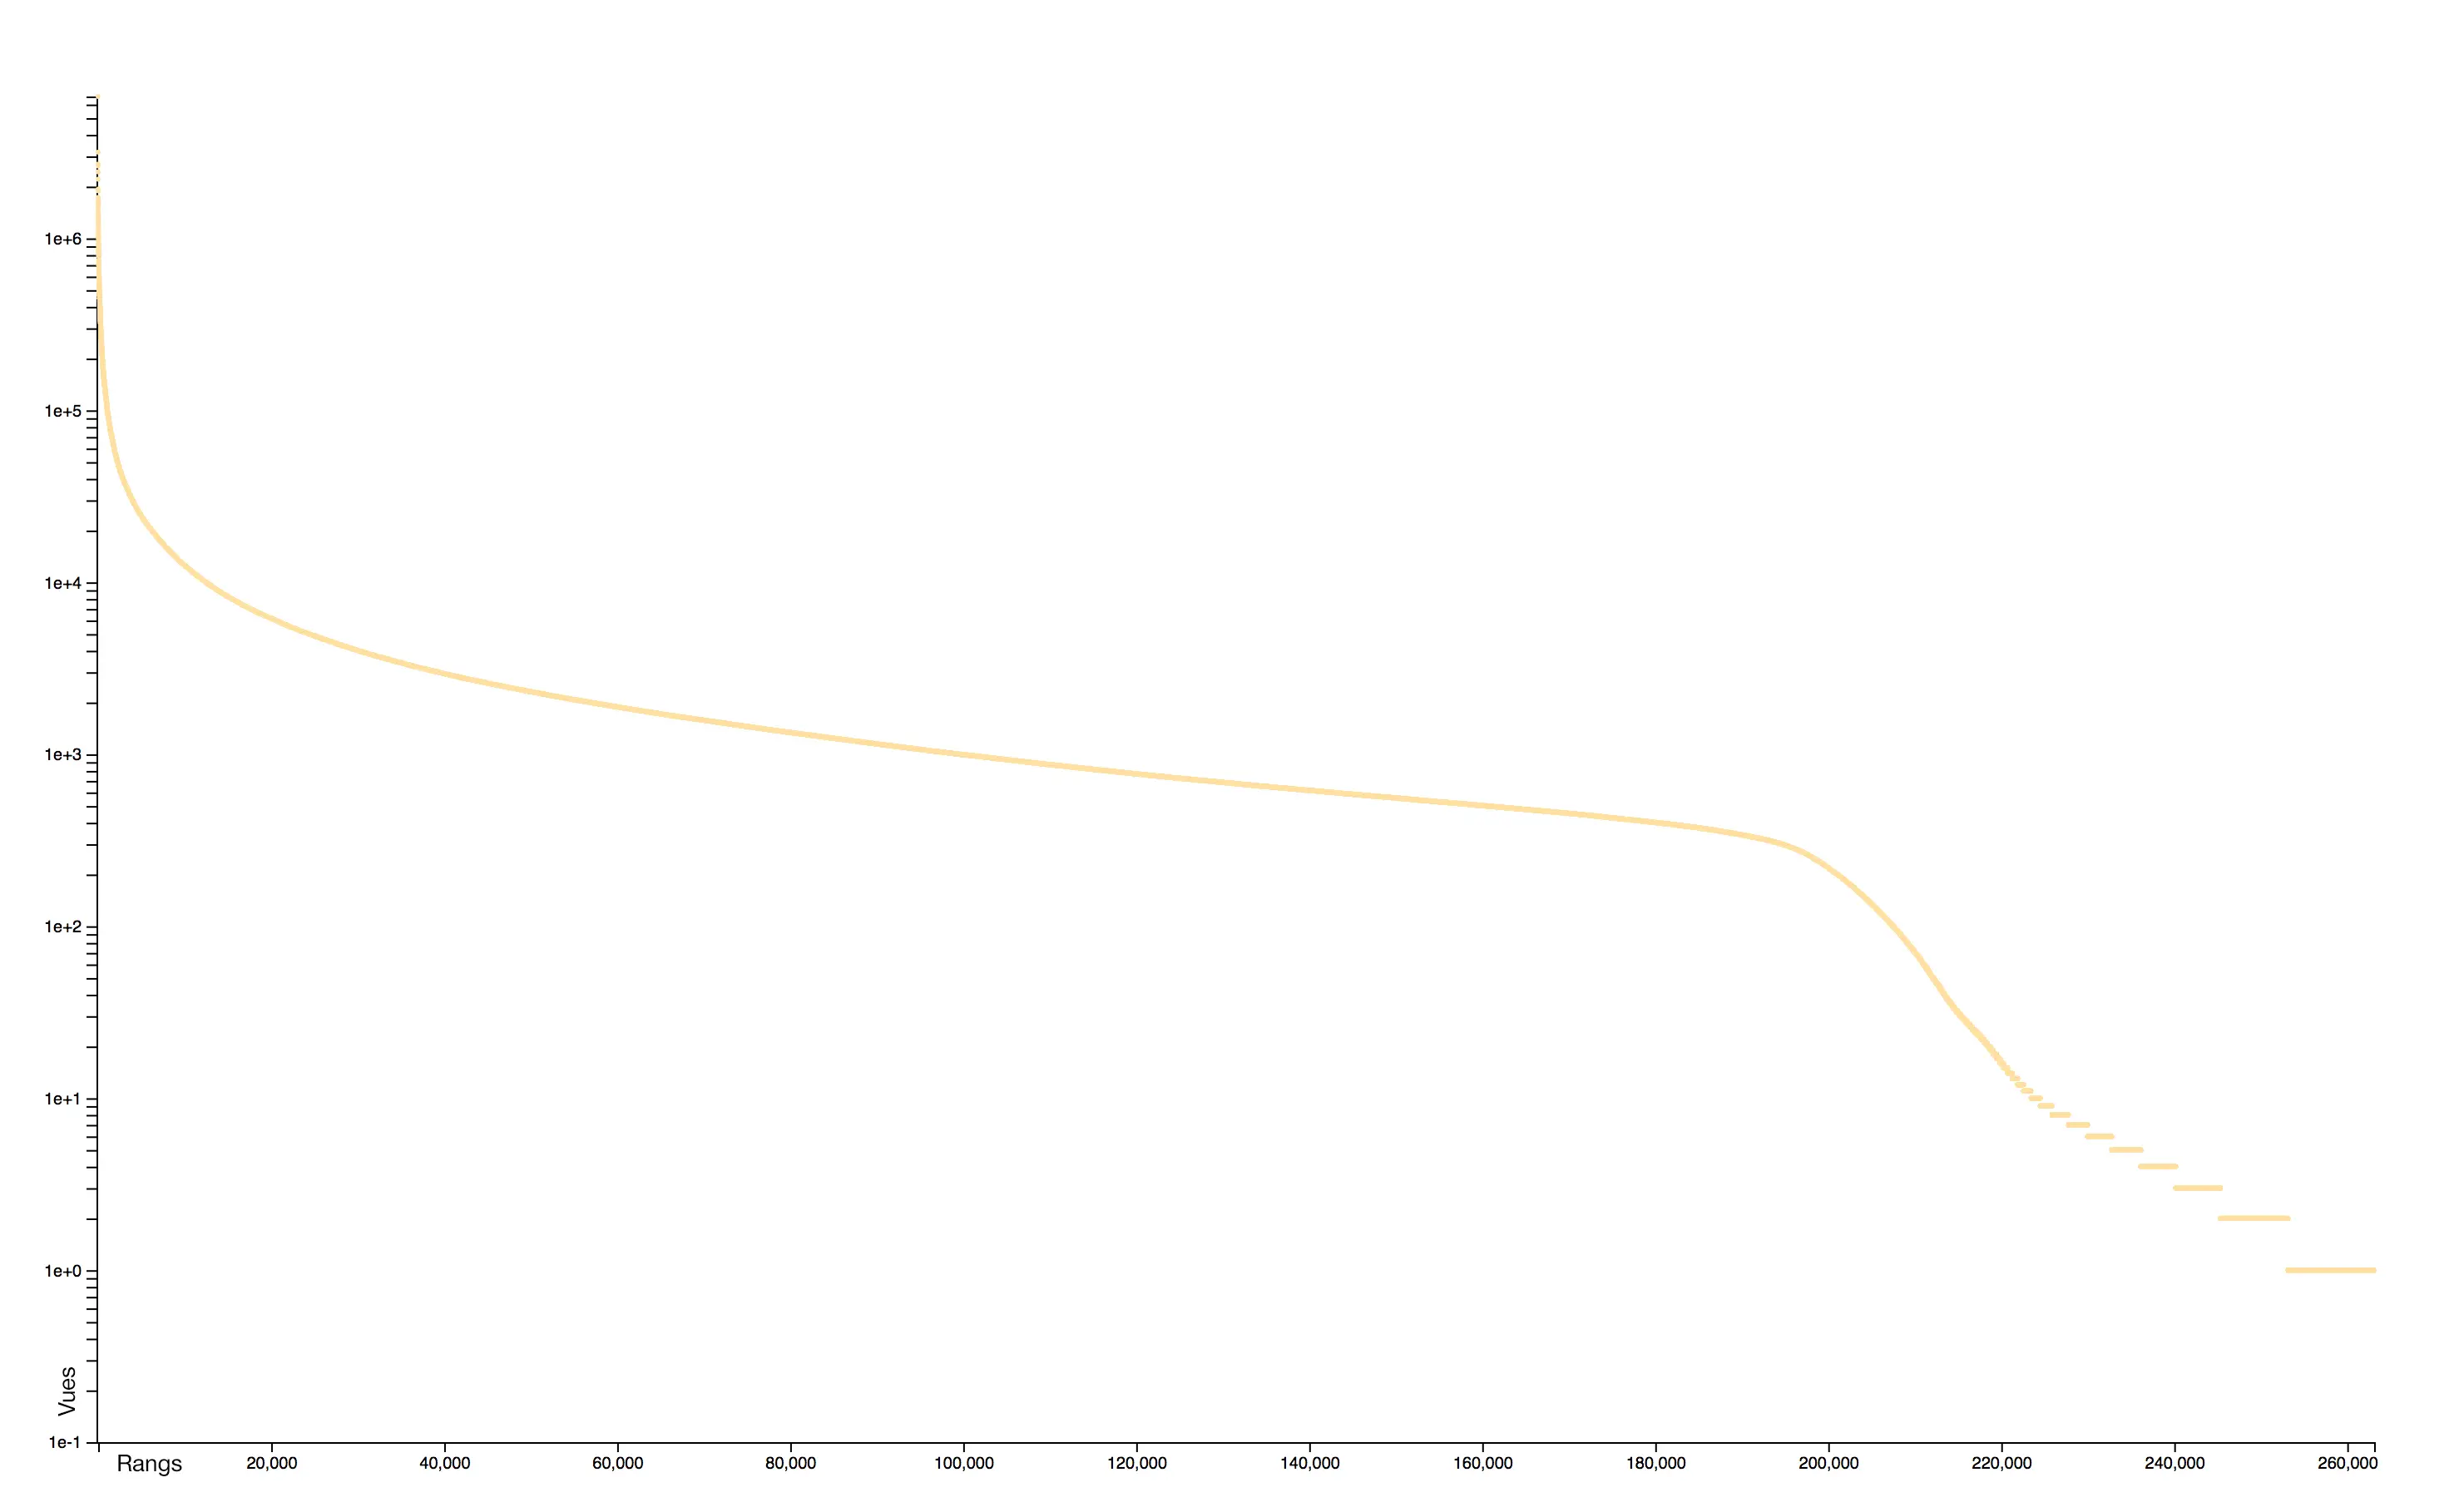
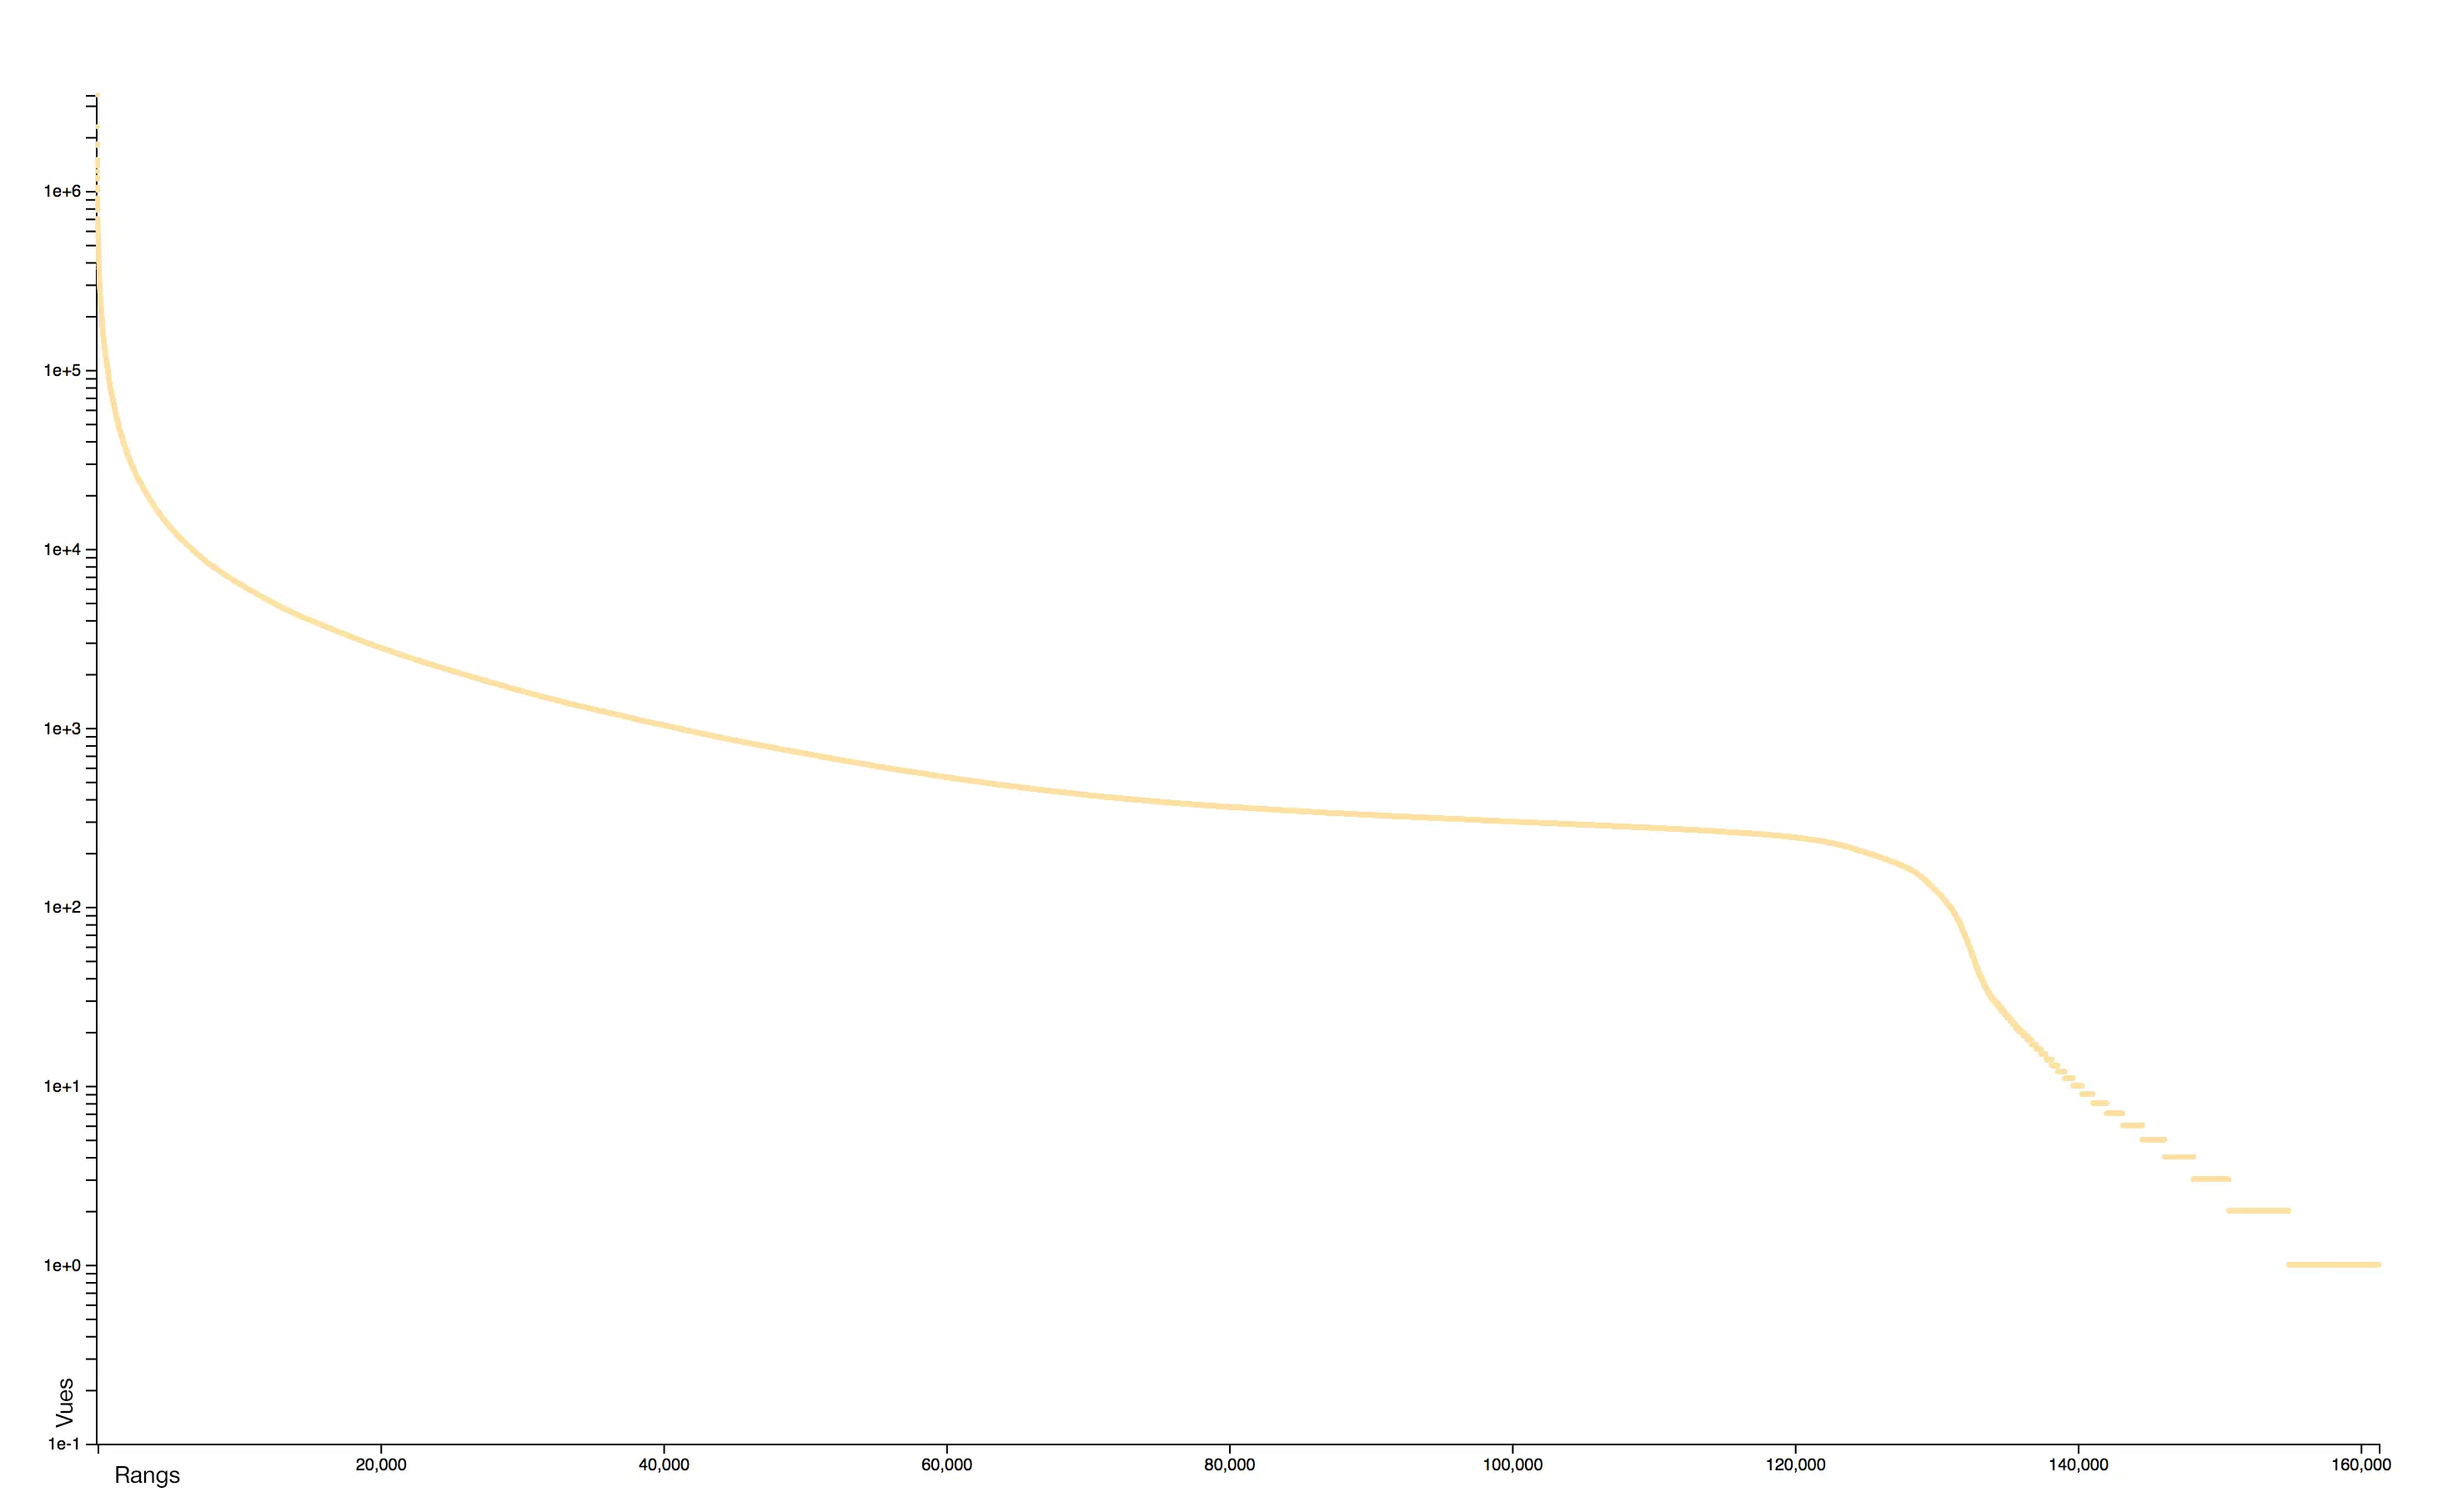
The distribution of consultations is particularly concentrated, with very few pages receiving practically all the attention. A logarithmic scale helps to identify two distinct sets: the rare pages that attract most of the collective attention and the rare pages, often newly created, that receive almost no interest.
Interaction 2008–2020 version
WikiMaps allows you to explore the world at all scales, in the thirty-eight main editions (languages) of Wikipedia and over the last thirteen years.
For a particular language and year, it is possible to have the list of the most consulted places and to visualise the daily evolution of the interest that they aroused.
The prototype has a dynamic mode which allows to visualise the evolution of the attention in the whole world in a particular edition.
Intertextuality 2016–2025 version
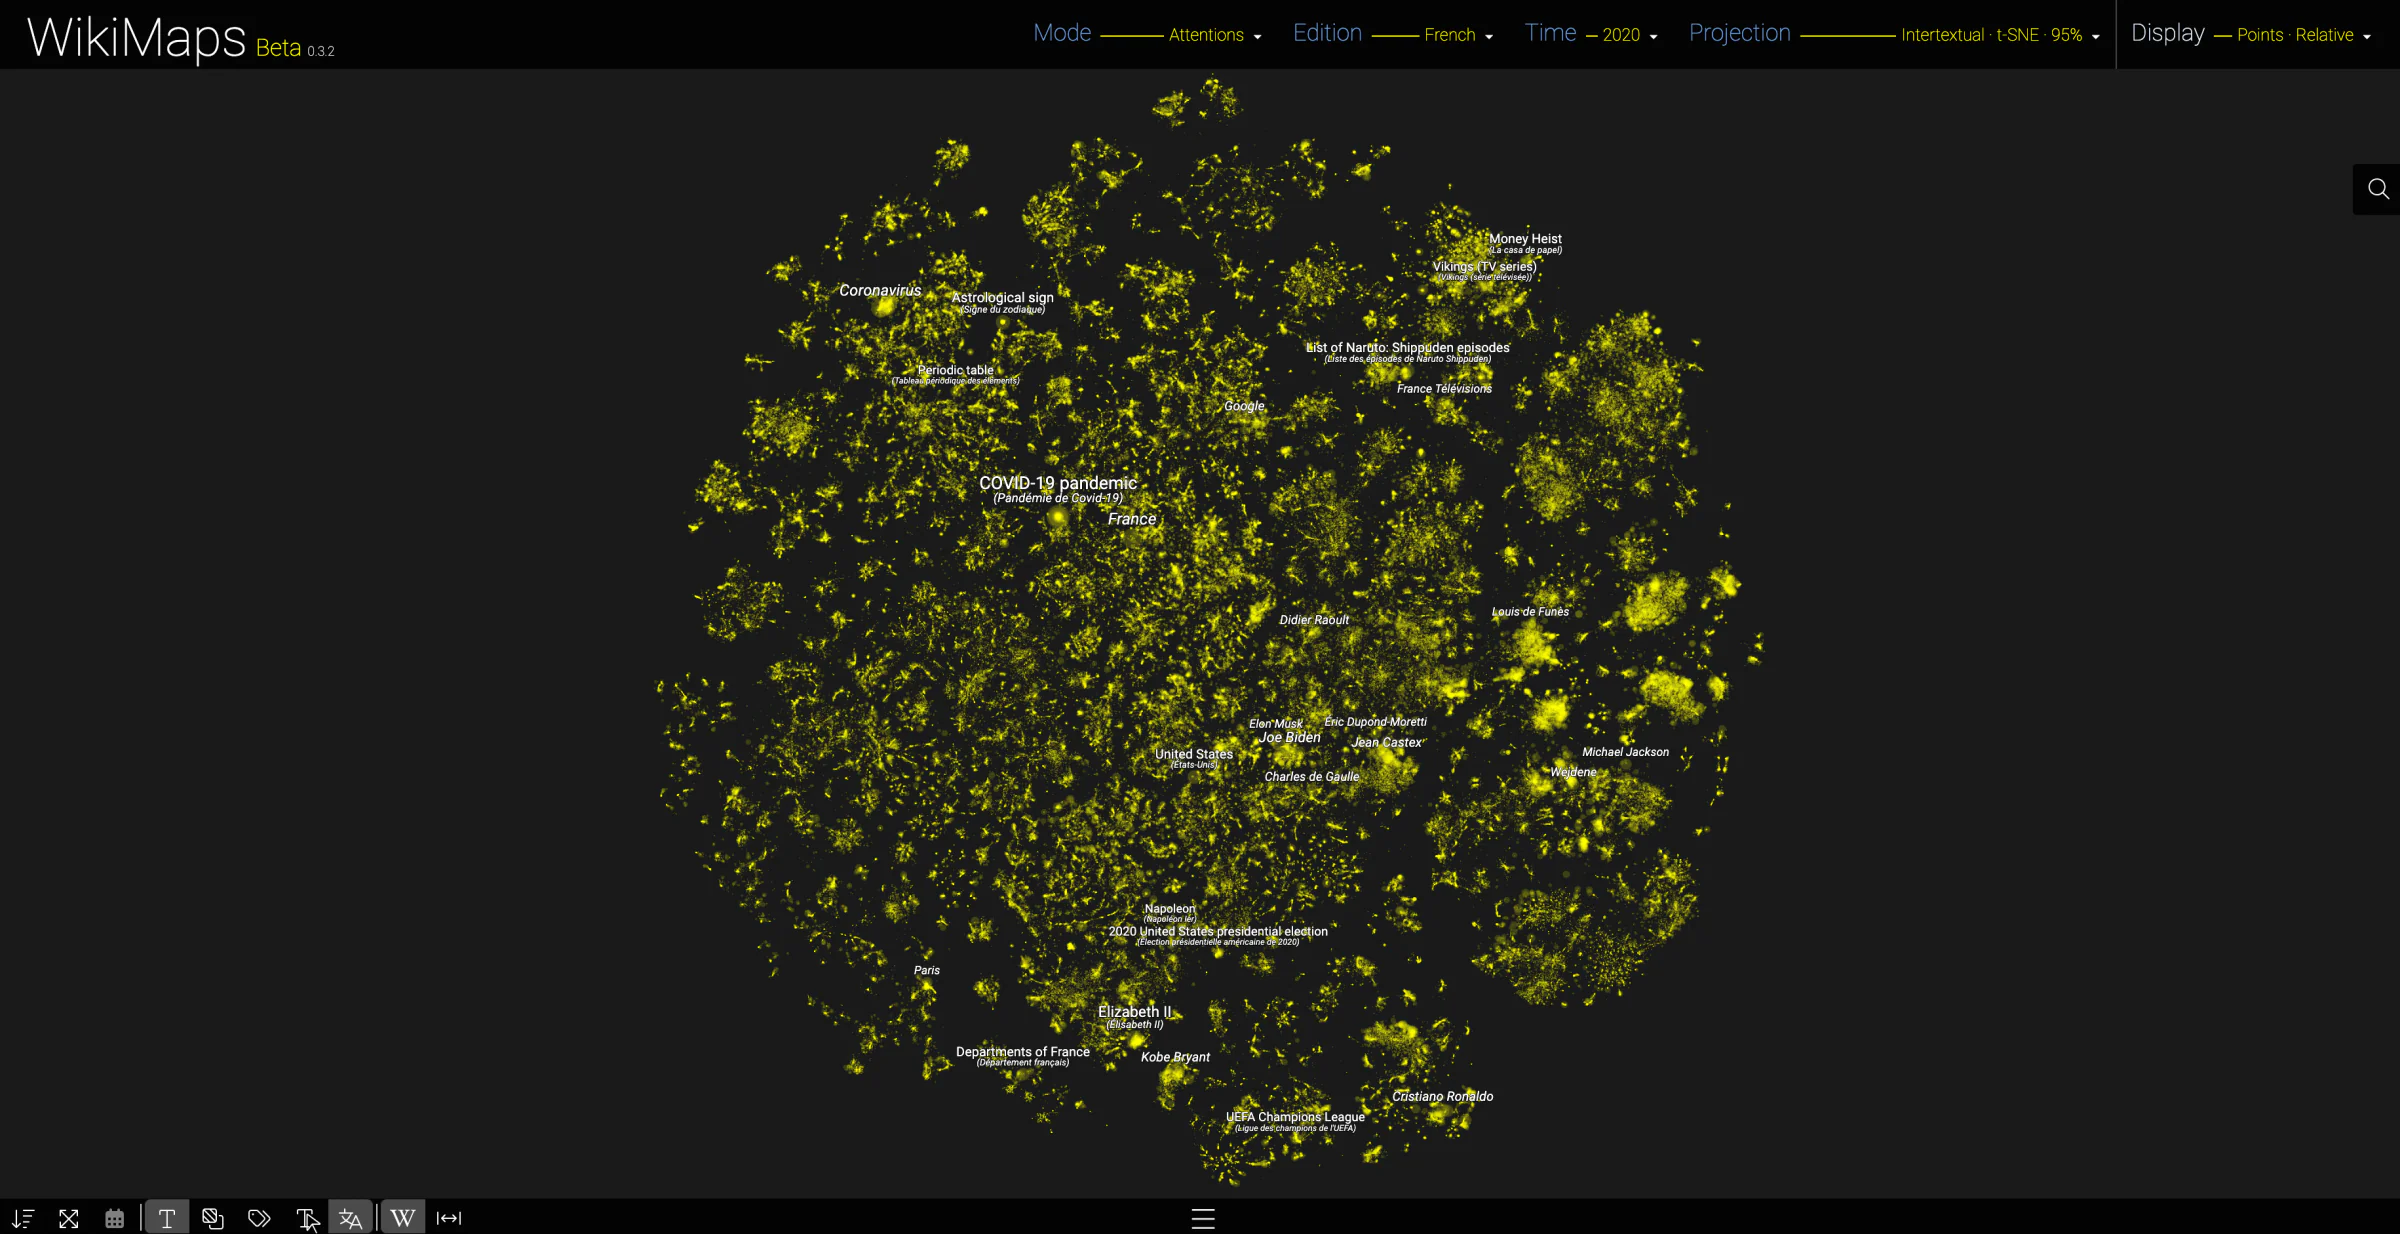
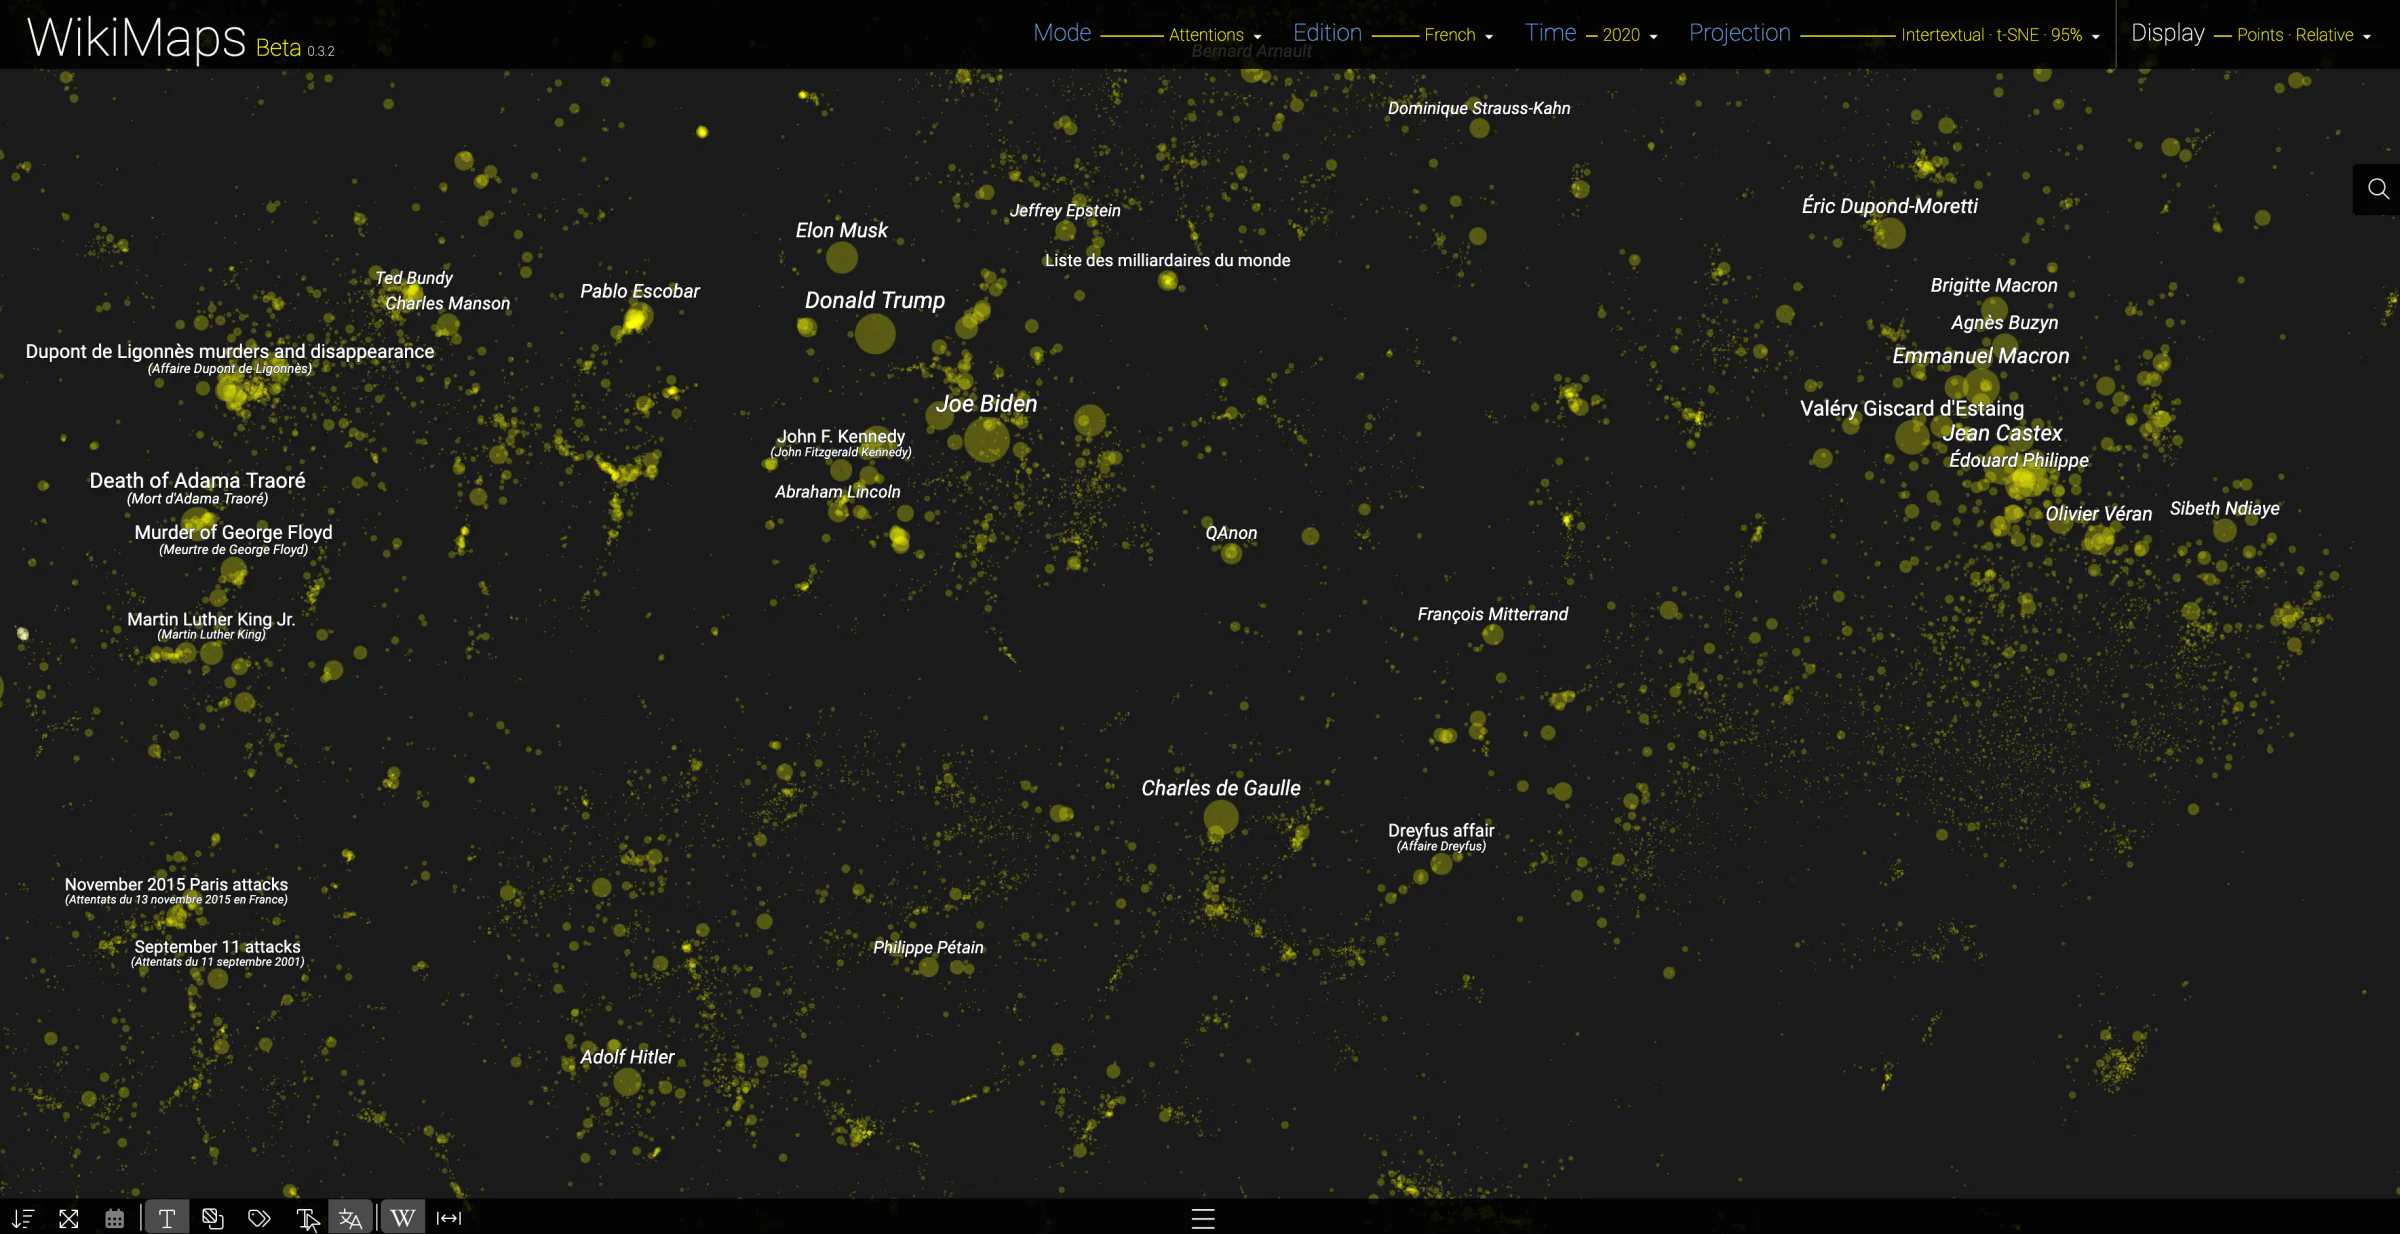
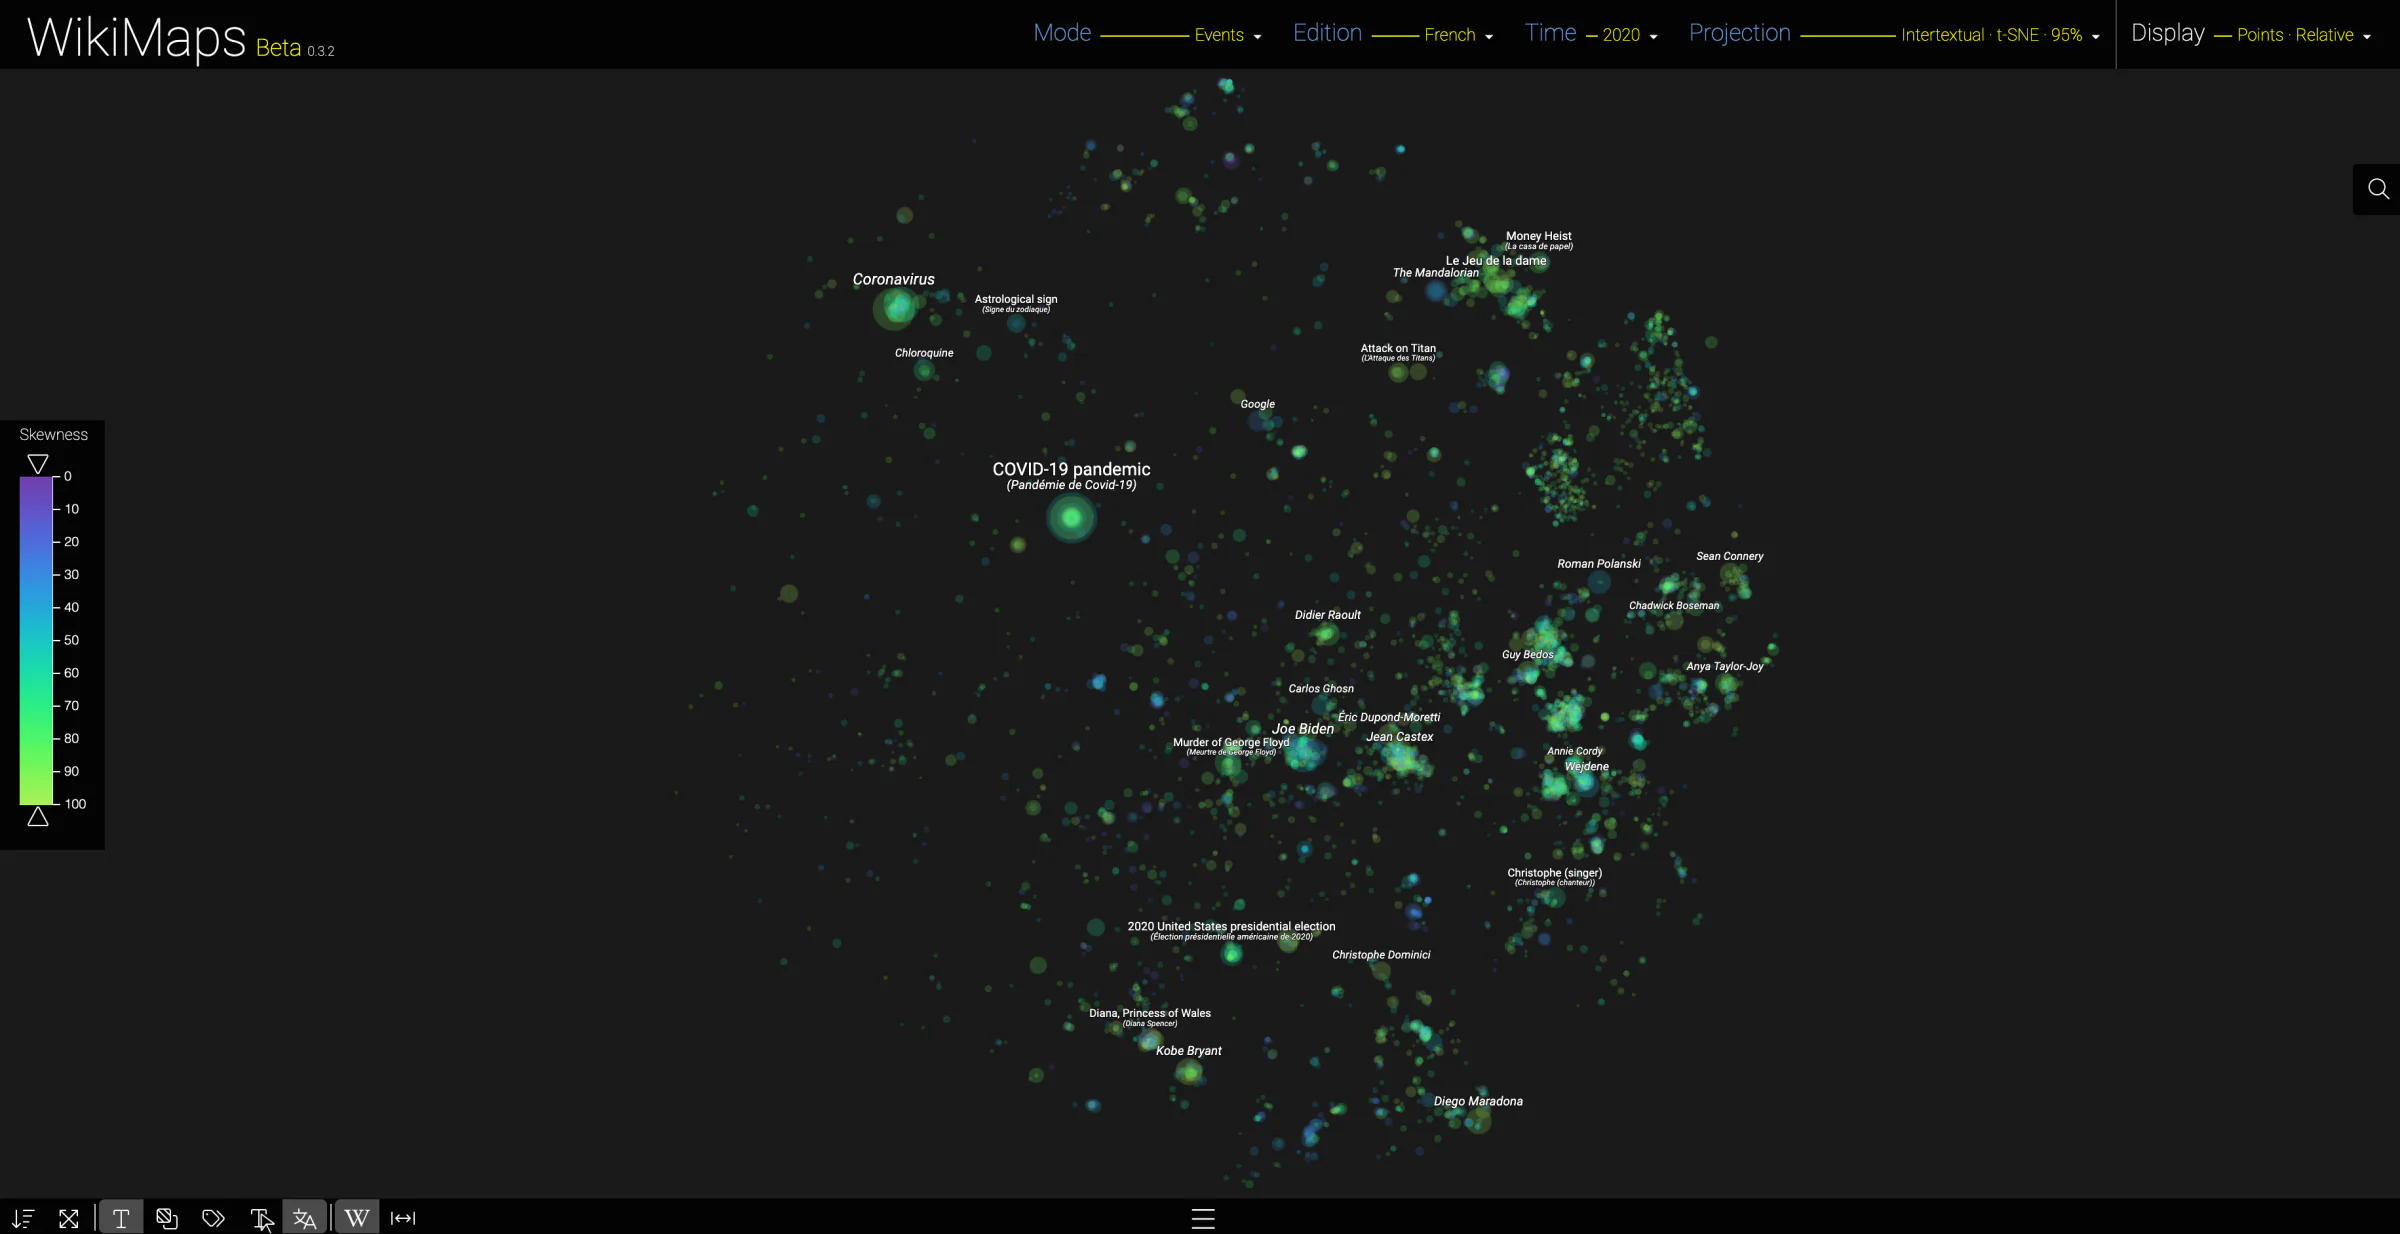
WikiMaps now also spatialises pages according to their content. The text of each page is turned into a vector by a language model (transformer), edition by edition, then these vectors are reduced to two dimensions (t-SNE or UMAP). Pages dealing with close subjects thus appear side by side, whatever their location, which makes it possible to map the attention paid to subjects that have no geographical coordinates: health, politics, history, cinema, music, sport...
In the French edition, in 2020, the COVID-19 pandemic stands out, as do French politics (Emmanuel Macron, Jean Castex, Olivier Véran), the American presidential election, criminal cases (the Dupont de Ligonnès affair, Ted Bundy) and history (Charles de Gaulle, the Dreyfus affair, Philippe Pétain). Titles can be displayed in English, with the original title just below.
In the Events mode, only the pages that aroused a sudden peak of attention remain: the pandemic and its controversies (Didier Raoult, chloroquine), the deaths of celebrities (Kobe Bryant, Diego Maradona, Sean Connery, Chadwick Boseman, Christophe) and the release of series (Money Heist, The Queen's Gambit, The Mandalorian). The colour indicates the asymmetry of each peak (skewness).
Hypertextuality 2016–2025 version
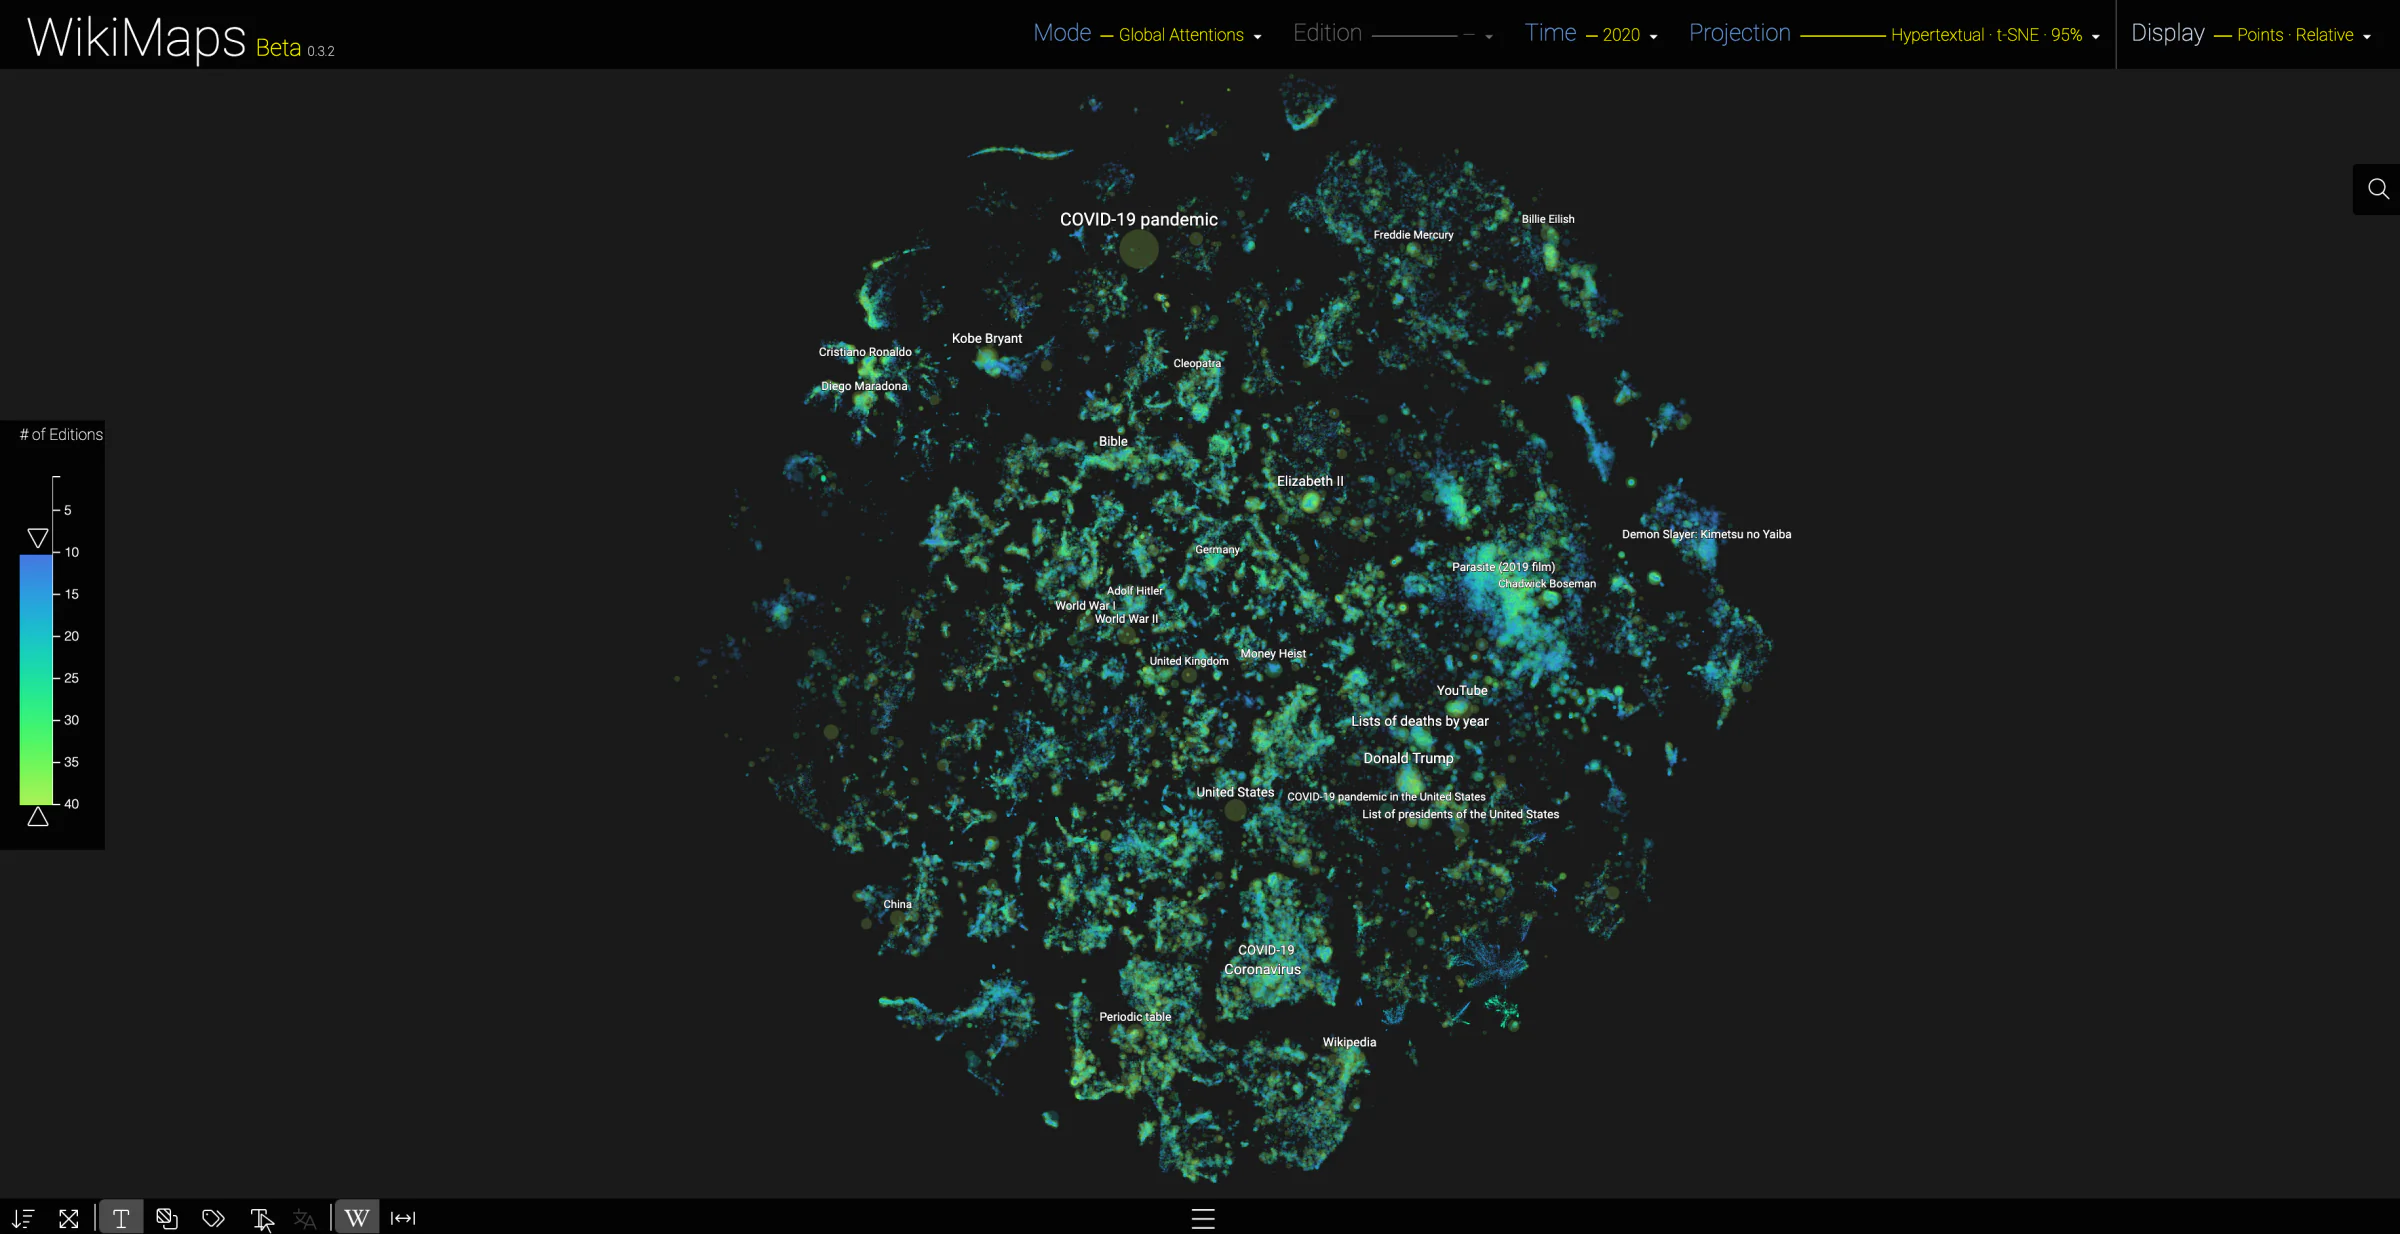
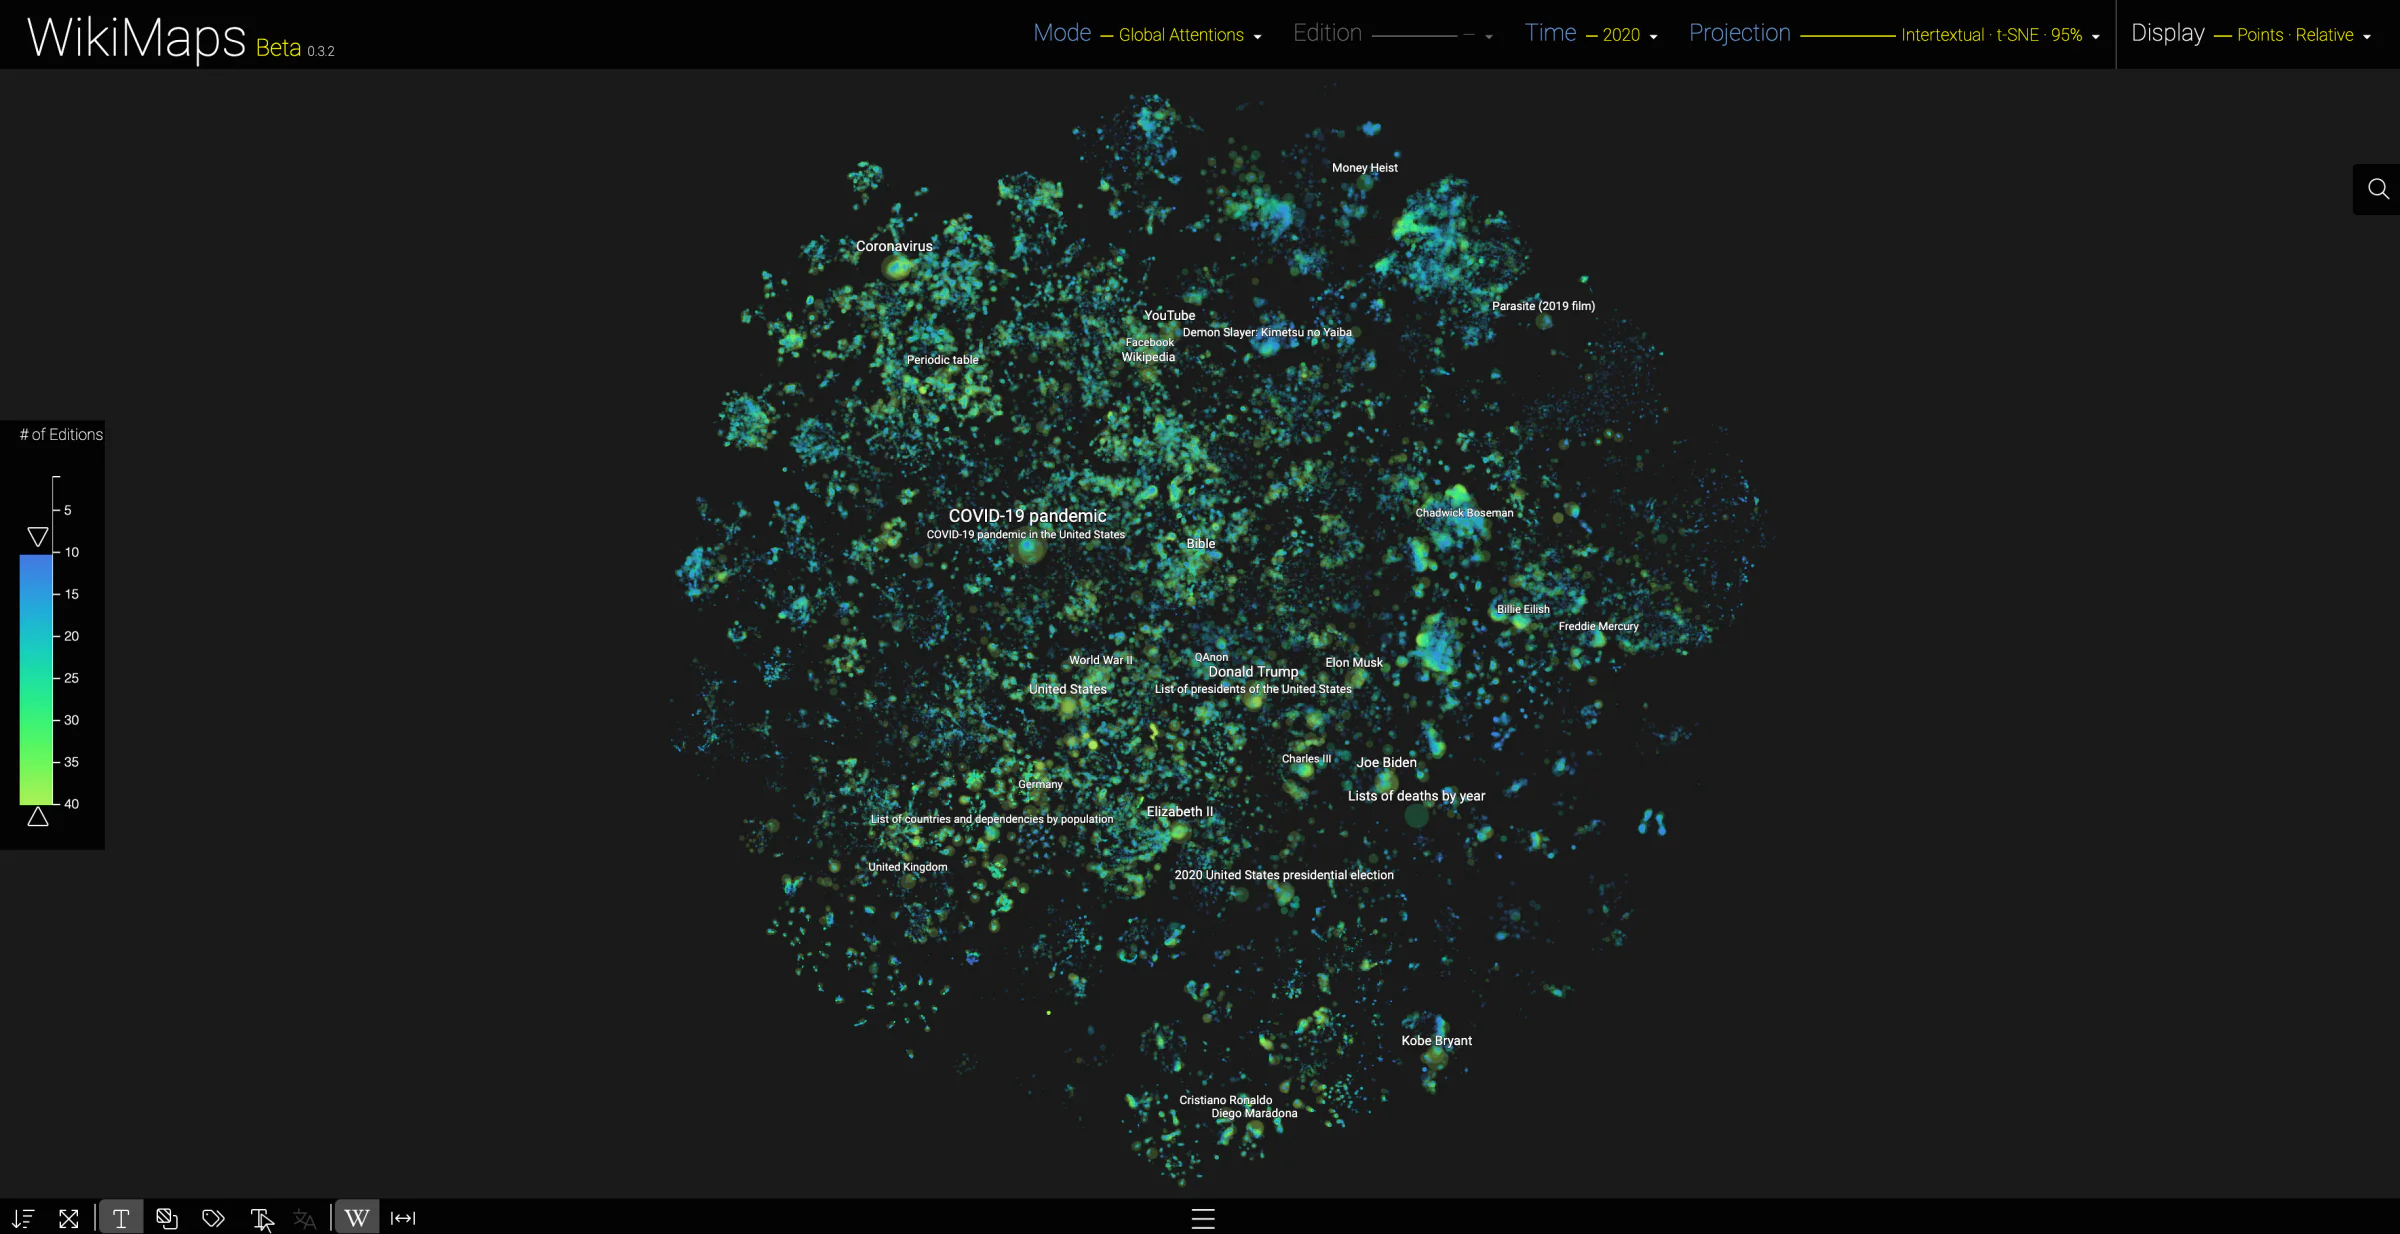
Pages can also be spatialised according to the hypertext links that connect them. The links written by contributors in the body of the articles form a vast network (those of navigation boxes, infoboxes and templates are left aside). Each page receives a position in this network (graph embedding), before the same reduction to two dimensions. Pages that link to each other, or to the same pages, thus appear close together, and pages without any link to the rest of the map are not shown.
The two spatialisations do not tell the same story. On the hypertextual map, the COVID-19 pandemic is far from the virus and the disease (Coronavirus, COVID-19), which are close to scientific pages such as the periodic table, whereas the intertextual map brings them together. Hypertextuality is closer to the structure of the encyclopaedia, intertextuality to the proximity of its contents.
Globality 2016–2025 version
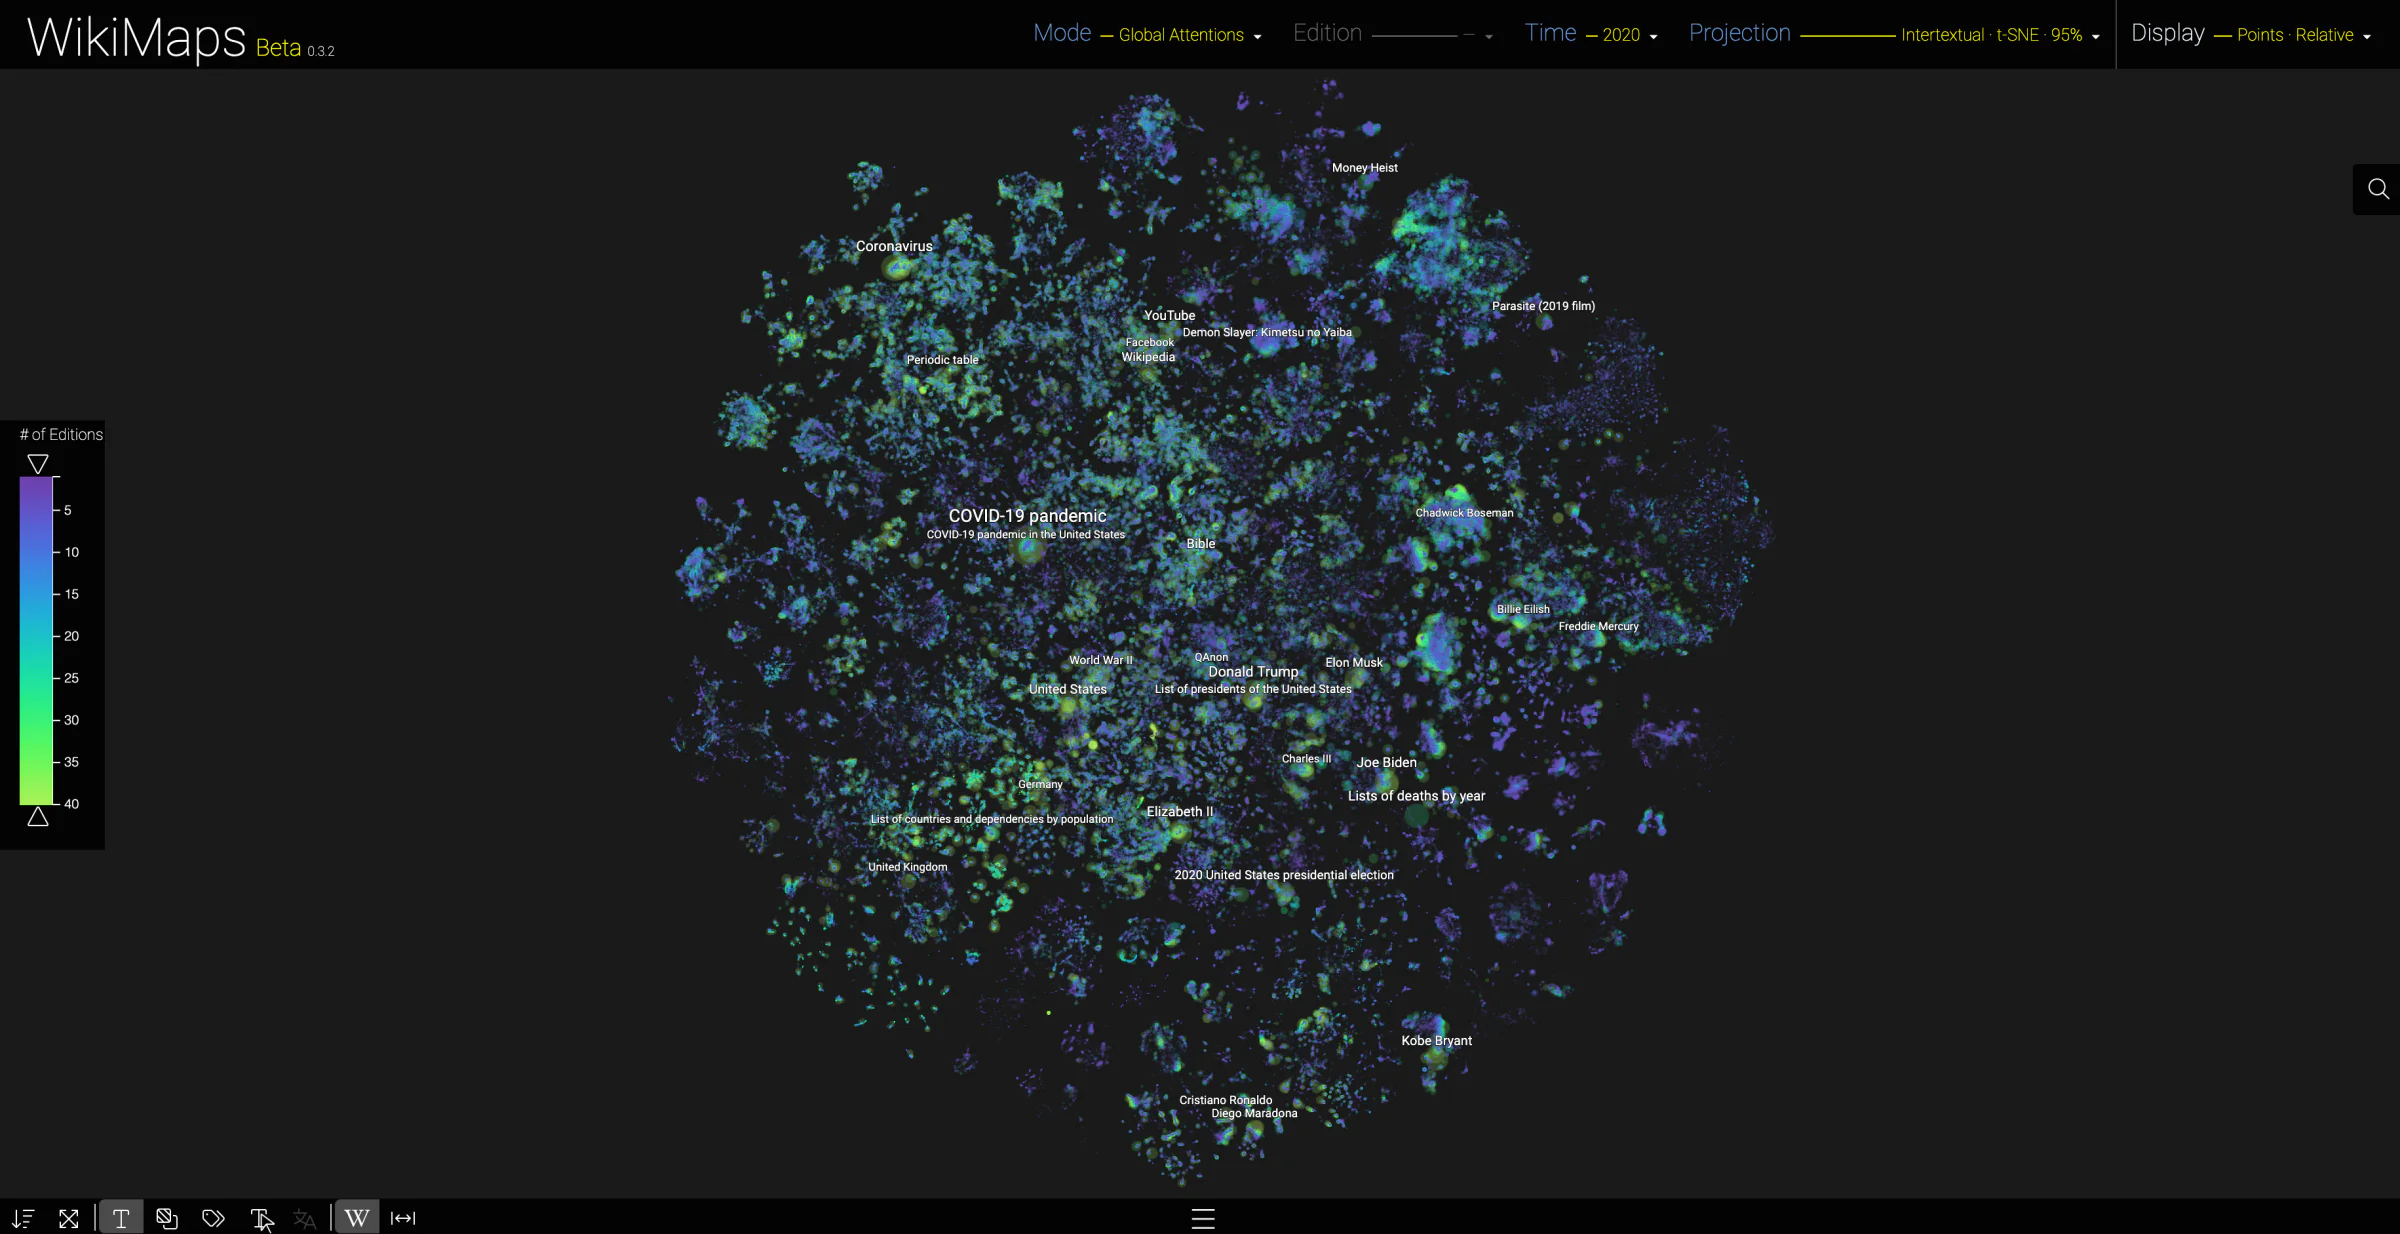
2020 - Intertextual (t-SNE, 95%) - Global attentions - no filter
2020 - Intertextual (t-SNE, 95%) - Global attentions - 10 editions and more
The Global attentions mode adds up the pageviews of each page in the 40 editions, and colours it according to its globality, that is to say the number of editions that share a peak of attention for this page, from purple (a few editions) to green (up to 40 editions). The setting on the left of the map keeps only the pages shared by a minimum number of editions: from 10 editions onwards, the pages that interest only a few languages disappear, and the most globalised attention remains: the pandemic, Donald Trump and the American election, Elizabeth II, Kobe Bryant, Parasite, YouTube or Wikipedia itself.
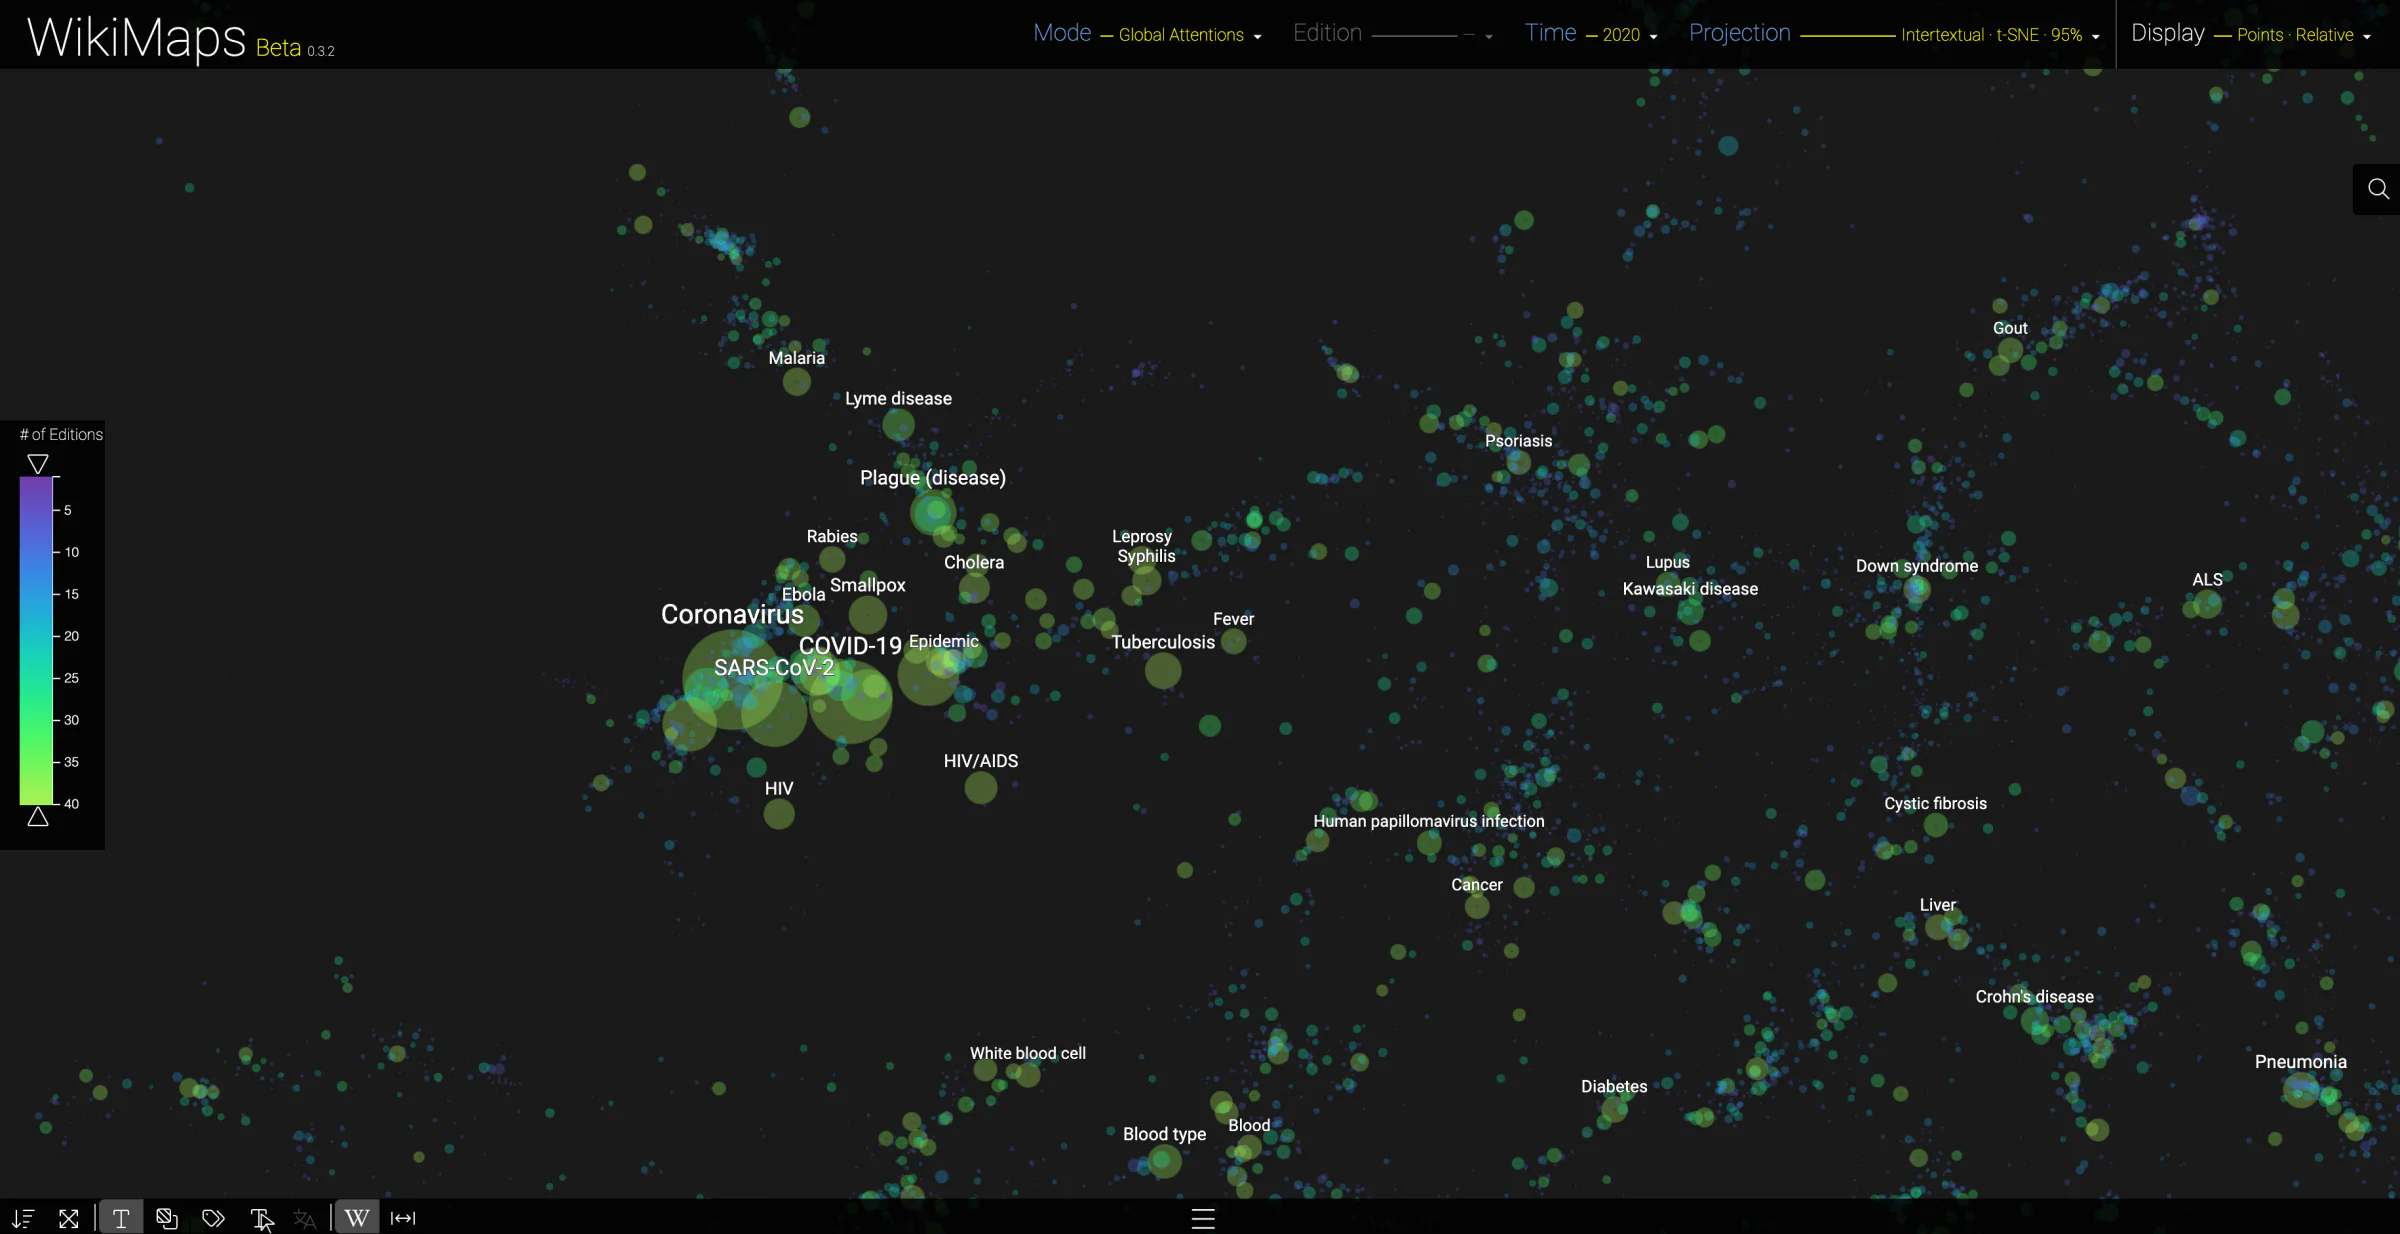
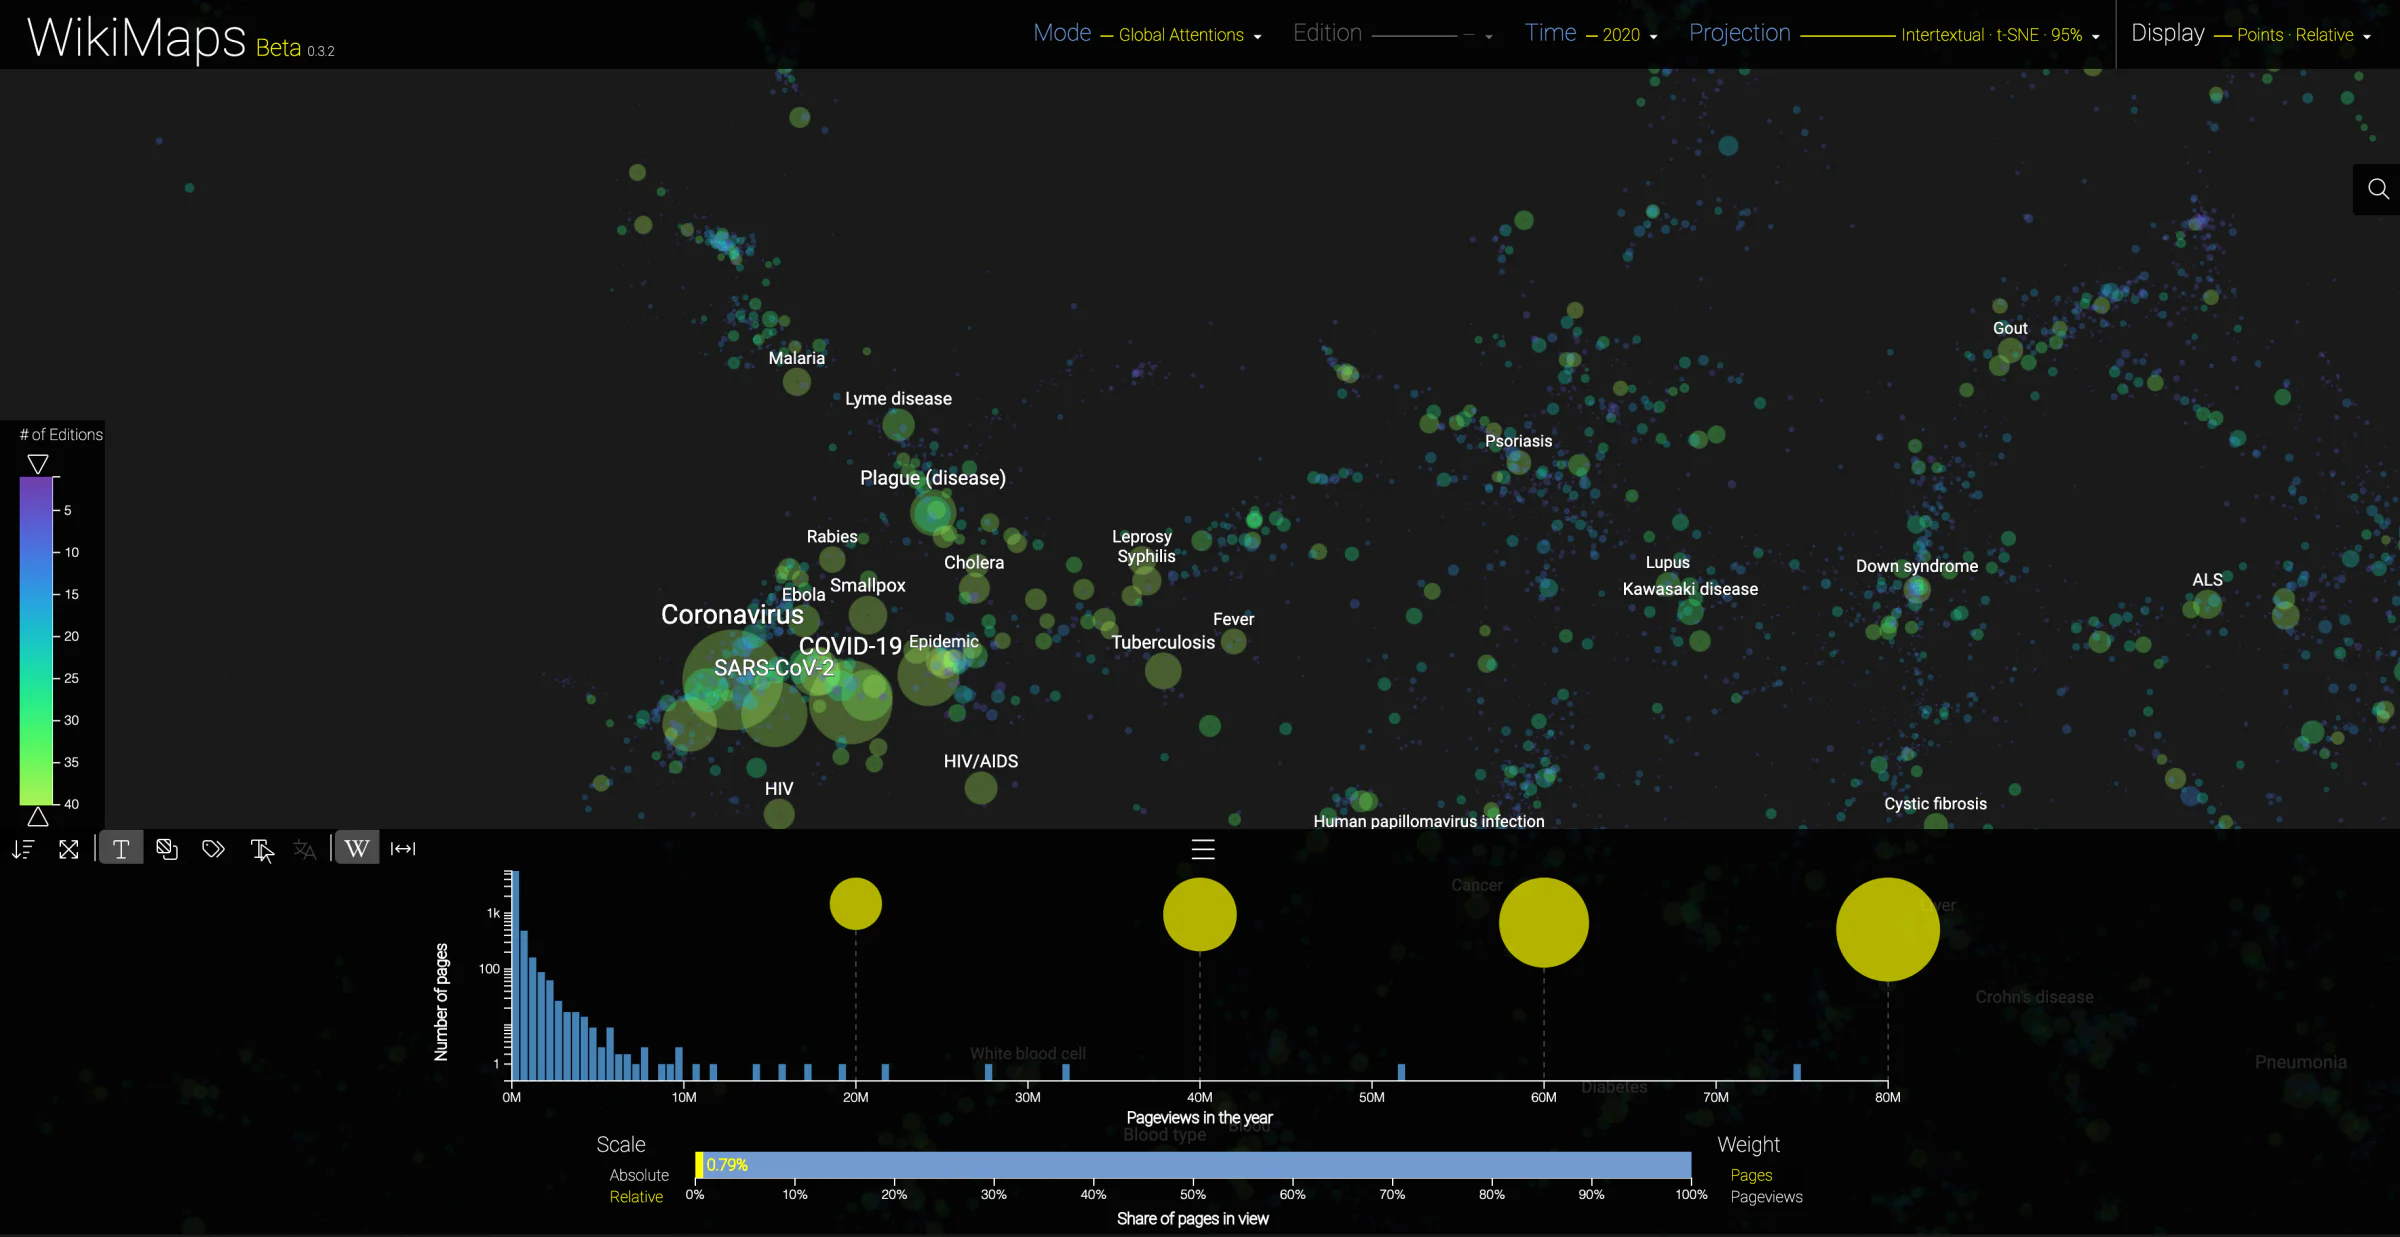
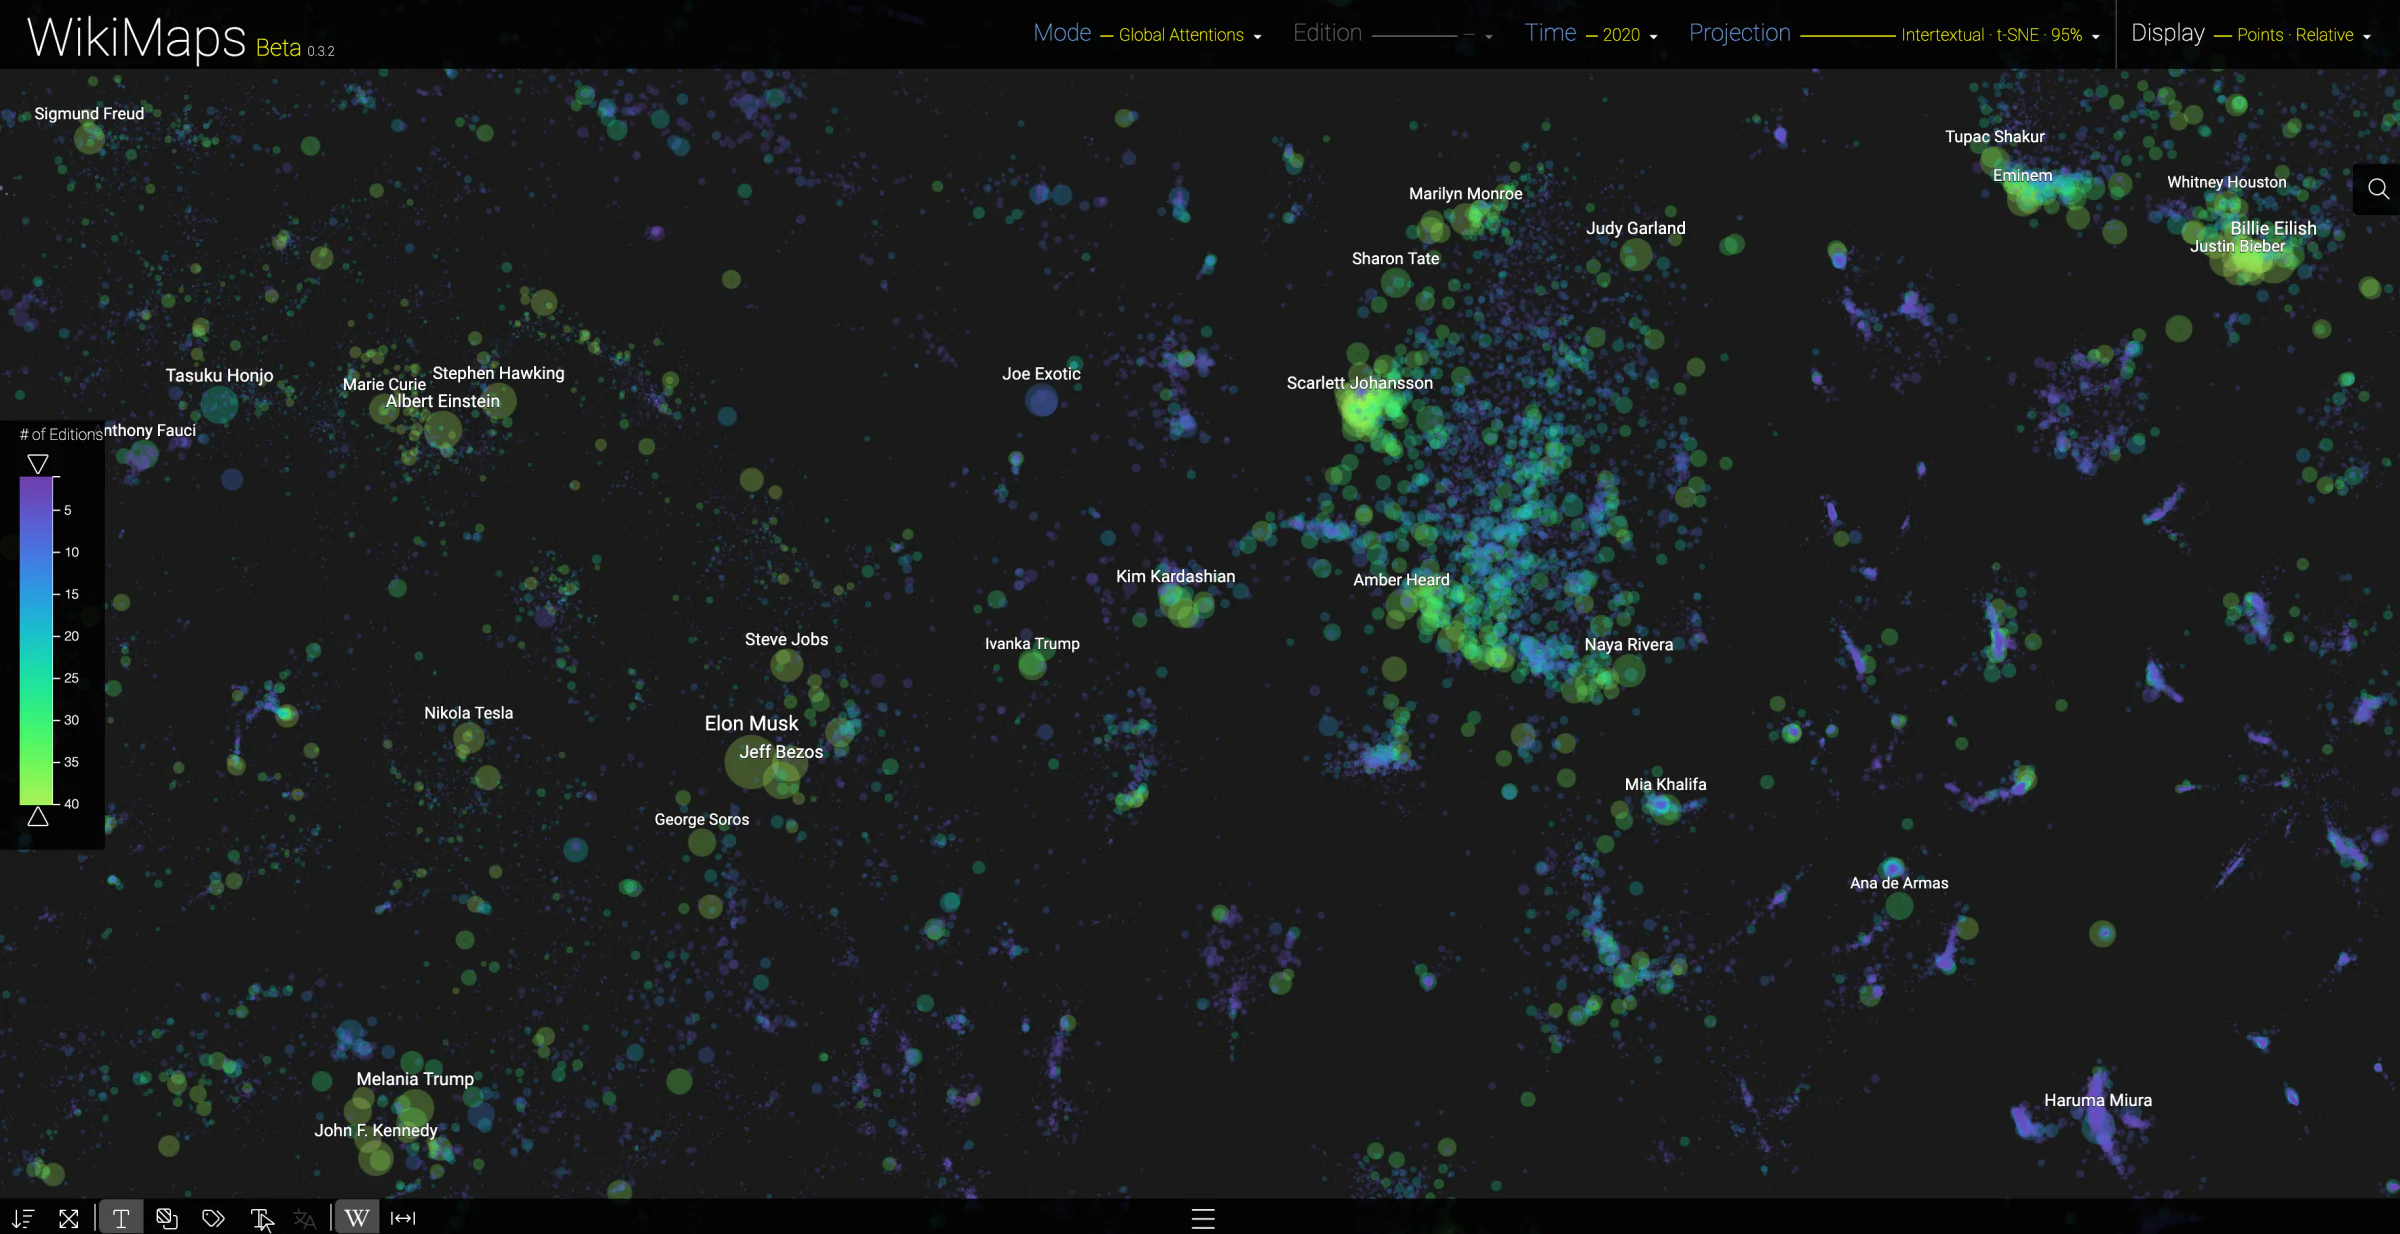
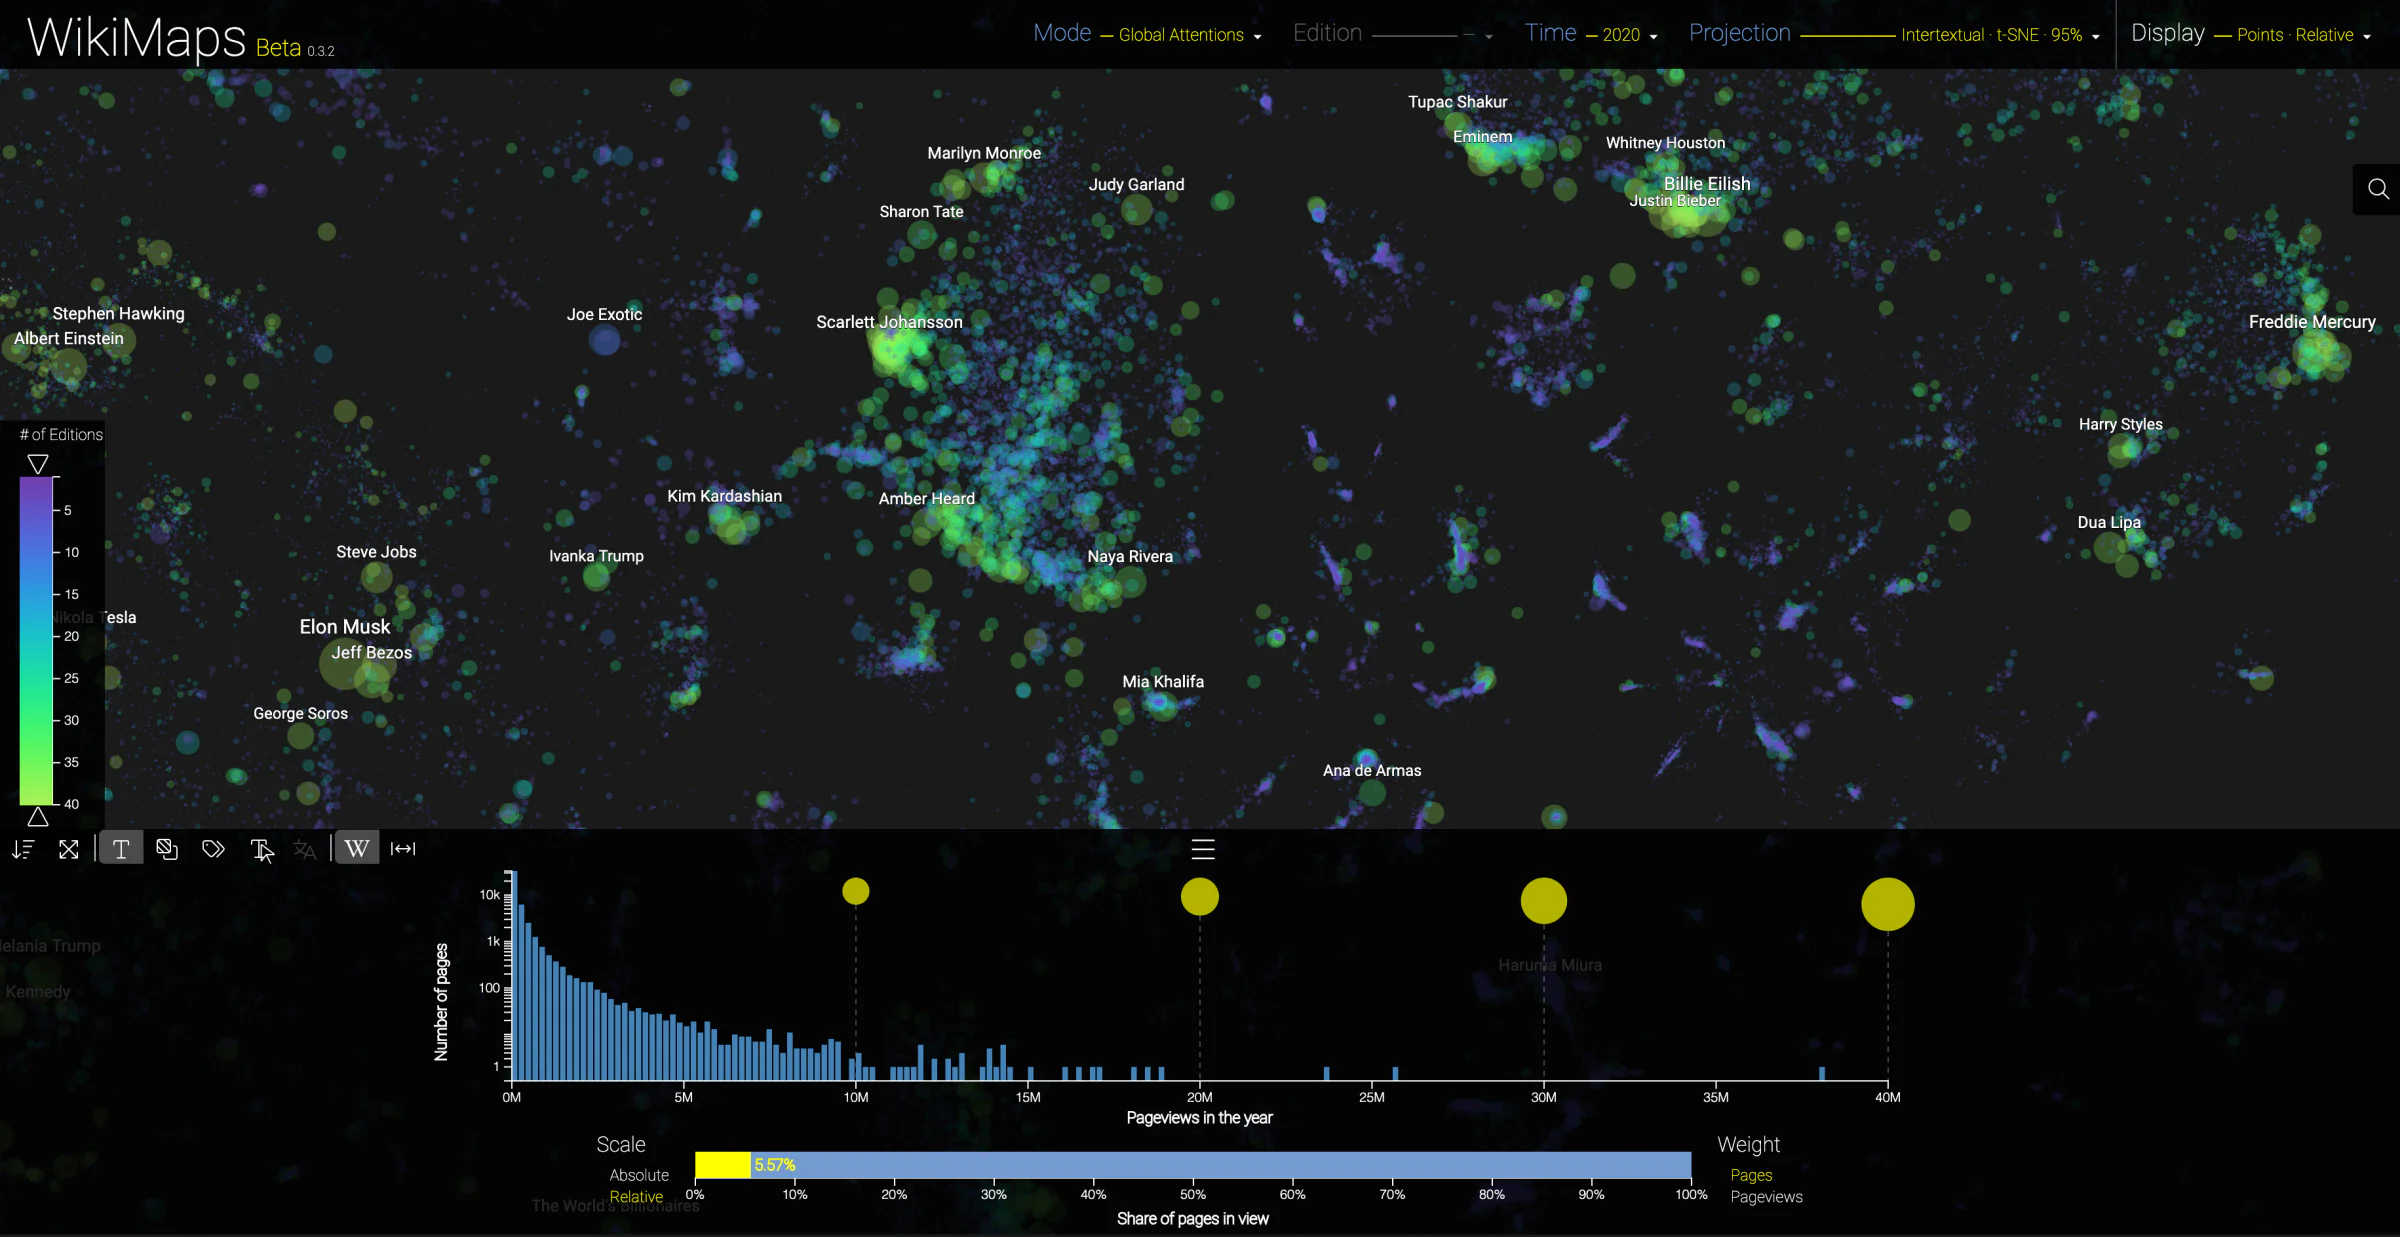
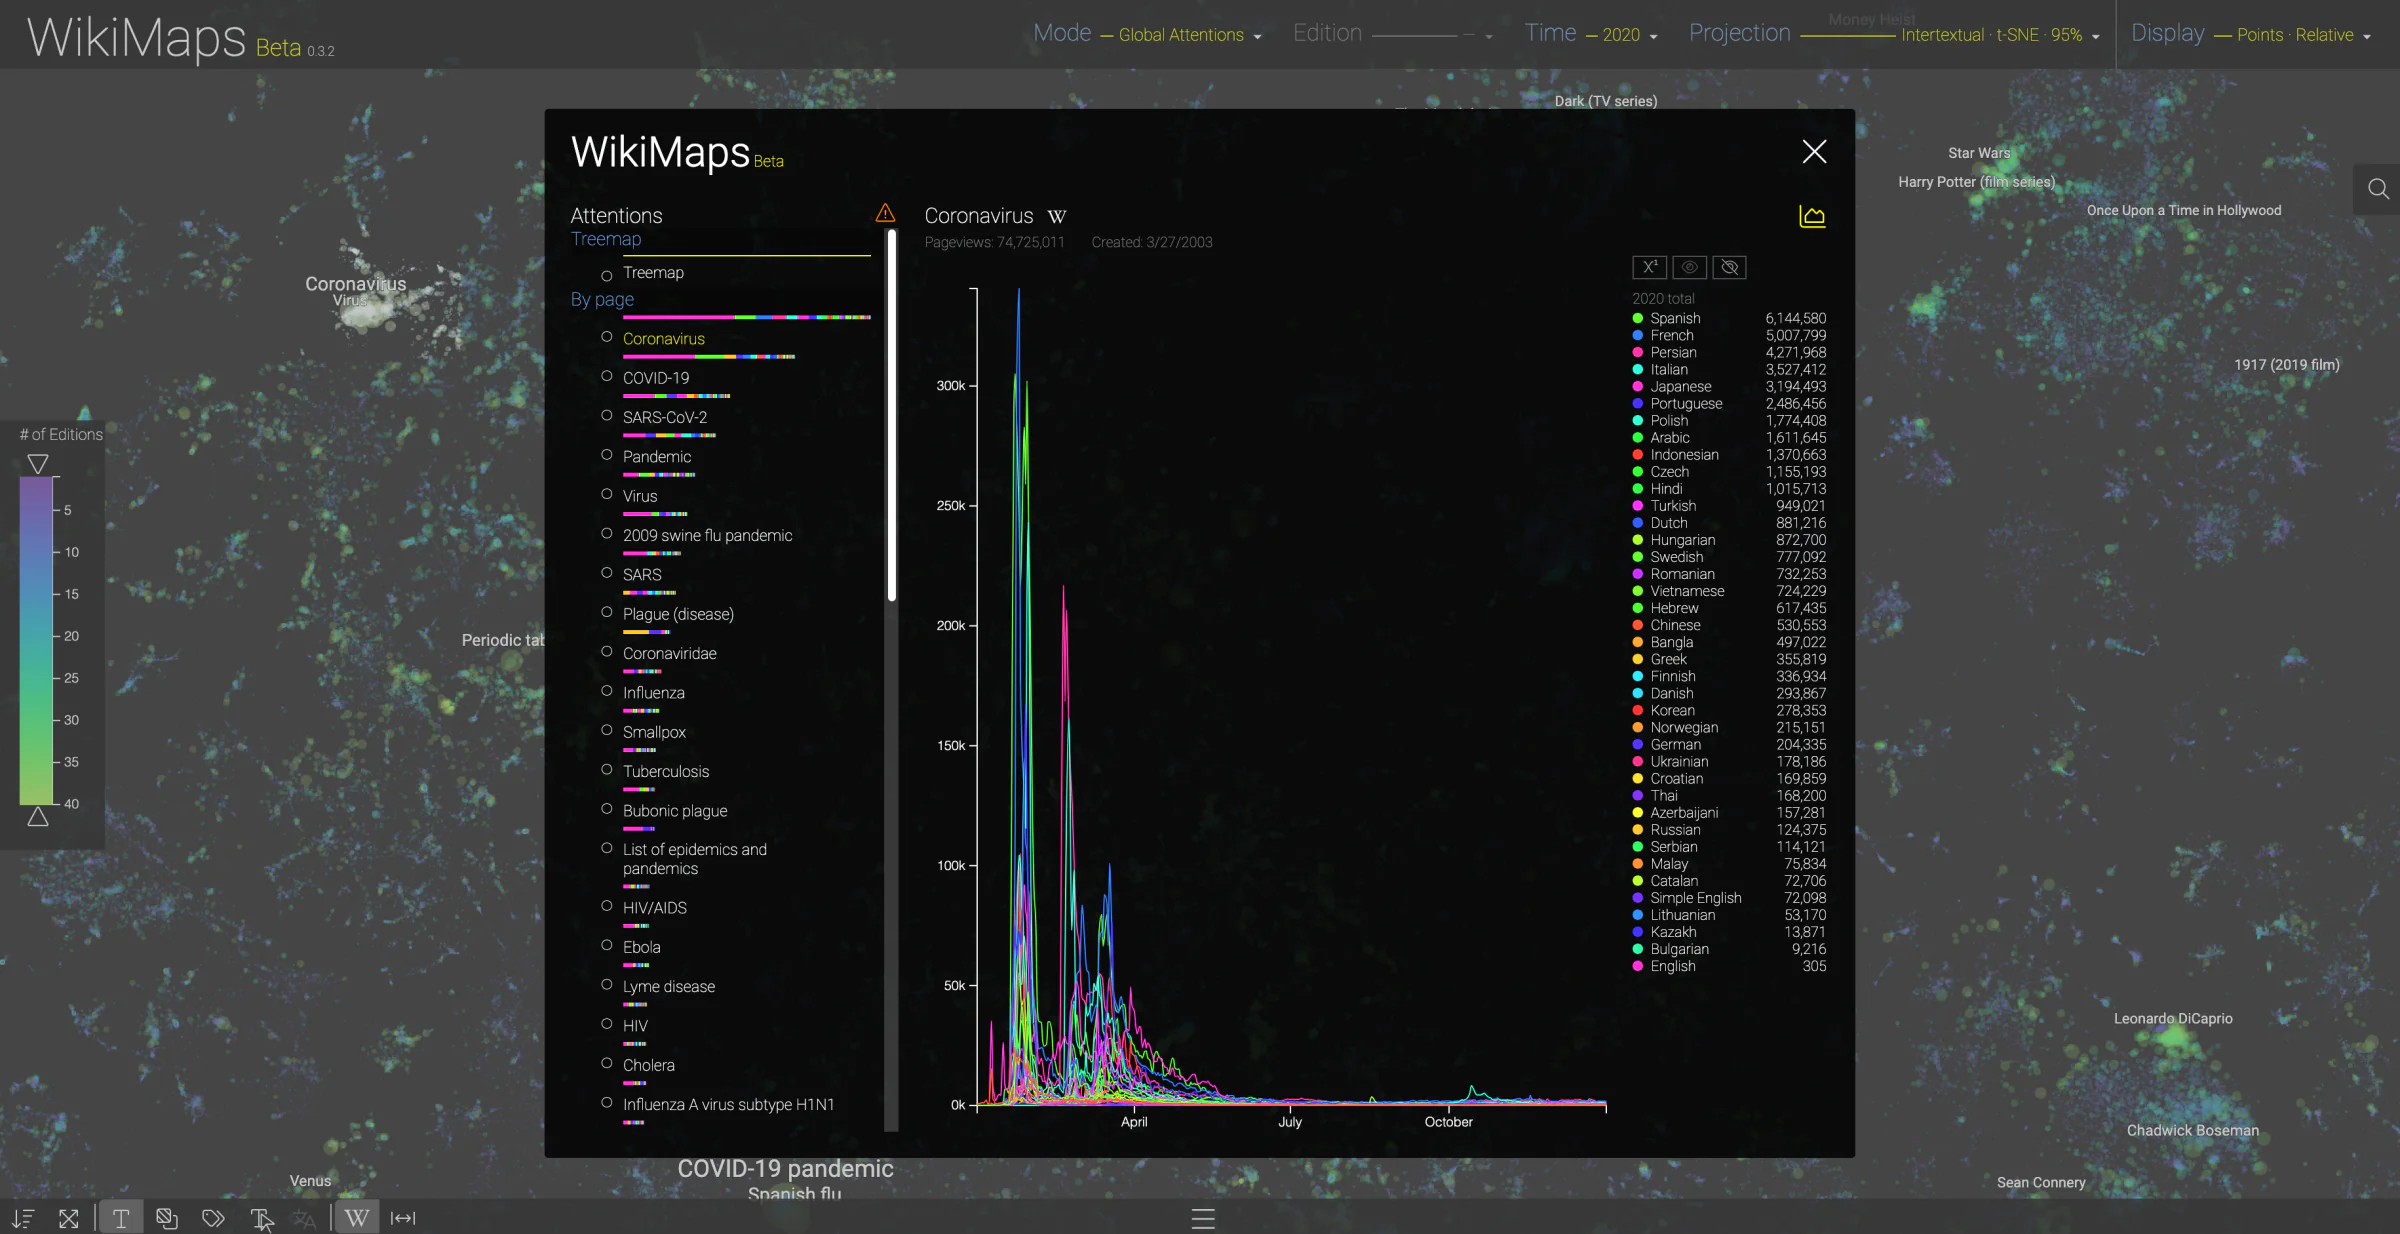
As with the geographical maps, it is possible to zoom on any area. Health is one of the most striking in 2020: Coronavirus, COVID-19 and SARS-CoV-2 sit alongside the great epidemics (plague, cholera, smallpox, Ebola, HIV/AIDS). The distribution panel, at the bottom of the screen, gives the share of the pages in view: 0.79% here, against 5.57% for the area of personalities, from Albert Einstein and Marie Curie to Elon Musk, Scarlett Johansson or Billie Eilish.
Selecting pages opens a dashboard, with the list of the selected pages and the daily pageviews of each edition. For Coronavirus, attention peaked at the end of January 2020 in most editions, then again in February and March, with a timing that differs from one language to another.
The methods behind these maps, and the evolution of WikiMaps, are presented on the methodology page.