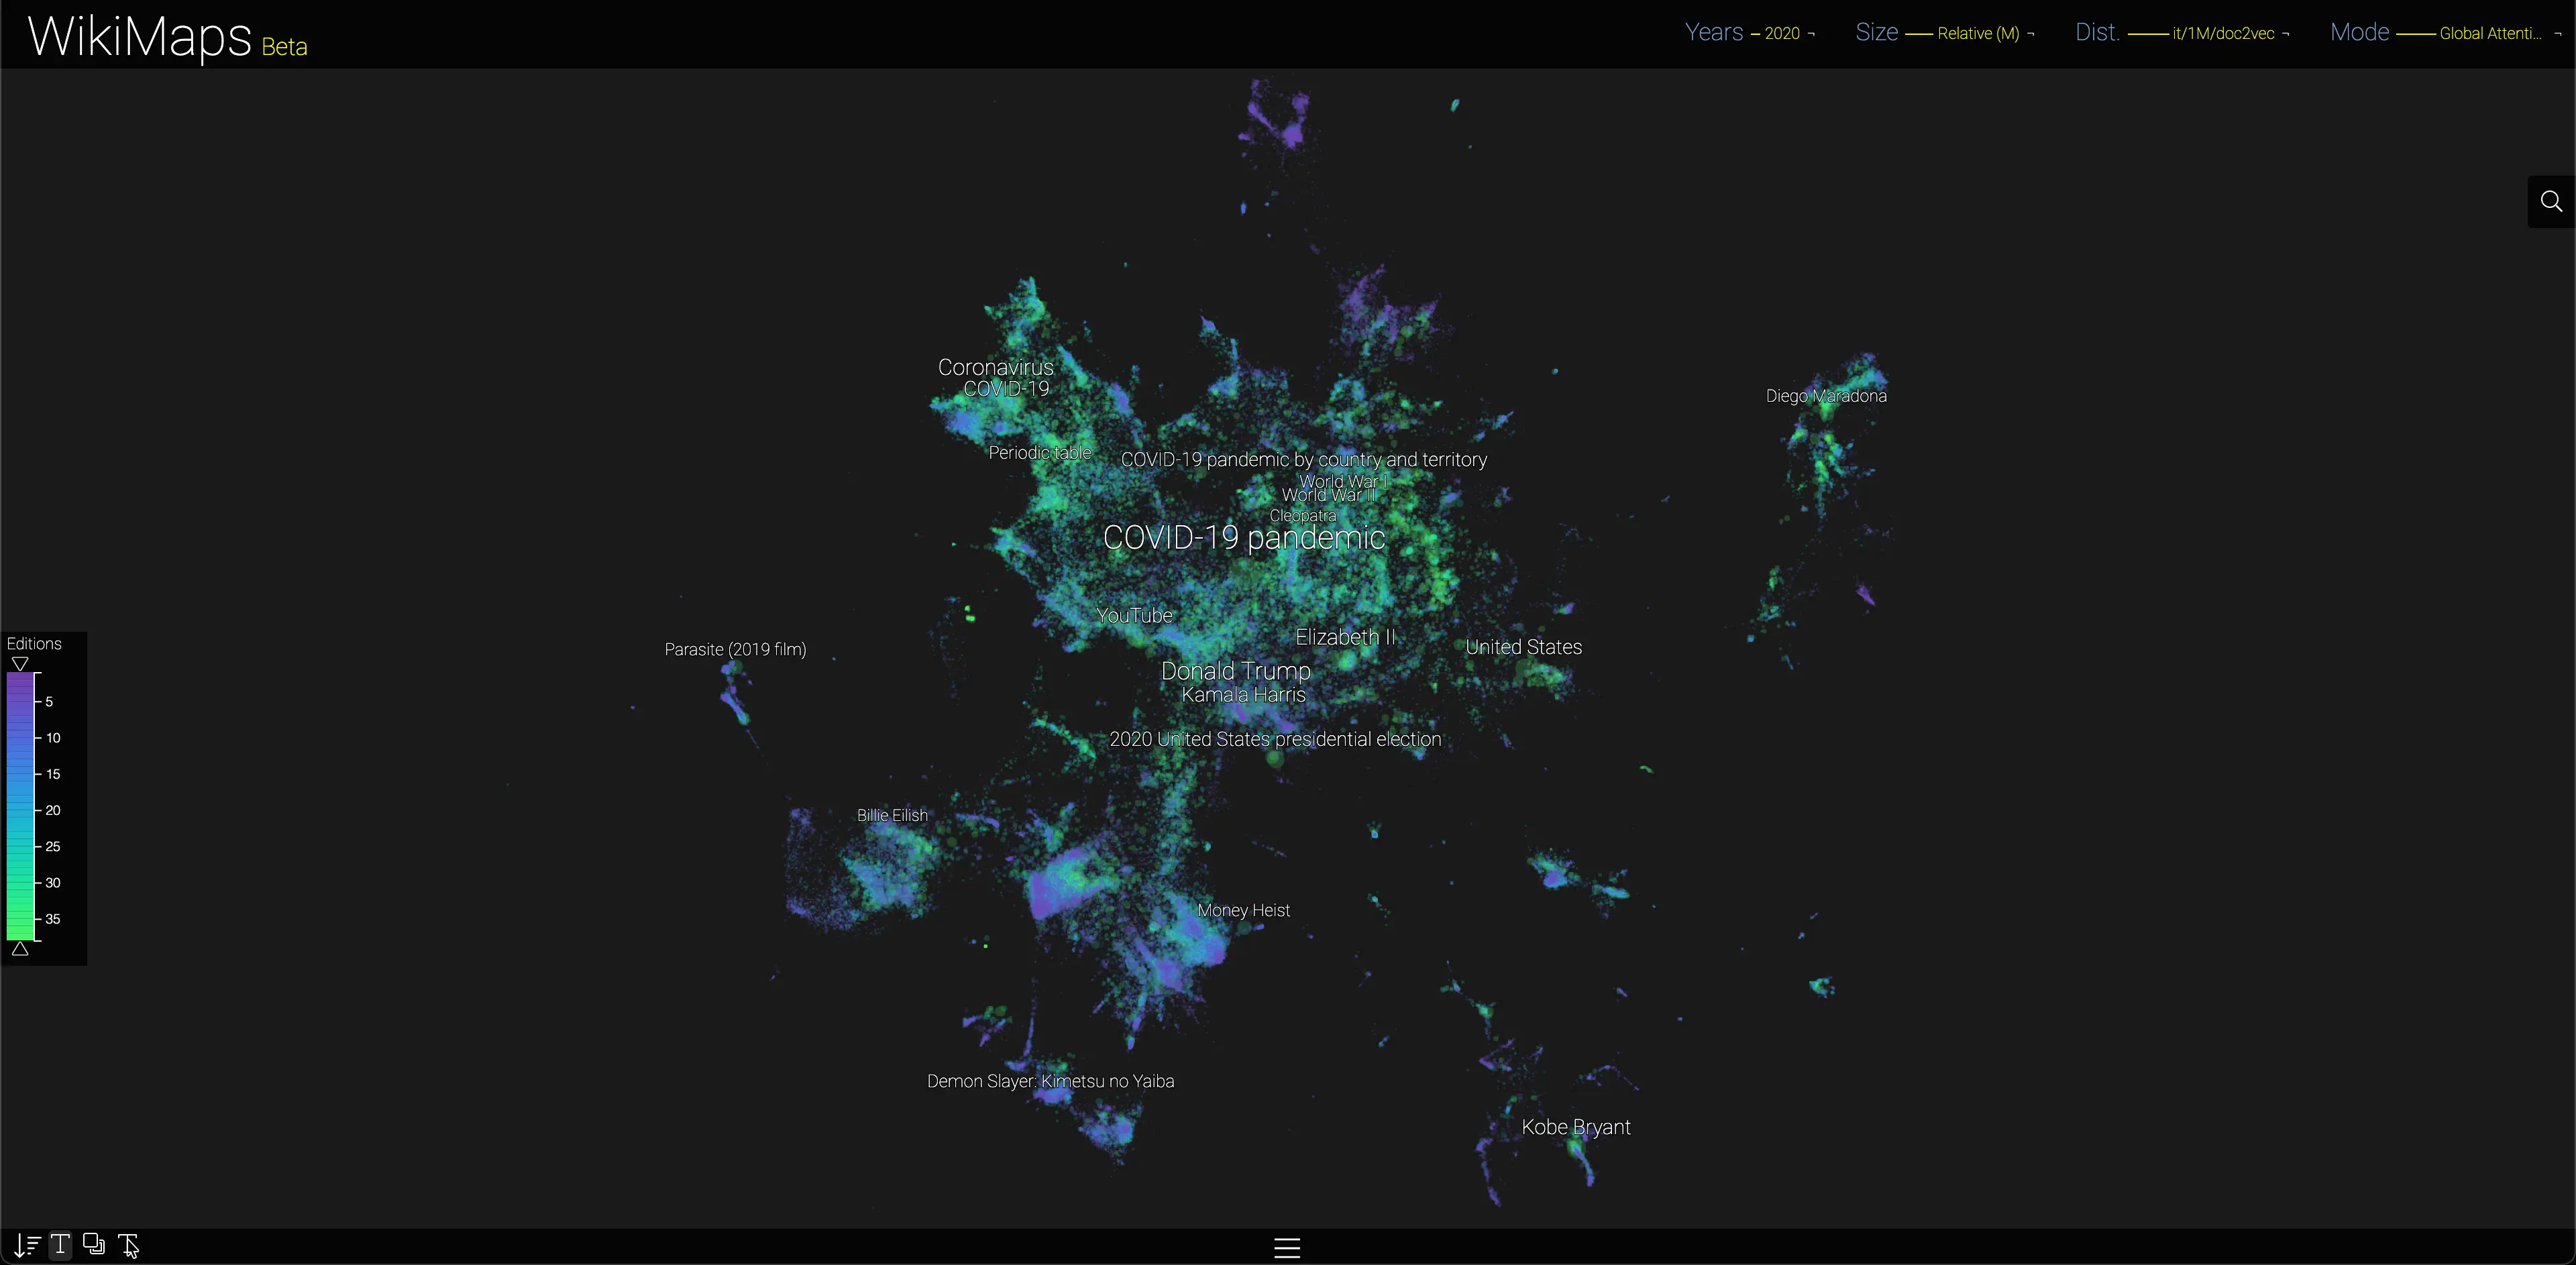
Interface 2008–2020 version
This page presents the methodology of the previous version of WikiMaps, whose data cover the years 2008 to 2020. Its principles remain valid, but the data, the methods and the interface have since been renewed: the current version (2016-2025) is presented in the Update section, at the bottom of the page. This page is also available in French.
WikiMaps offers a clean interface which nevertheless includes many refinements. The interface was designed to explore the potential of WikiMaps in a simple, intuitive, precise and detailed way. Its principle is based on the combination of elementary choices, as so many points of view on a single issue: the exploration of the unequal attention paid to Wikipedia pages and its evolution over time.
Editions
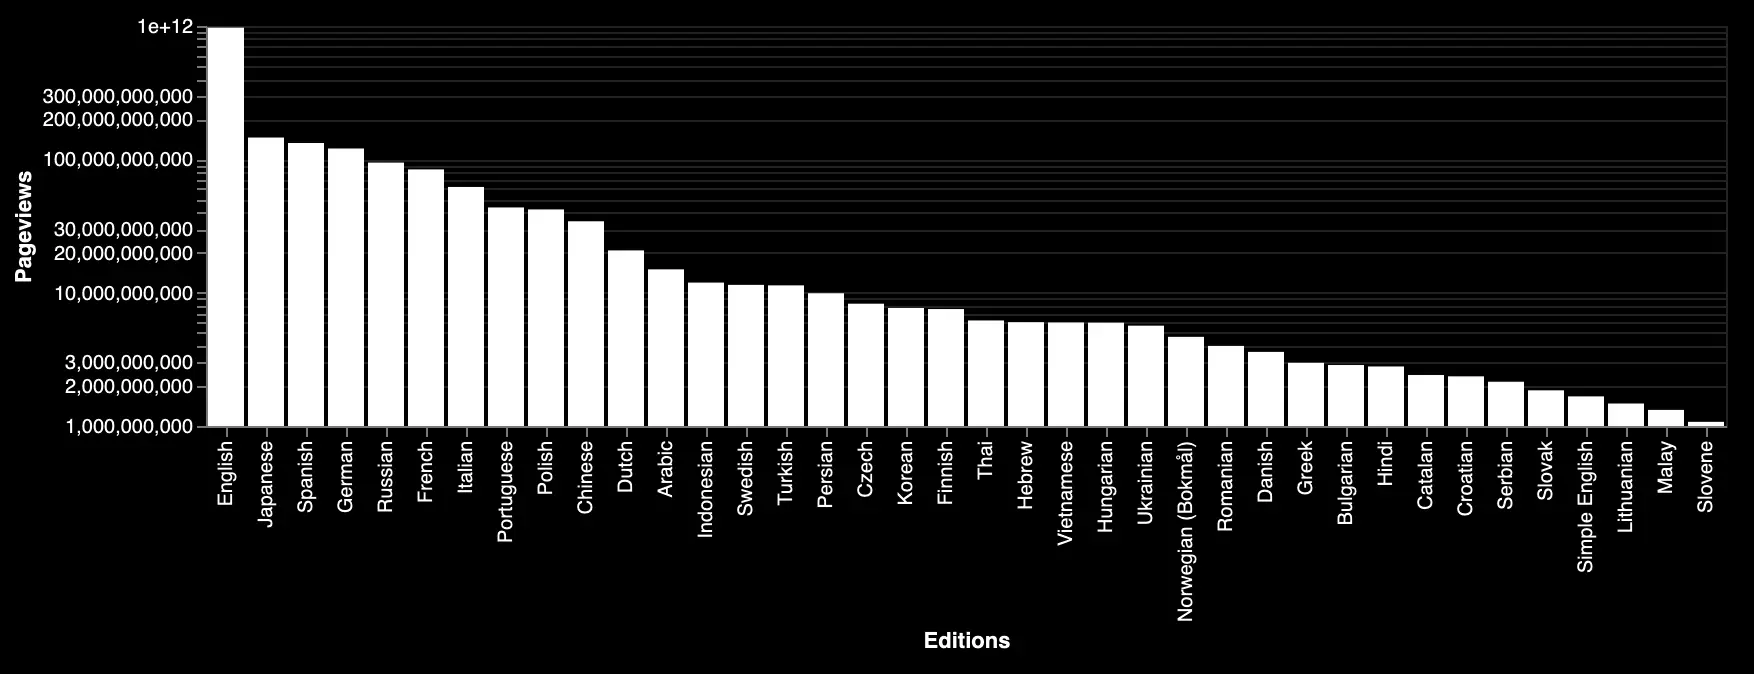
WikiMaps makes it possible to explore the pageviews of the different editions of Wikipedia in the 38 most used languages. These 38 languages account for 99% of all pages viewed on Wikipedia. The other 262 editions account for only 1% of views. As WikiMaps explores collective attention, we chose to focus on the most representative languages and to avoid the problems inherent in rarely viewed editions, which are much more sensitive to interference (server problems, bots, manipulation…).
The 38 editions selected are: Arabic, Bulgarian, Catalan, Czech, Danish, German, Greek, English, Spanish, Persian, Finnish, French, Hebrew, Hindi, Croatian, Hungarian, Indonesian, Italian, Japanese, Korean, Lithuanian, Malay, Dutch, Norwegian (Bokmål), Polish, Portuguese, Romanian, Russian, Simple English, Slovak, Slovene, Serbian, Swedish, Thai, Turkish, Ukrainian, Vietnamese, Chinese
Years
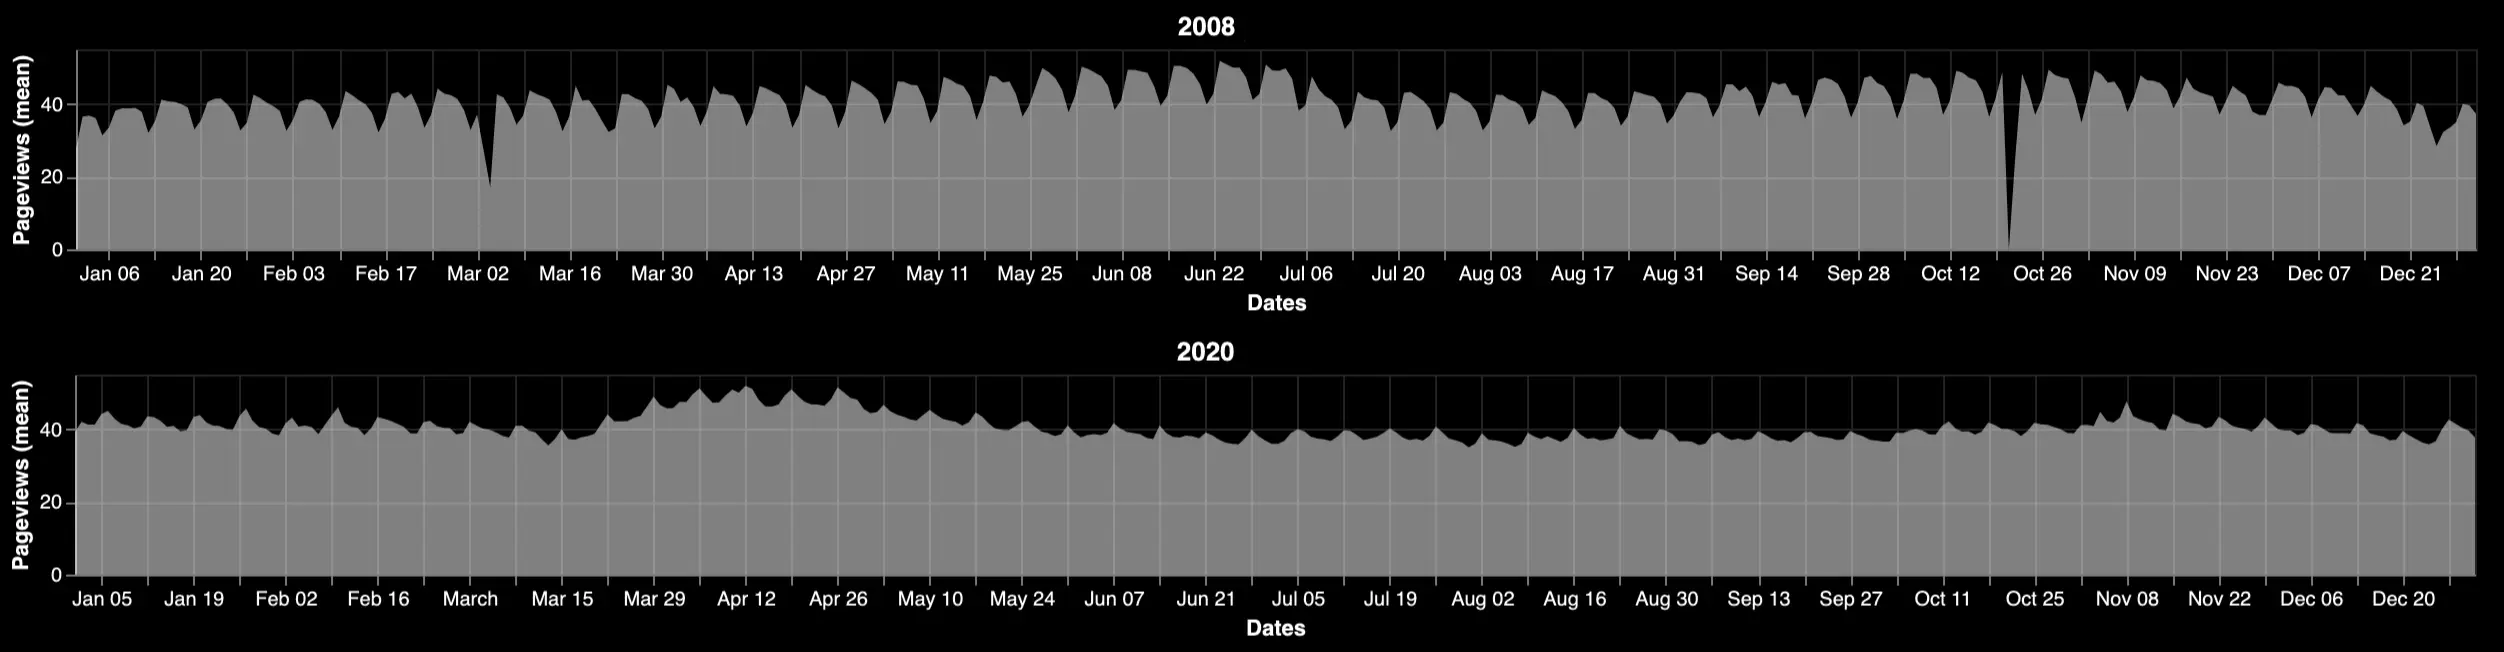
WikiMaps uses the hourly pageview histories of the last 13 years (2008-2020). These data are made available by the Wikimedia Analytics team. Their quality varies from year to year. Three periods can be distinguished:
- from 2008 to 2011, the data are less reliable, sometimes with significant gaps
- from 2011 to 2015, the data are somewhat more reliable, but still very sensitive to bots
- from 2015 onwards, the data are relatively more reliable. The distinction between pagecounts (simple requests for a page, which may come from a bot) and pageviews (views by users) is introduced.
The removal of bots after 2015 is clearly visible in this geographical area of the Near East, particularly in Iran, where a great many pages are no longer visible from 2016 onwards (on the right).
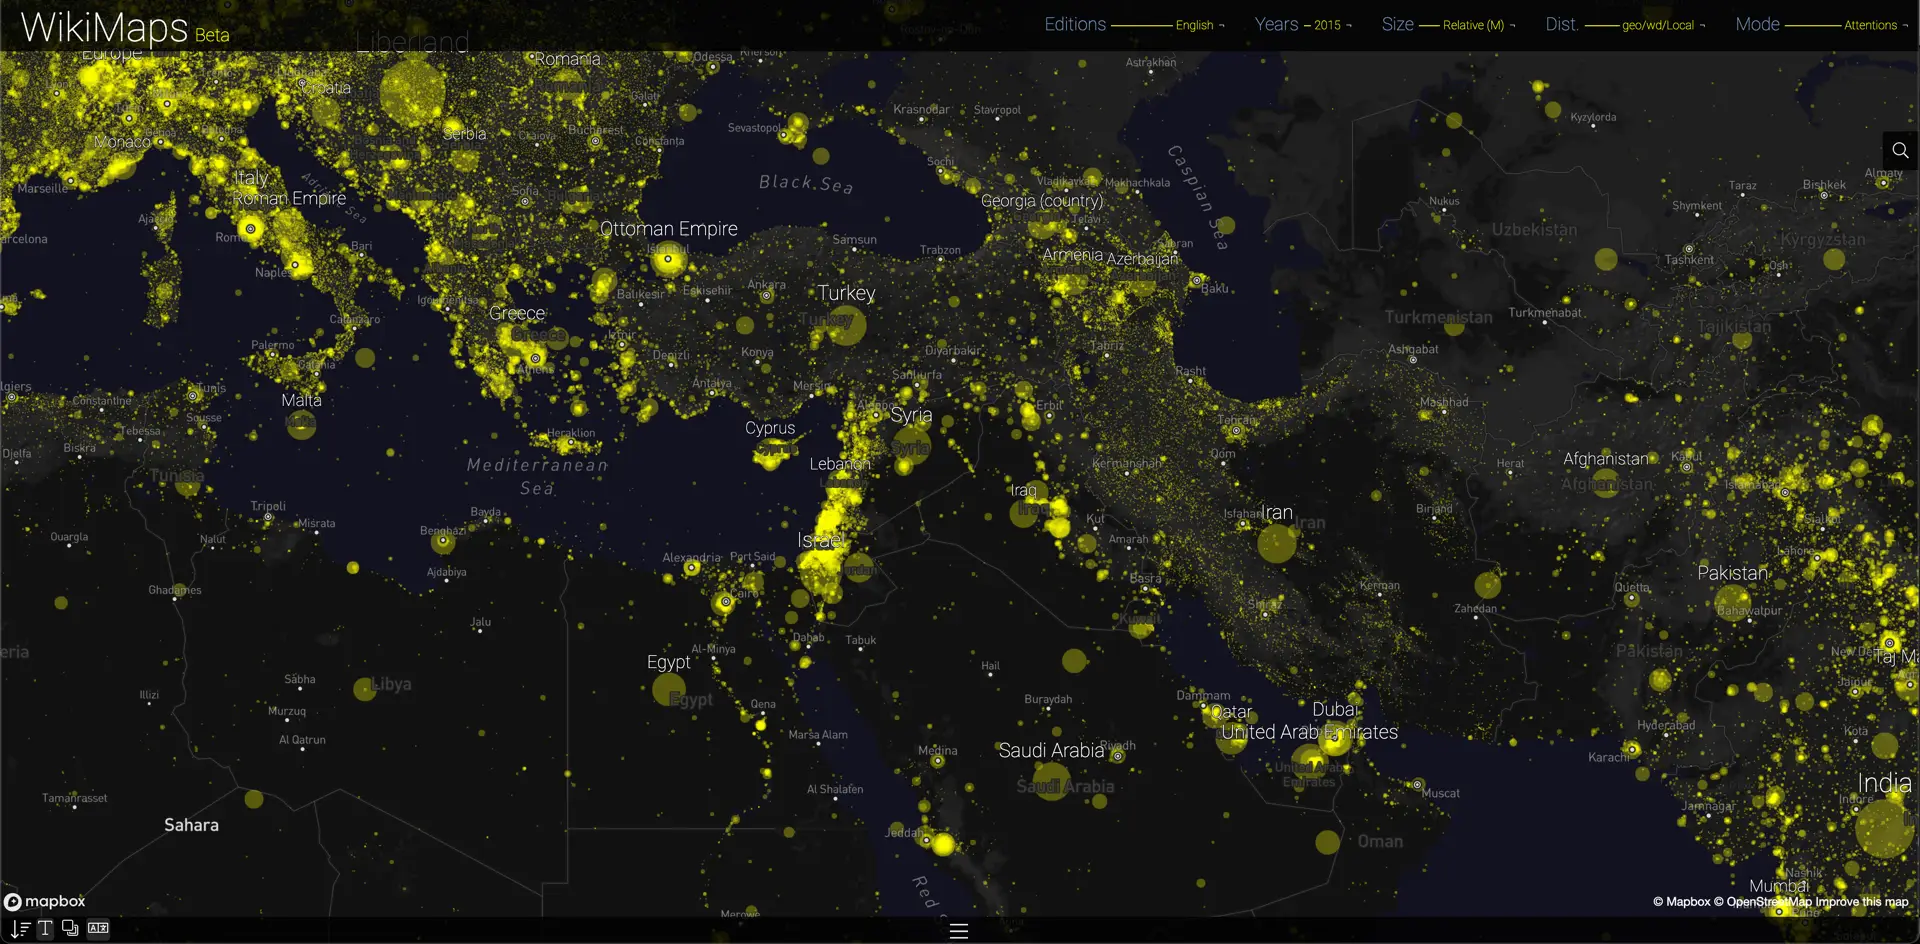
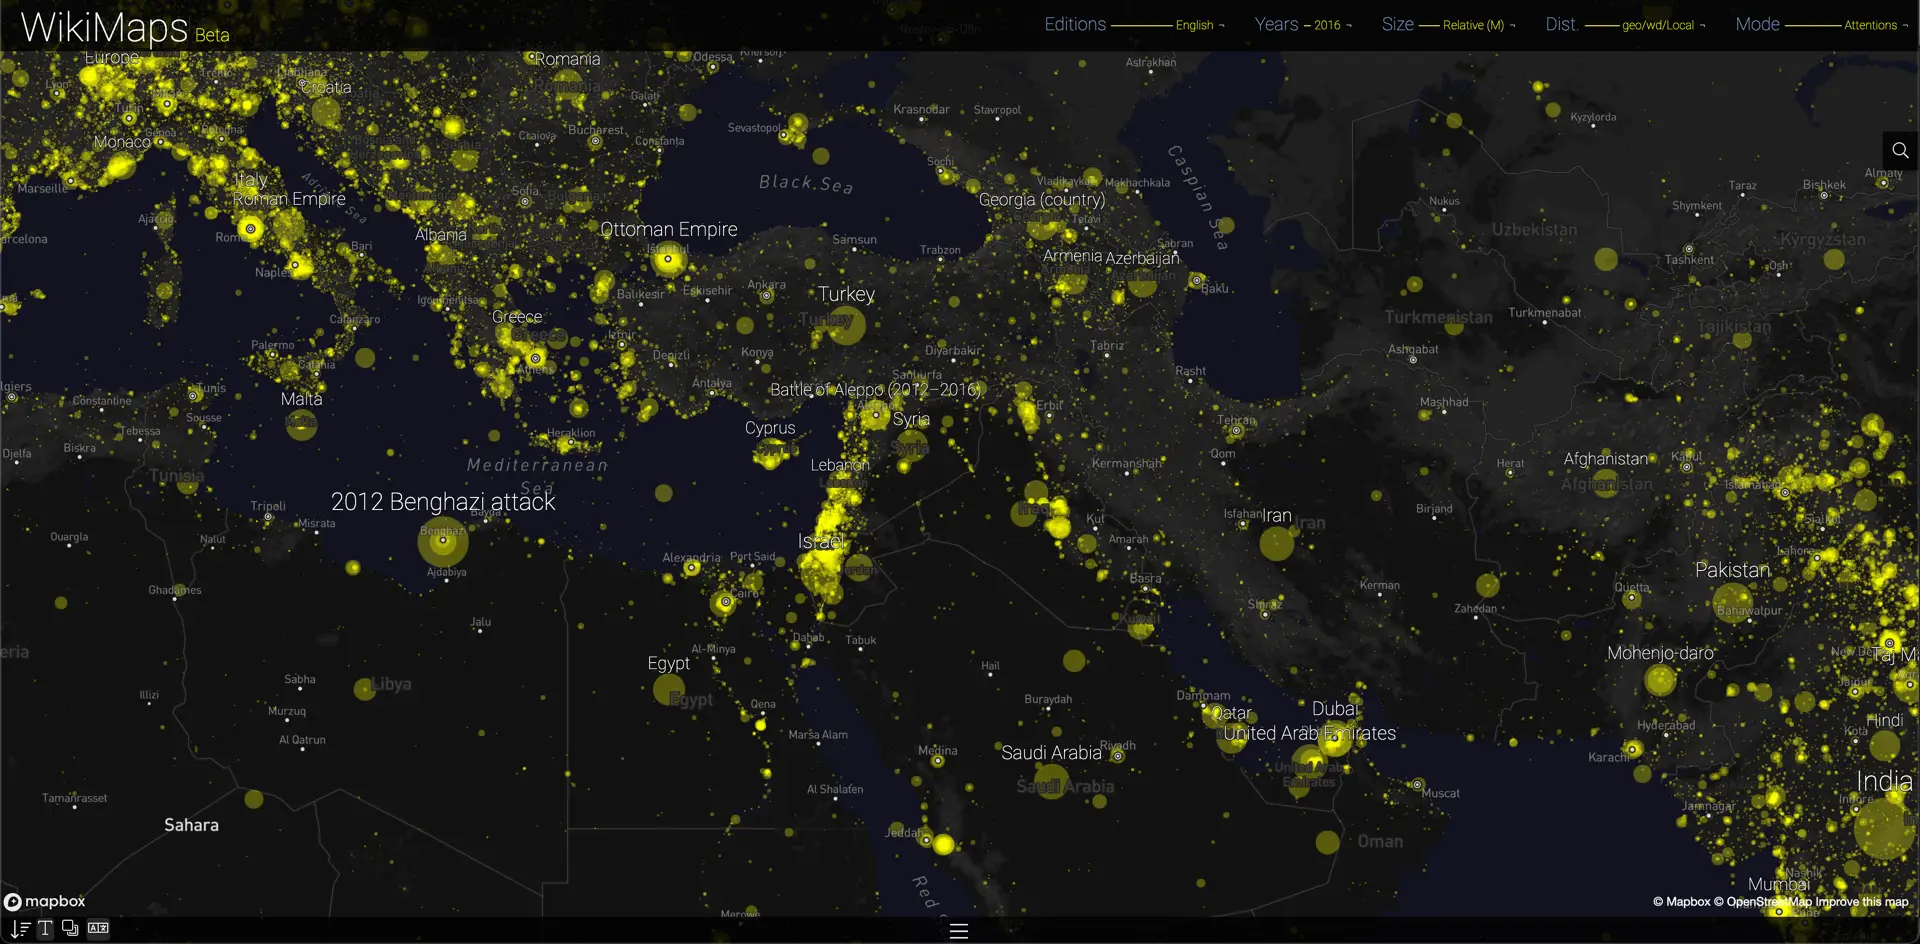
English - 2015 - Geographical - Attentions
English - 2016 - Geographical - Attentions
The current version of WikiMaps starts in 2016, as the Wikimedia Foundation reported that earlier data were not reliable (see Update).
Size
WikiMaps presents pages according to their importance in the different exploration modes, as well as the titles of the 50 most important pages. To customise the exploration, the size of the pages and of their titles can be adjusted. This size can be relative to the most important page of the map, or an absolute value that makes it easier to compare different maps.
Distance
In order to produce maps for exploring the pageviews of Wikipedia, WikiMaps offers three types of distance to spatialise pages.
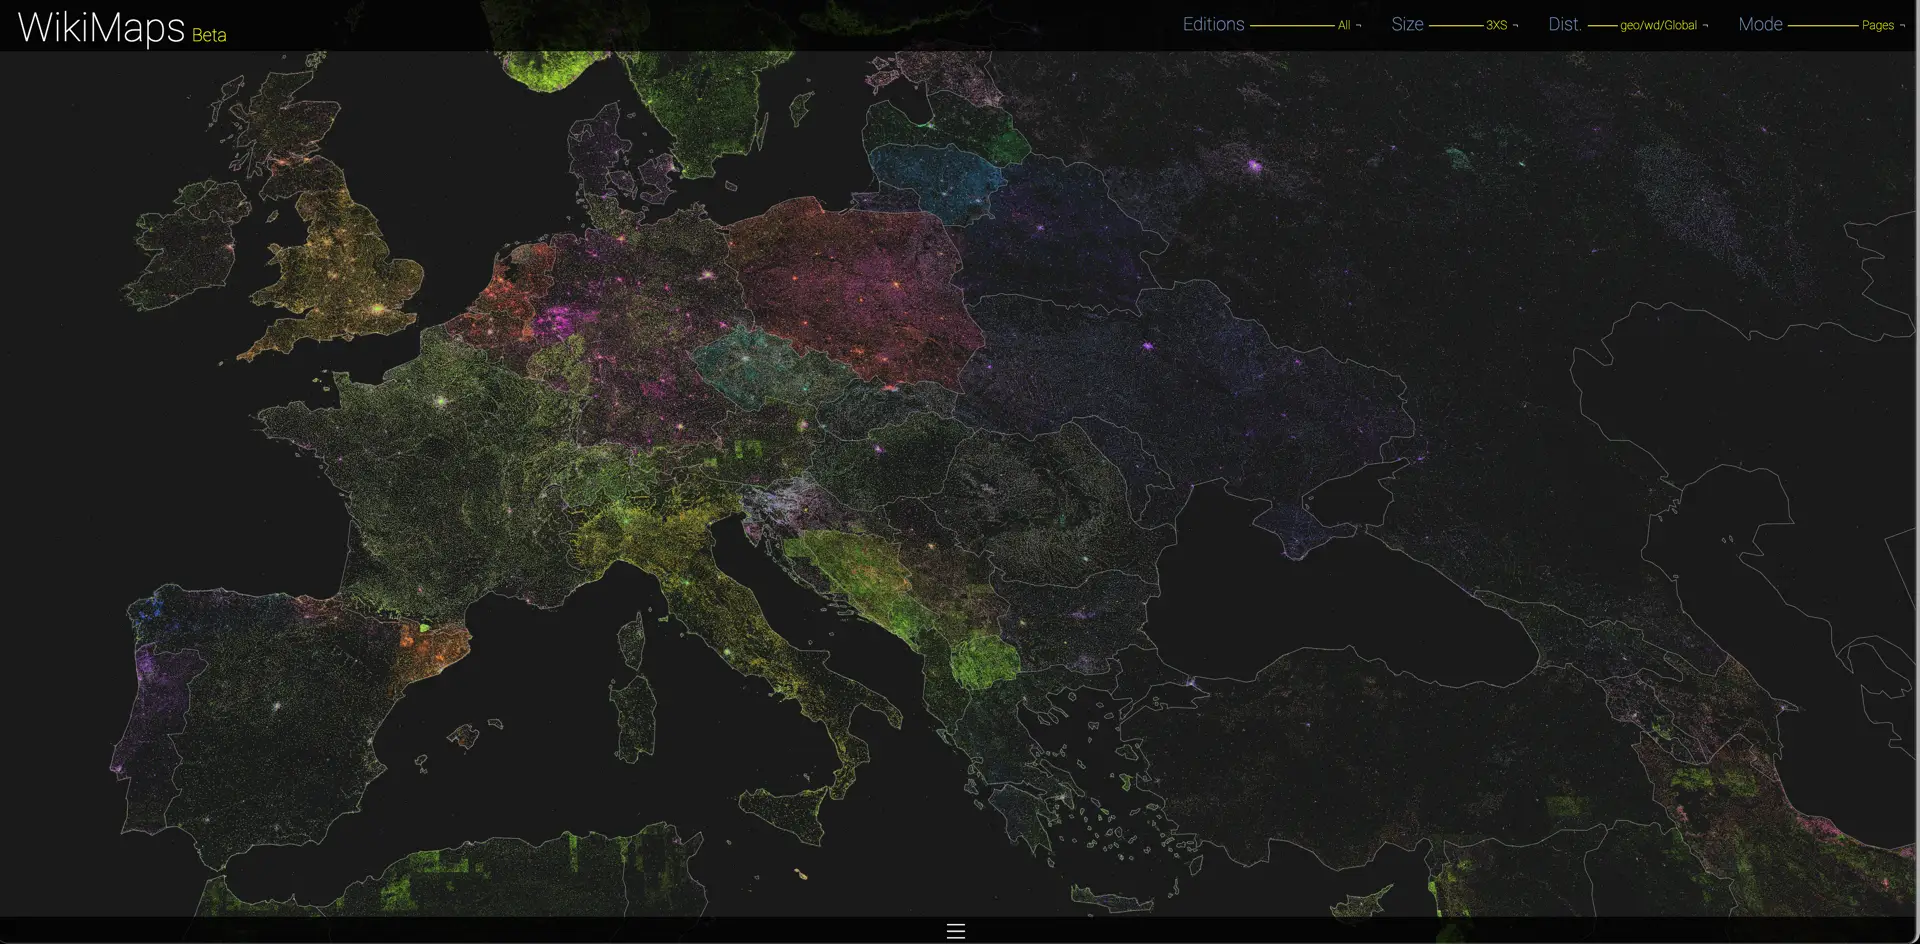
Geographical
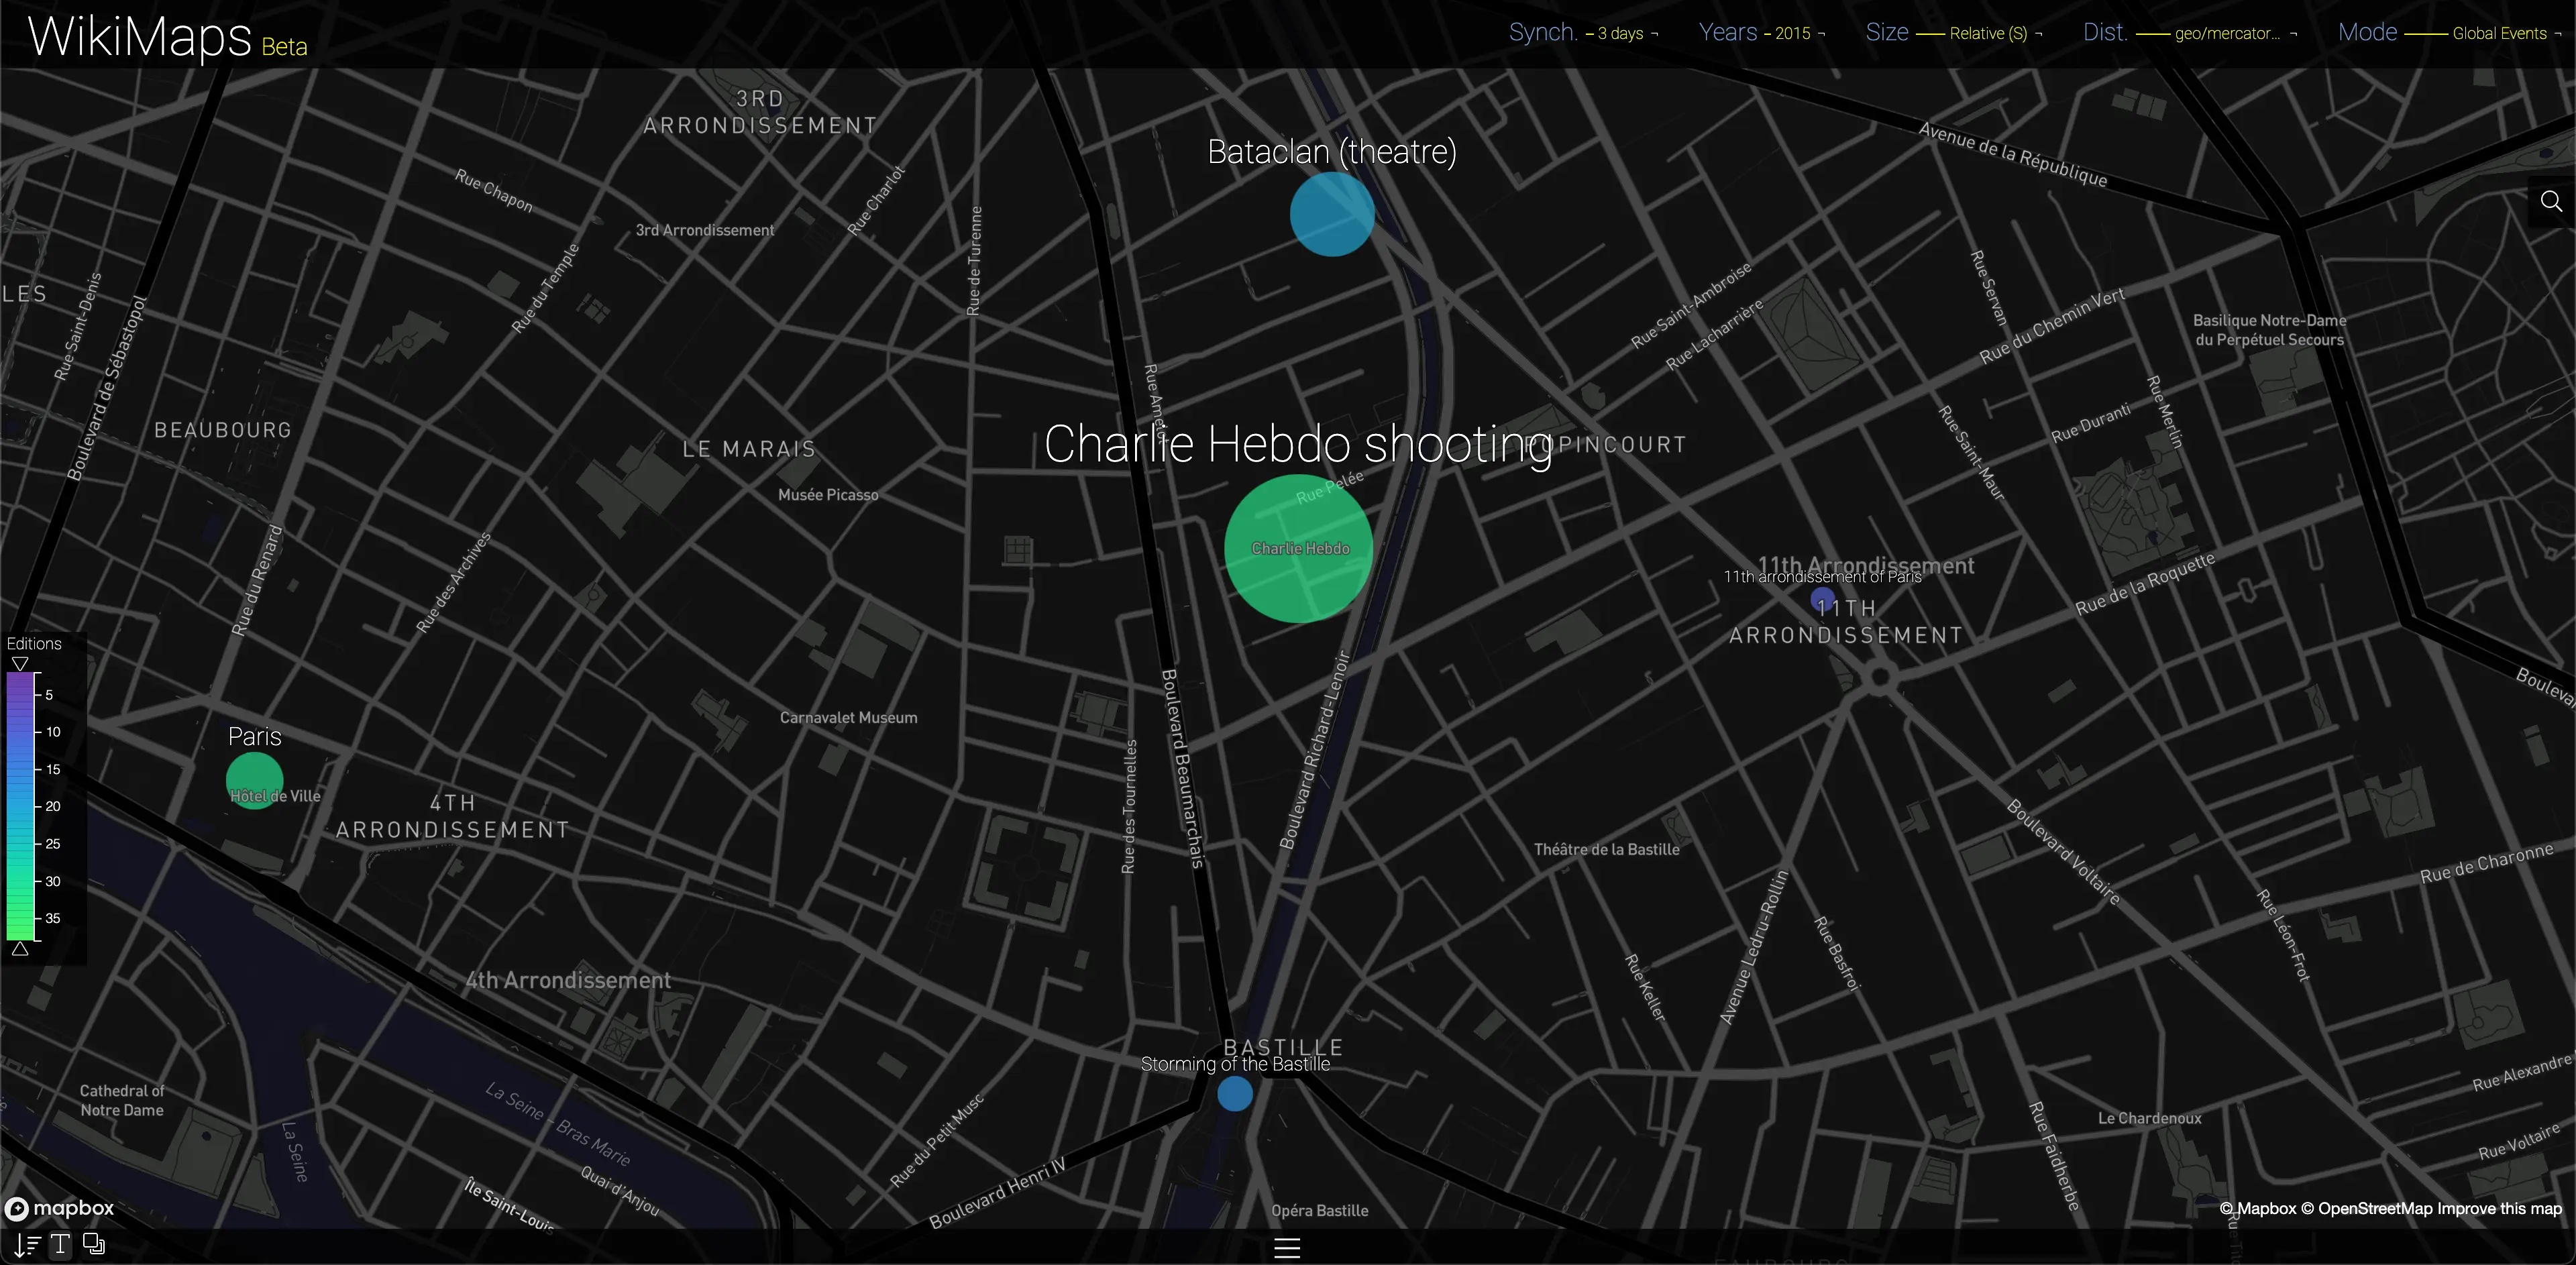
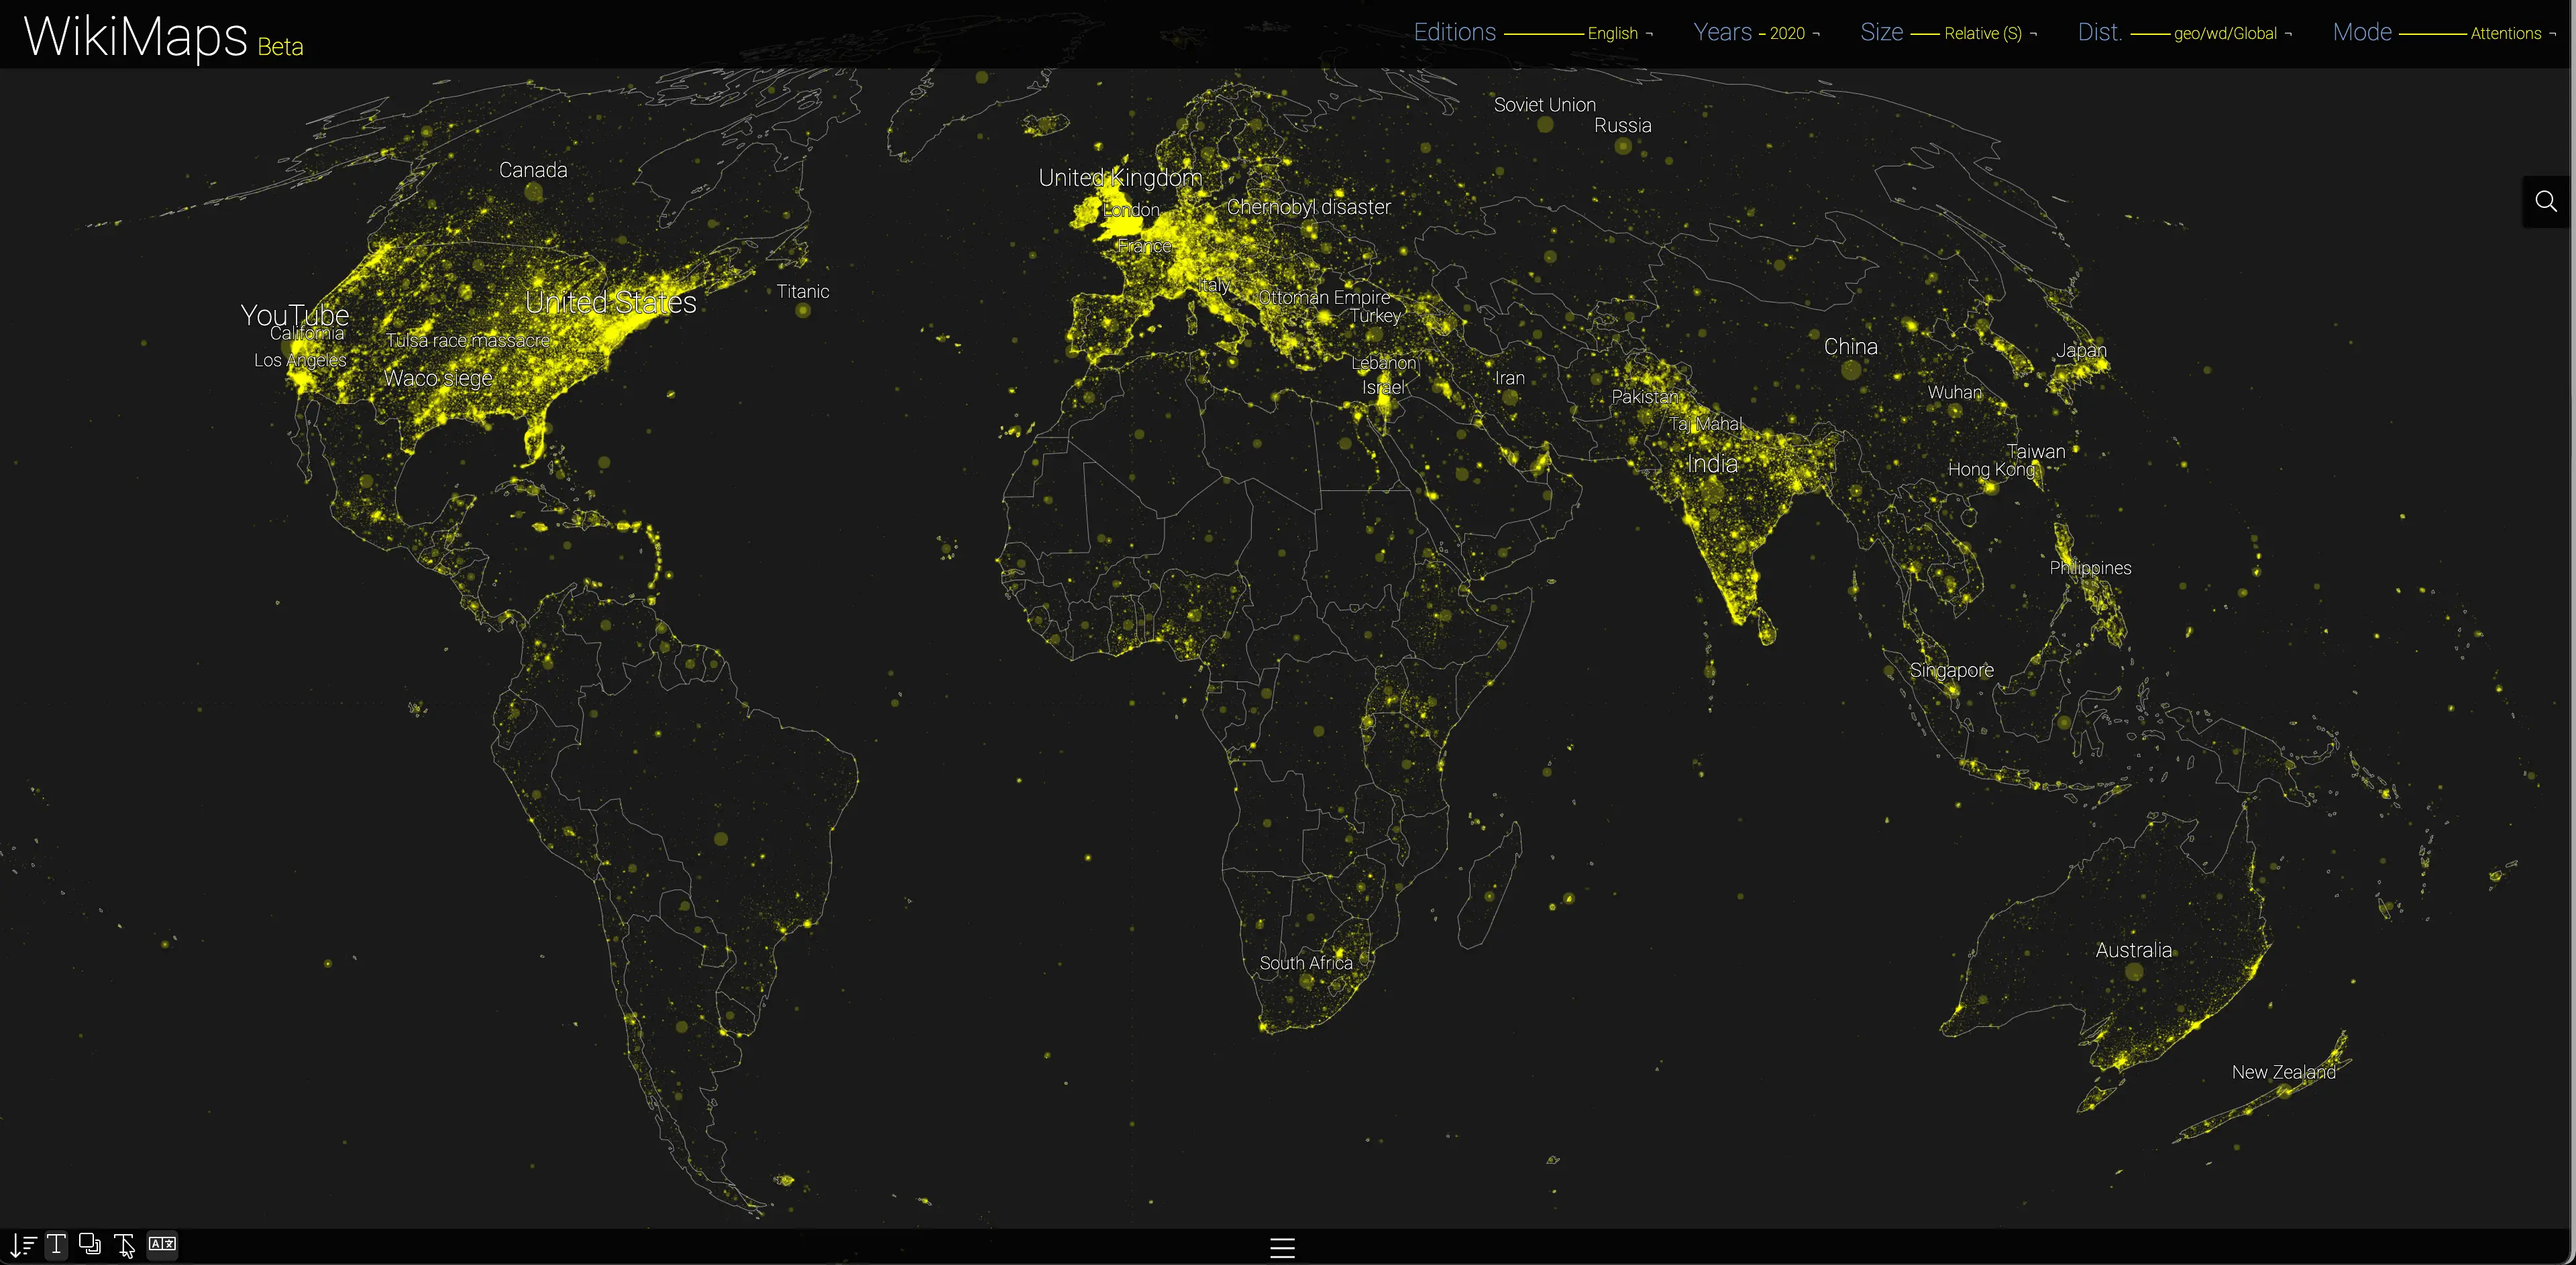
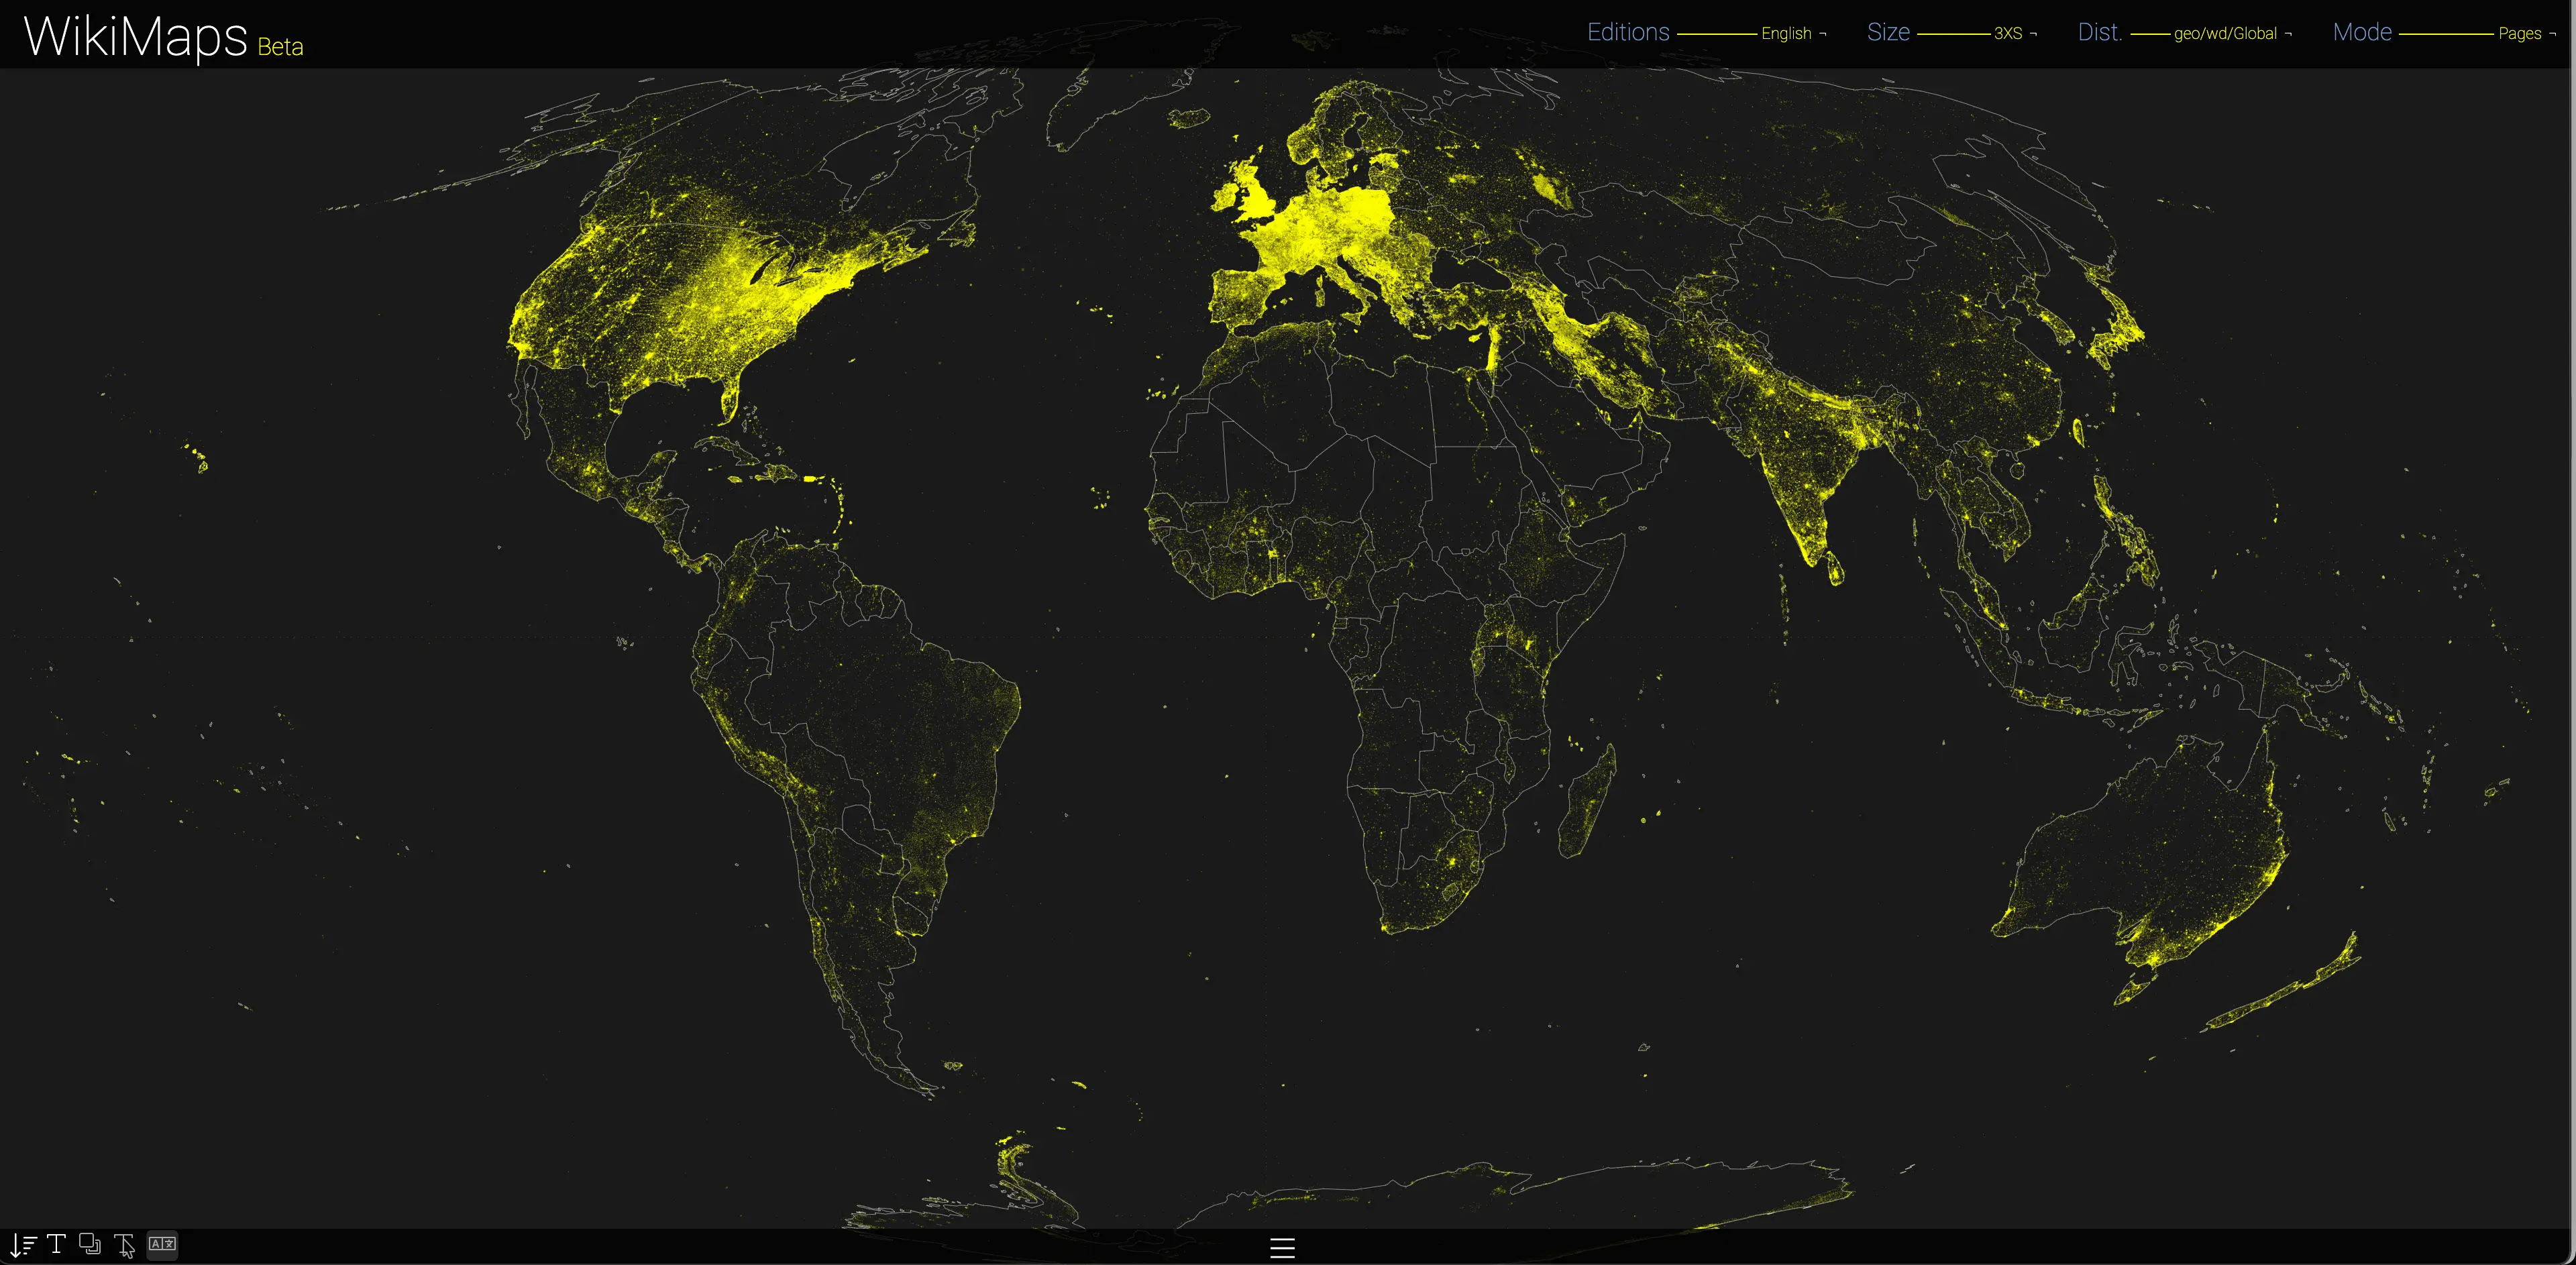
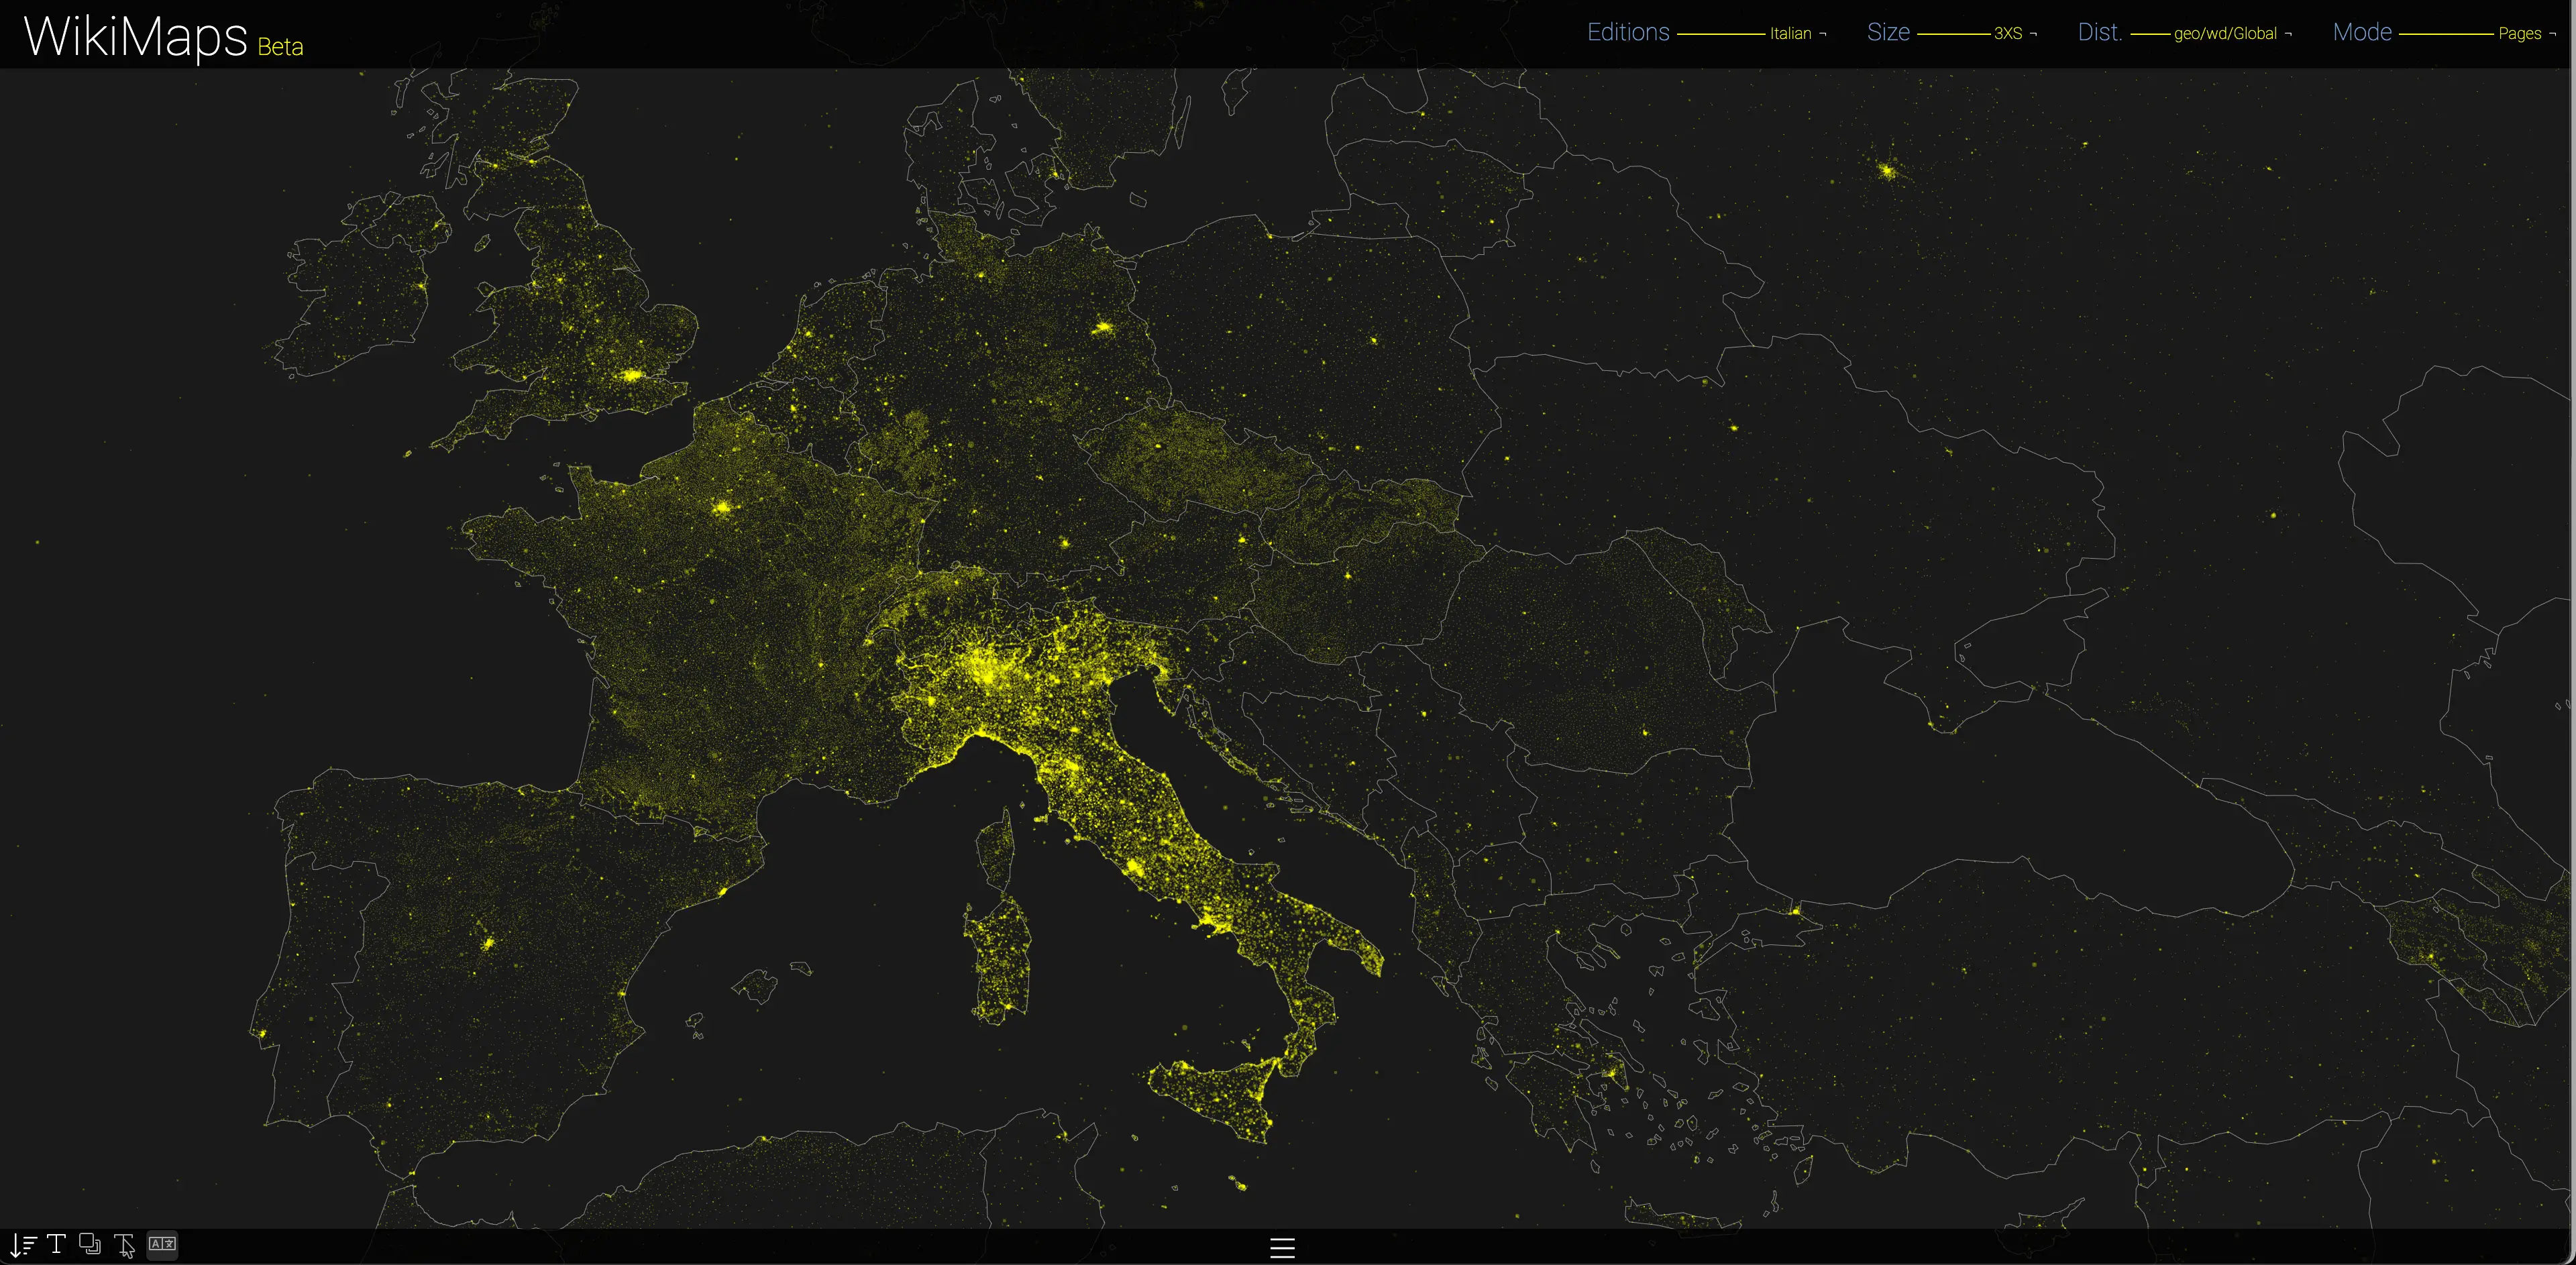
This projection uses the metadata (latitude and longitude) found on the pages or on Wikidata. Wikidata provides the same location whatever the edition of Wikipedia, whereas the data found directly on the pages may differ from one edition to another. Once the data source has been chosen, it is possible to use a projection suited to the global scale (Mollweide) or one better suited to the local scale. In the latter case, WikiMaps uses OpenStreetMap data (via Mapbox) to present precise data all over the world.
Intertextual
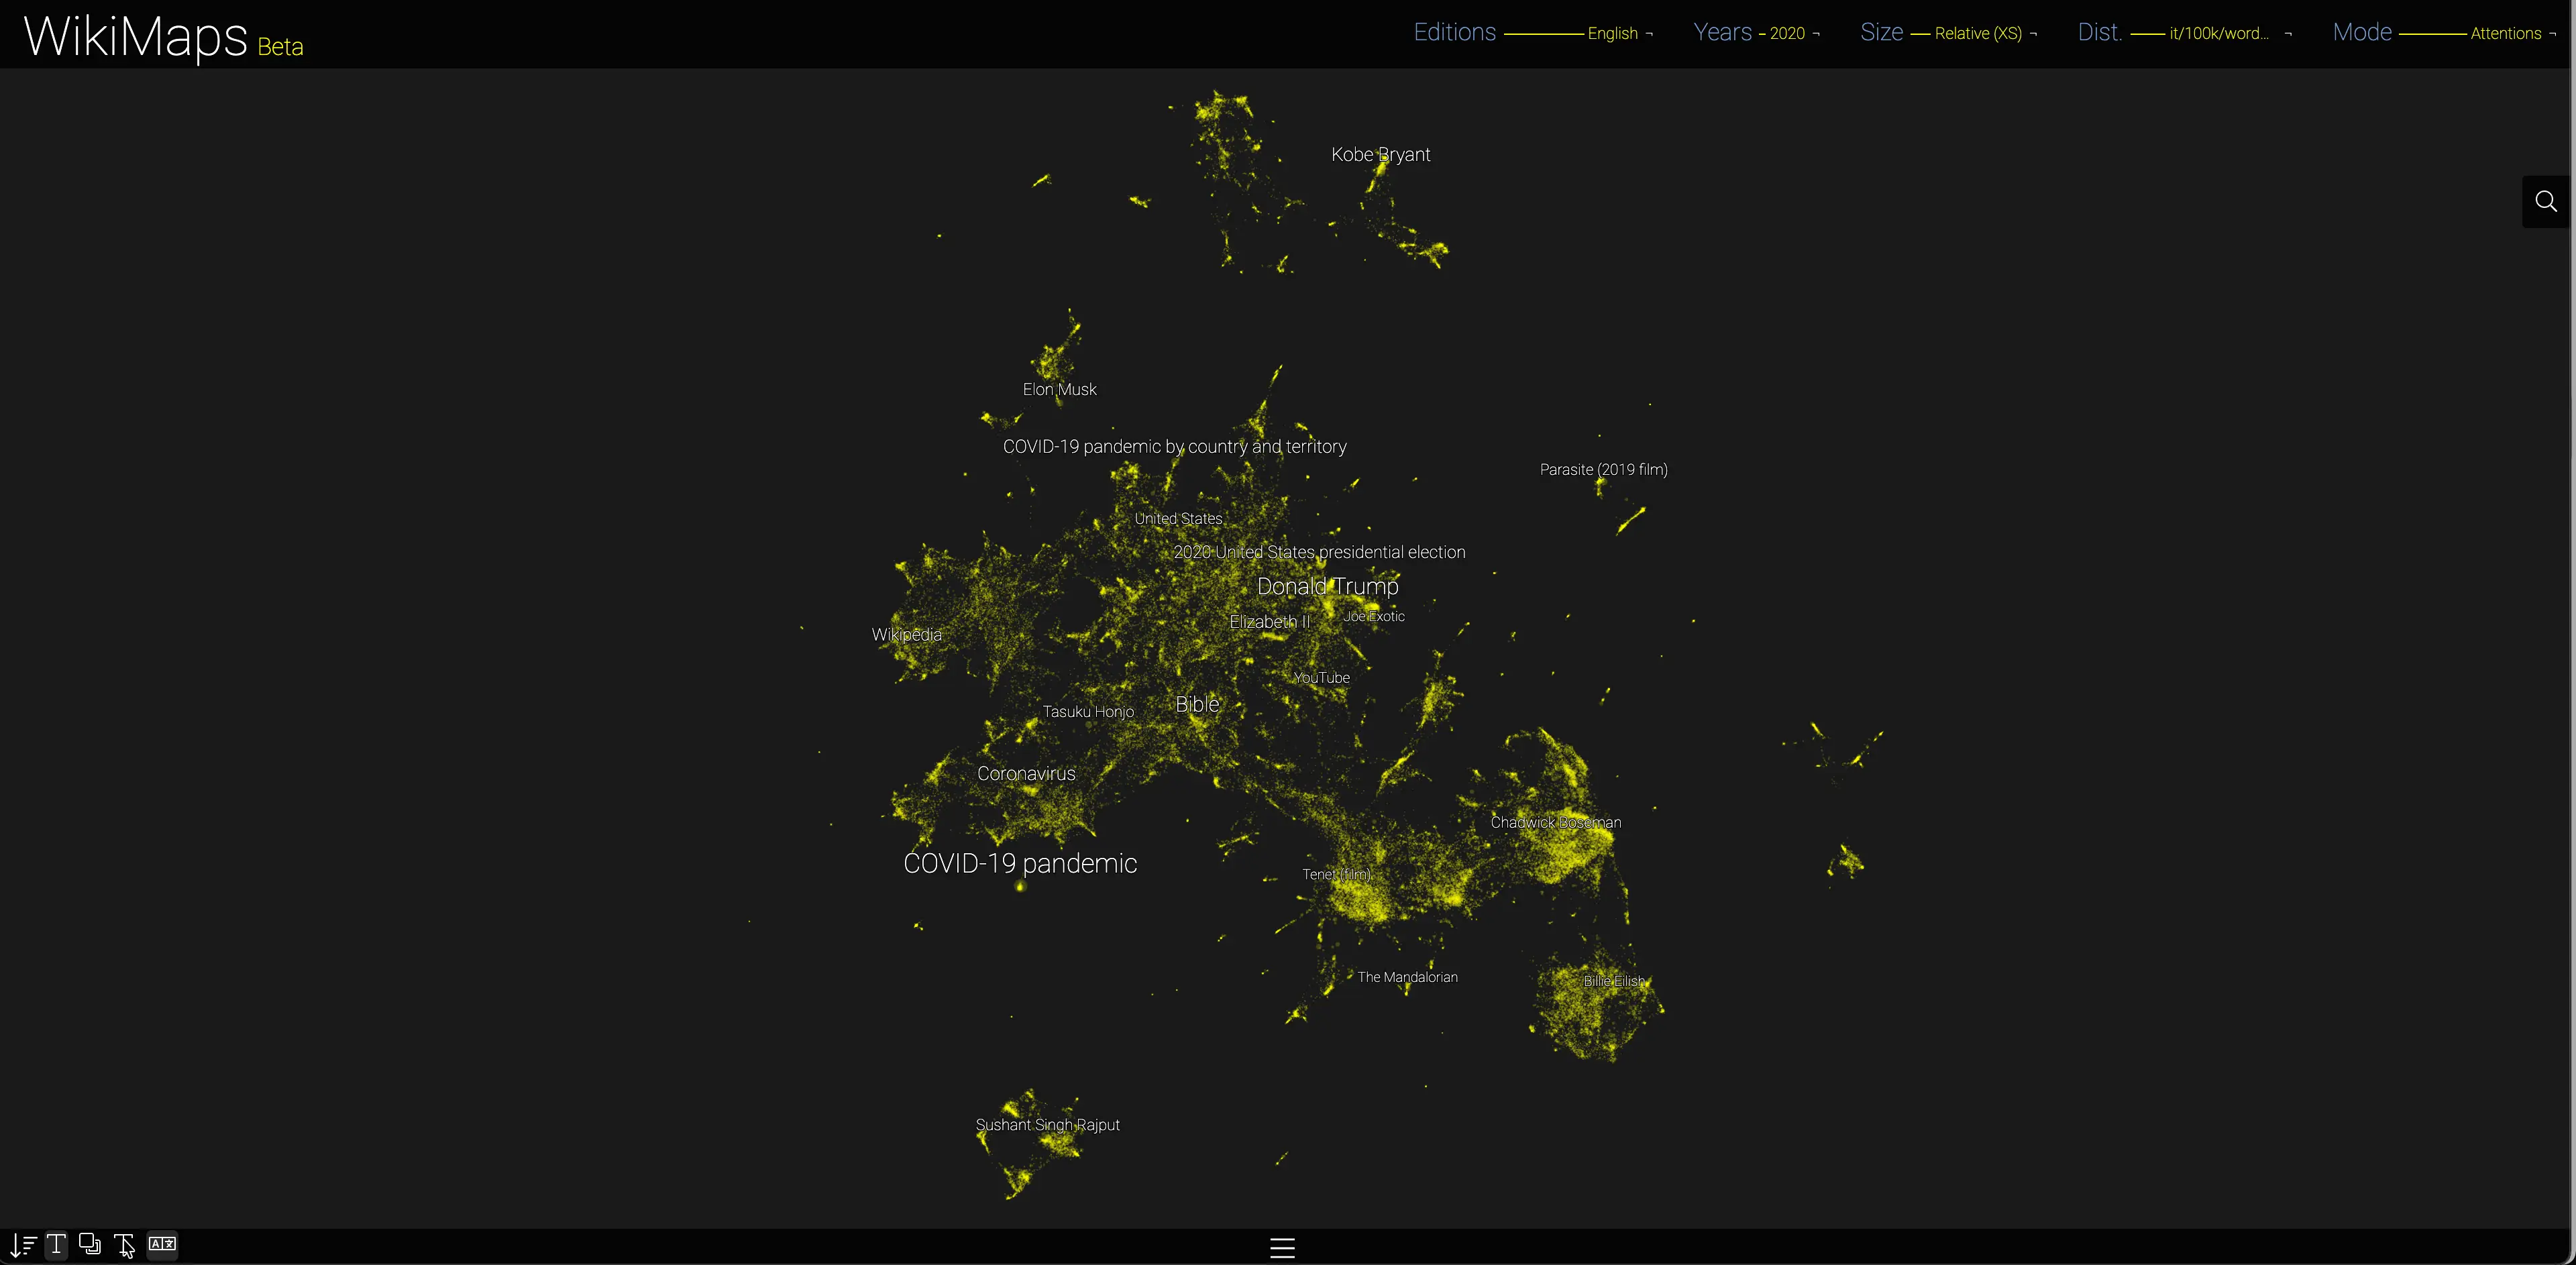
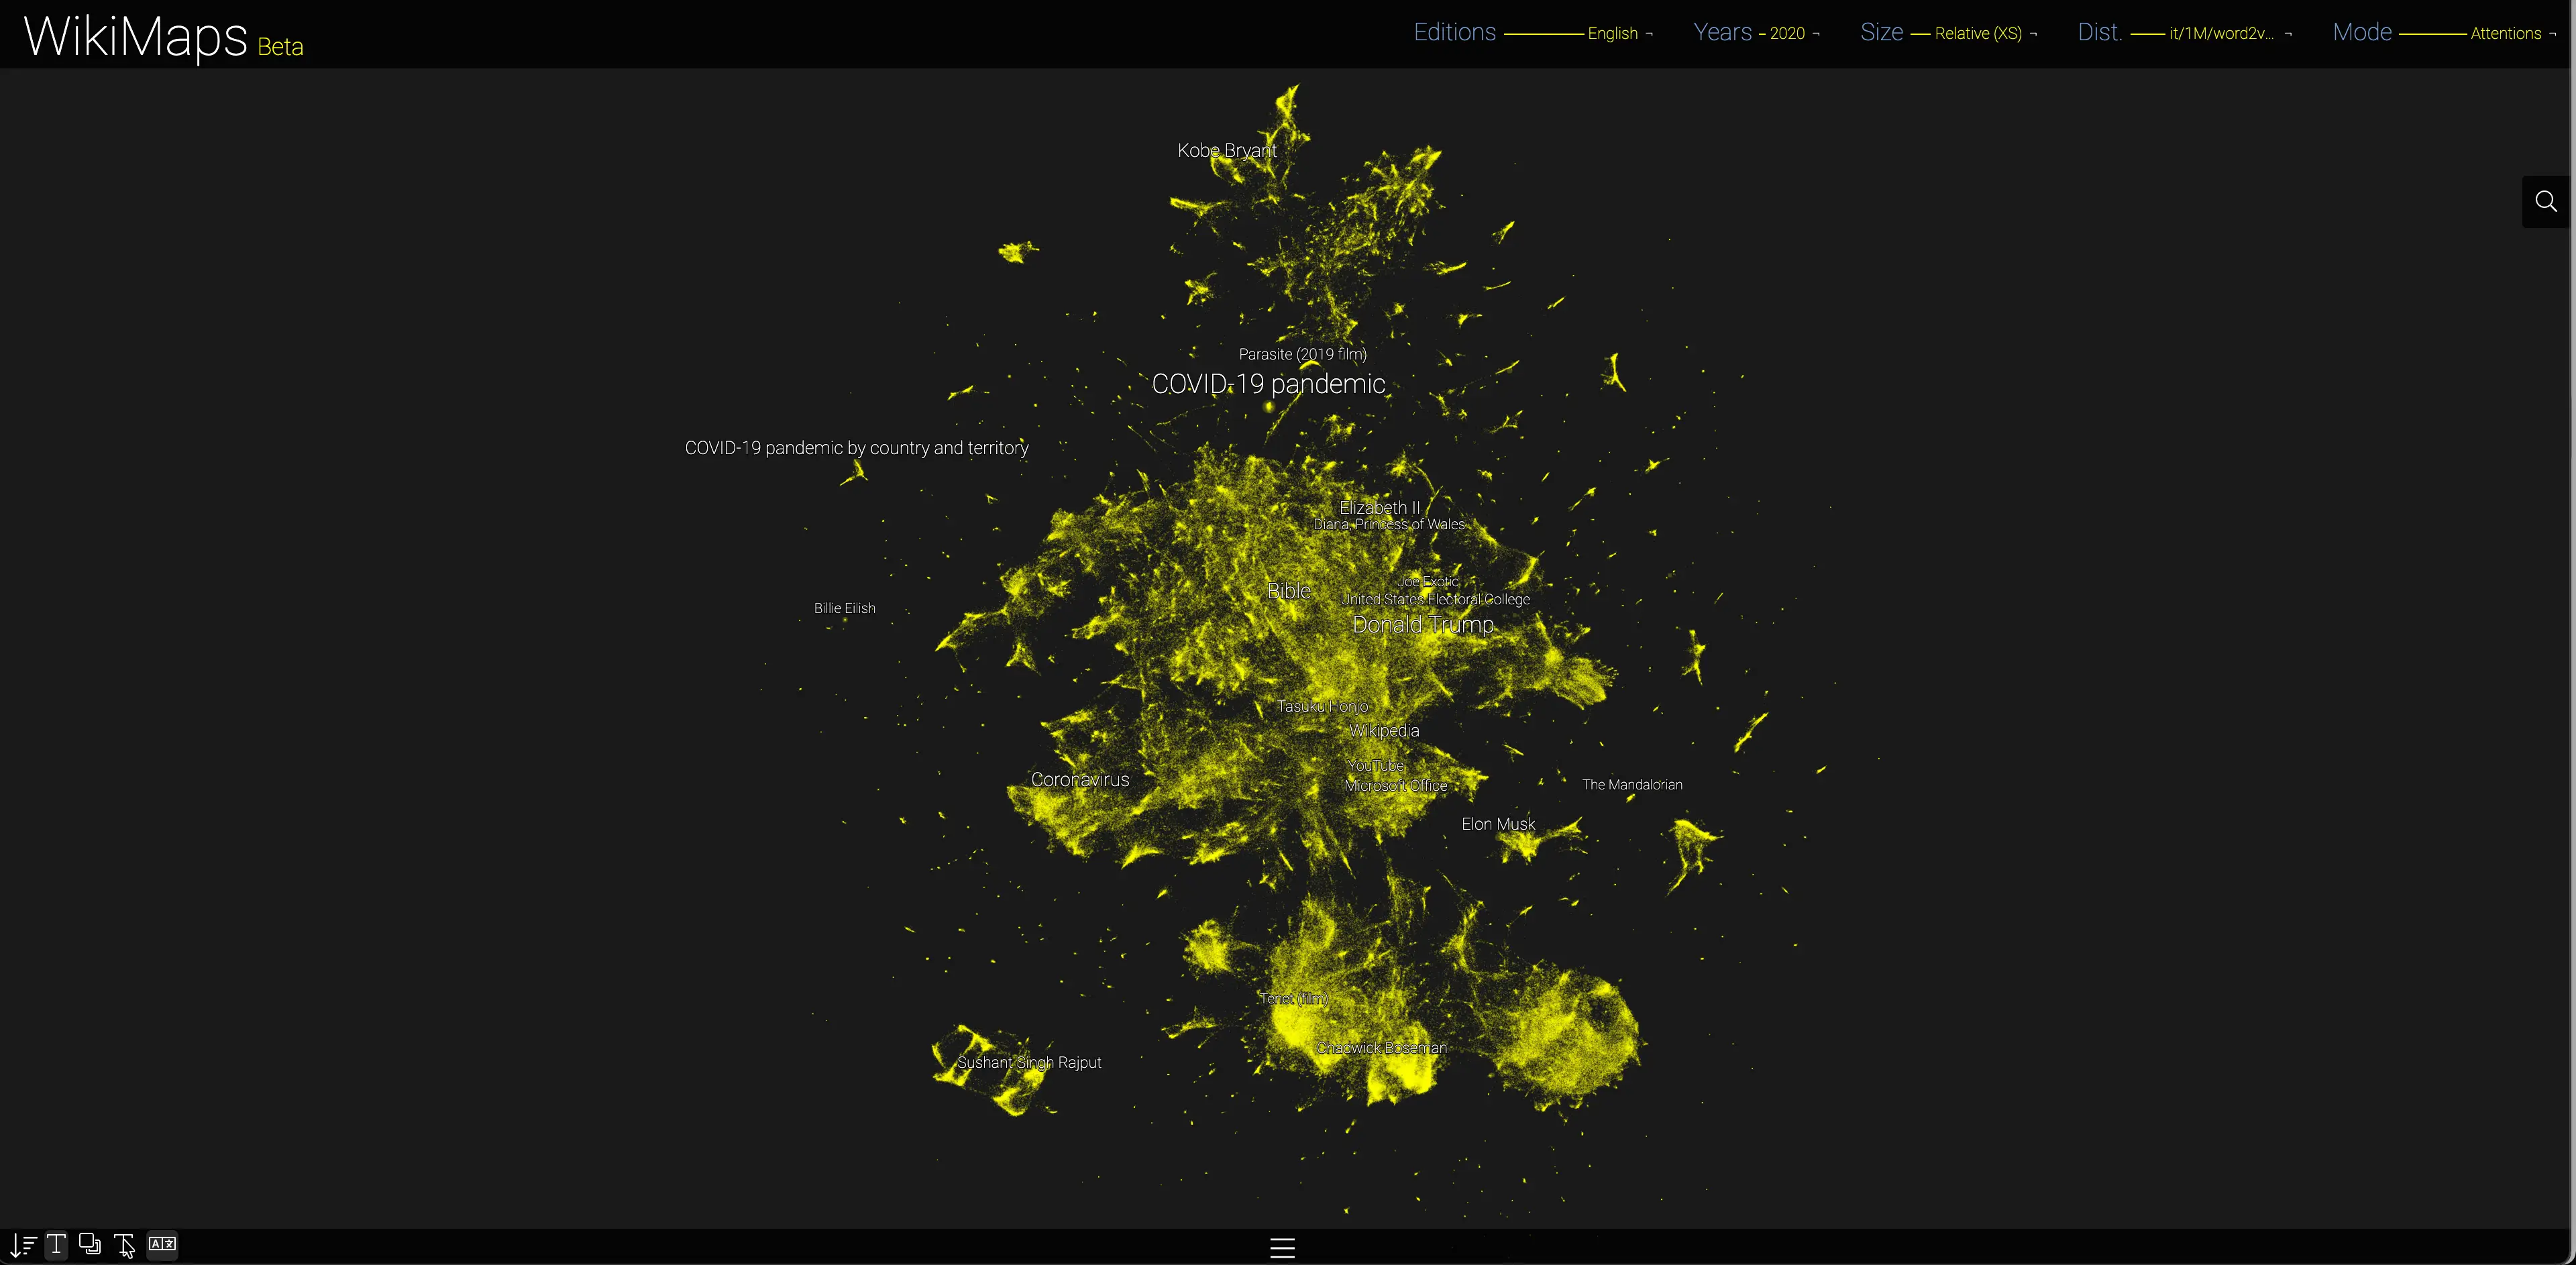
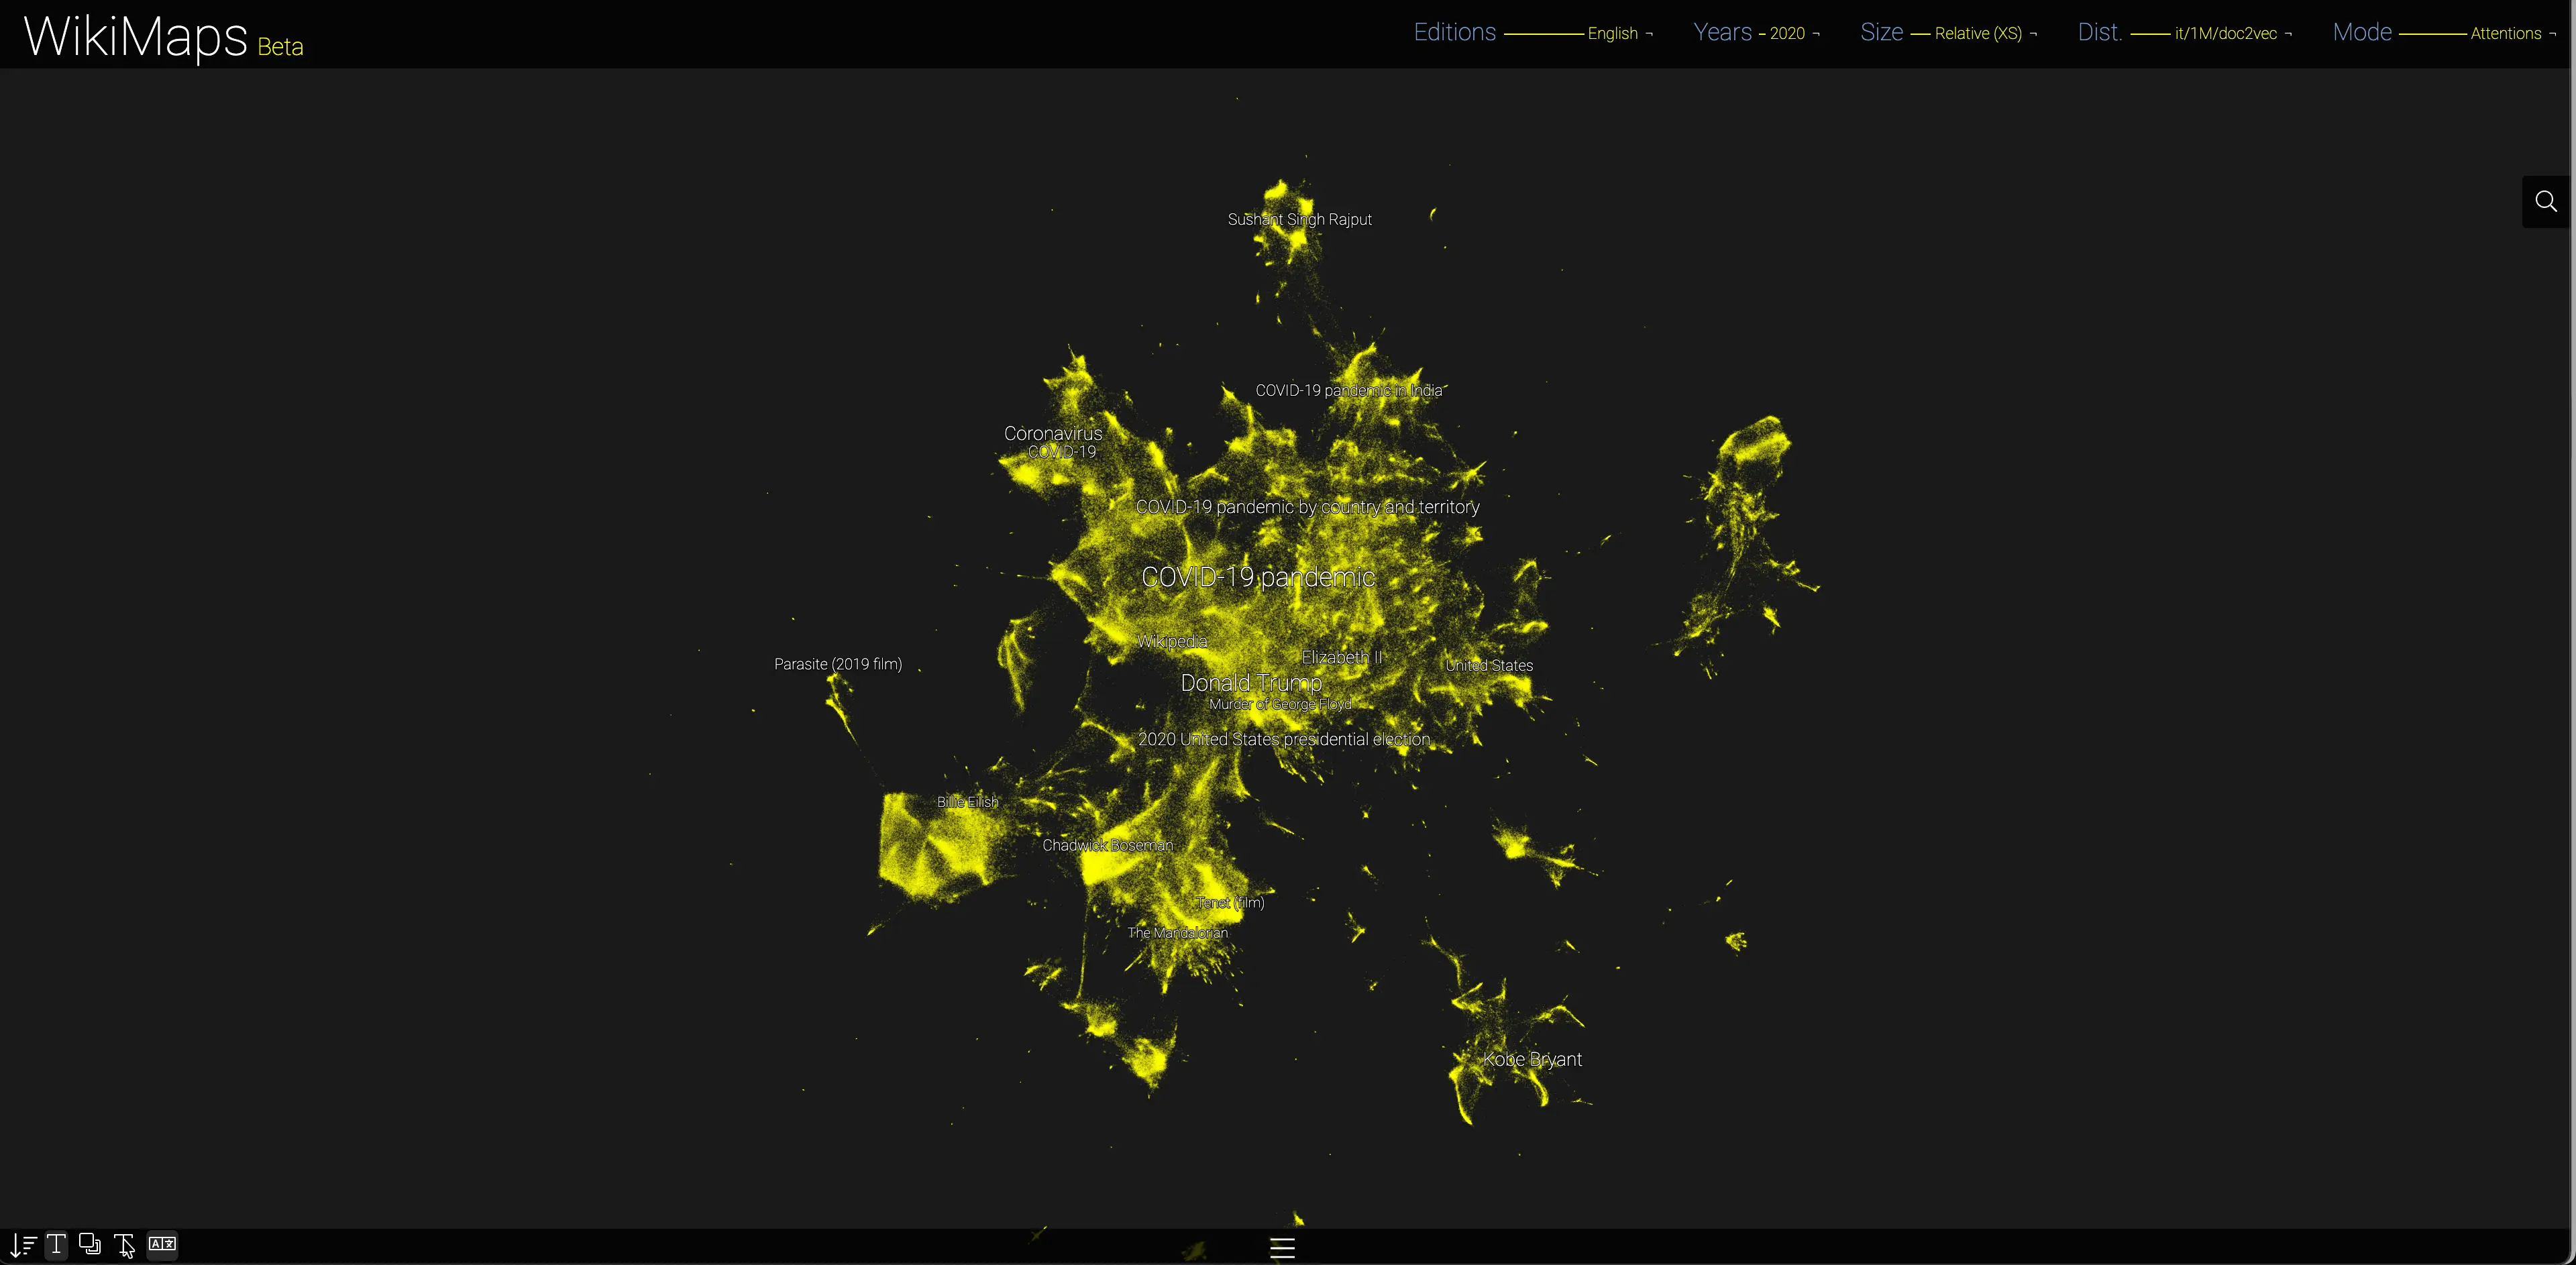
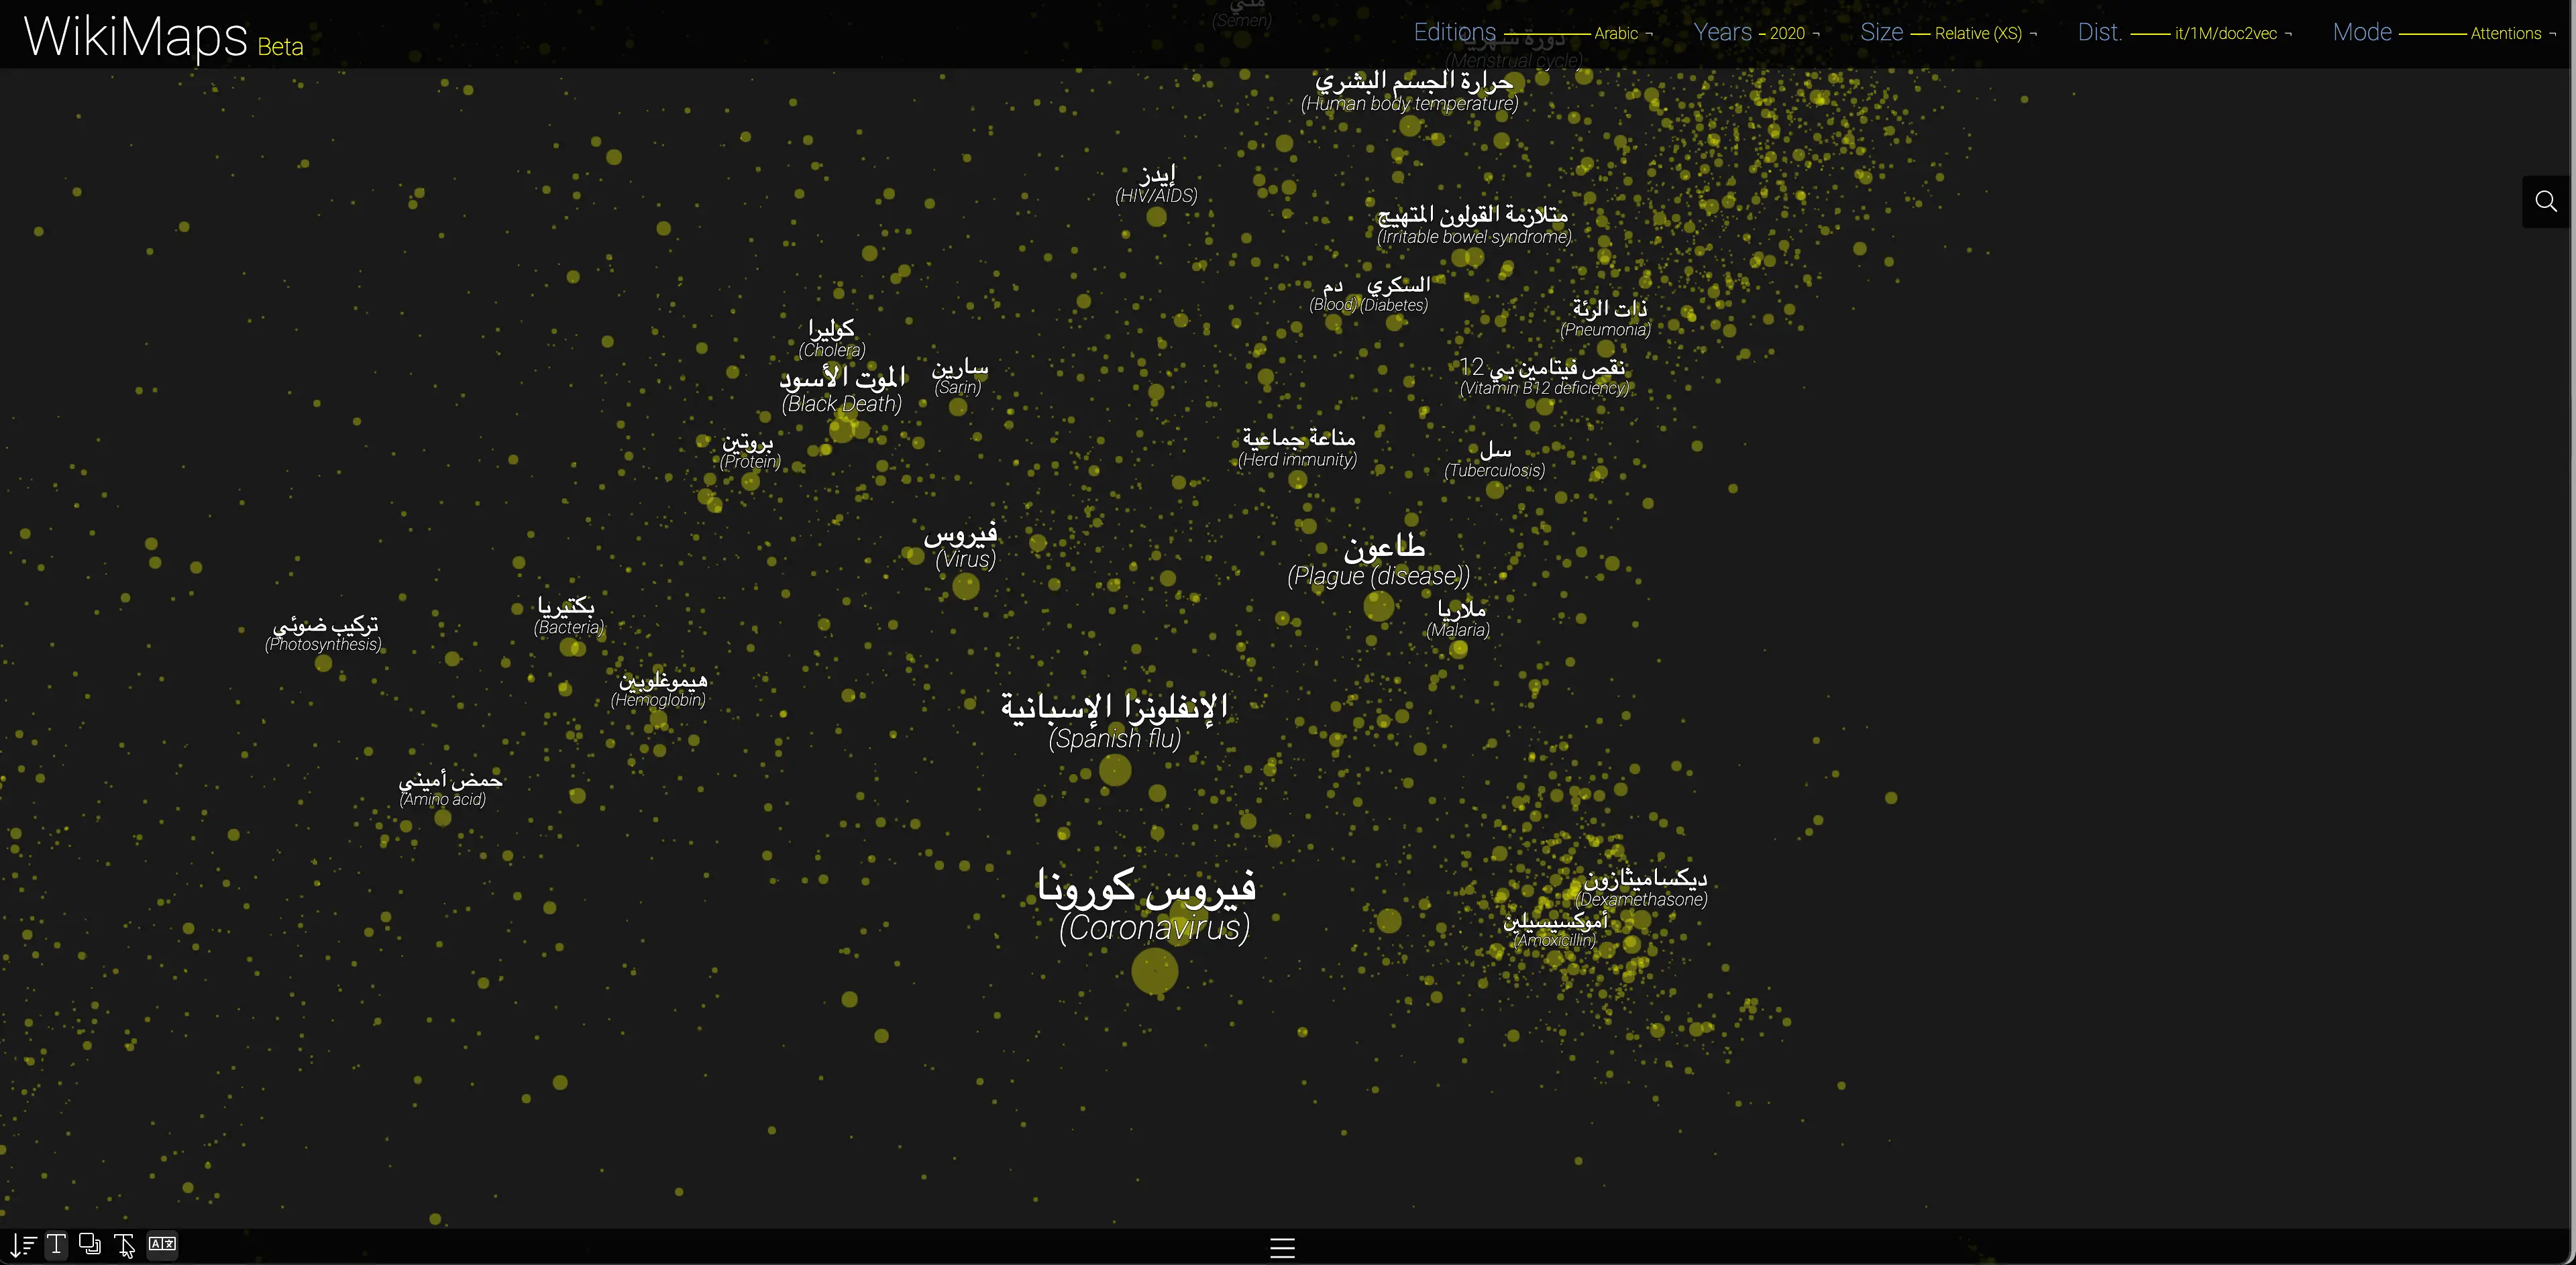
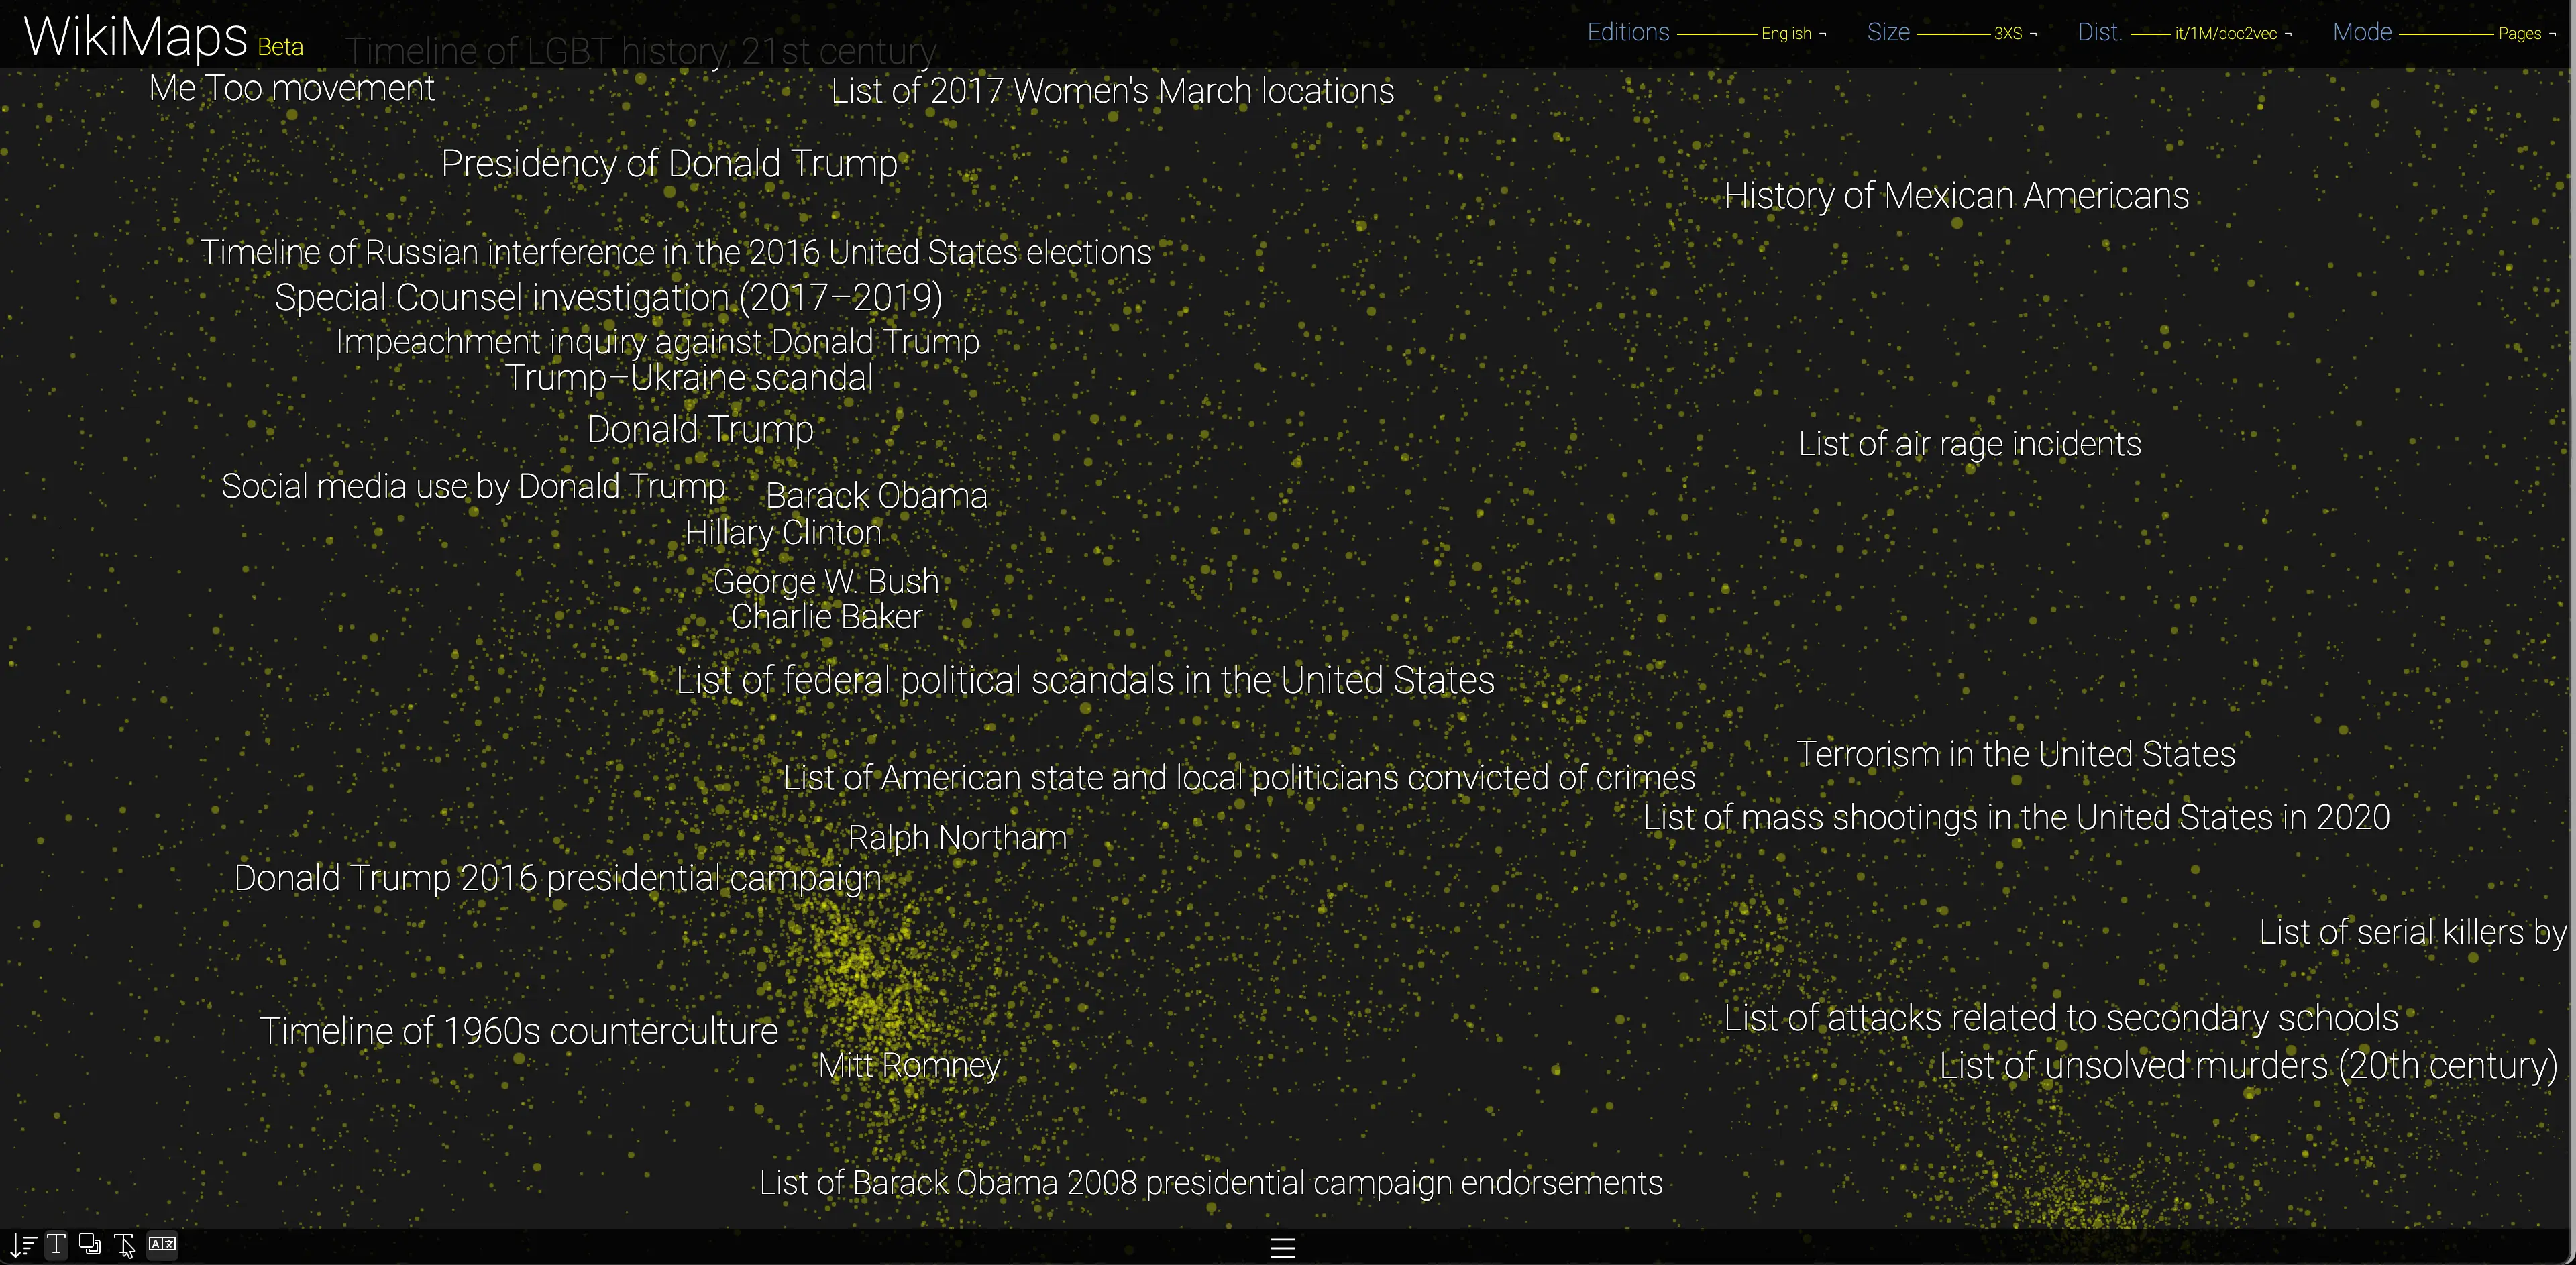
This projection uses the full text of the 38 editions of Wikipedia to position pages according to their textual proximity. To do so, we use two complementary methods, both based on word embeddings computed with word2vec. For the first, we train a model for each language, then summarise each page as an average of the vectors of the words it contains, weighted by their relative specificity as measured by tf-idf. On this basis, we compute the cosine distance between the vectors that summarise the pages. This approach has the advantage of better preserving specificities, such as the proximity between Didier Raoult and the coronavirus. The second approach directly uses doc2vec, the conventional adaptation of word2vec for measuring the similarity between documents. This approach directly yields one vector per page. It has the advantage of summarising pages efficiently, but at the risk of taking their specificities less into account. The two-dimensional spatialisation is performed with UMAP (after testing other methods that proved less convincing for such a large number of pages, MDS and t-SNE in particular). To improve the quality of this projection, it is possible to display only the 100,000 most viewed pages, which reduces the constraints of the projection, as the relations between pages are considerably reduced. Weighted word2vec for the 100,000 most viewed pages is the default projection.
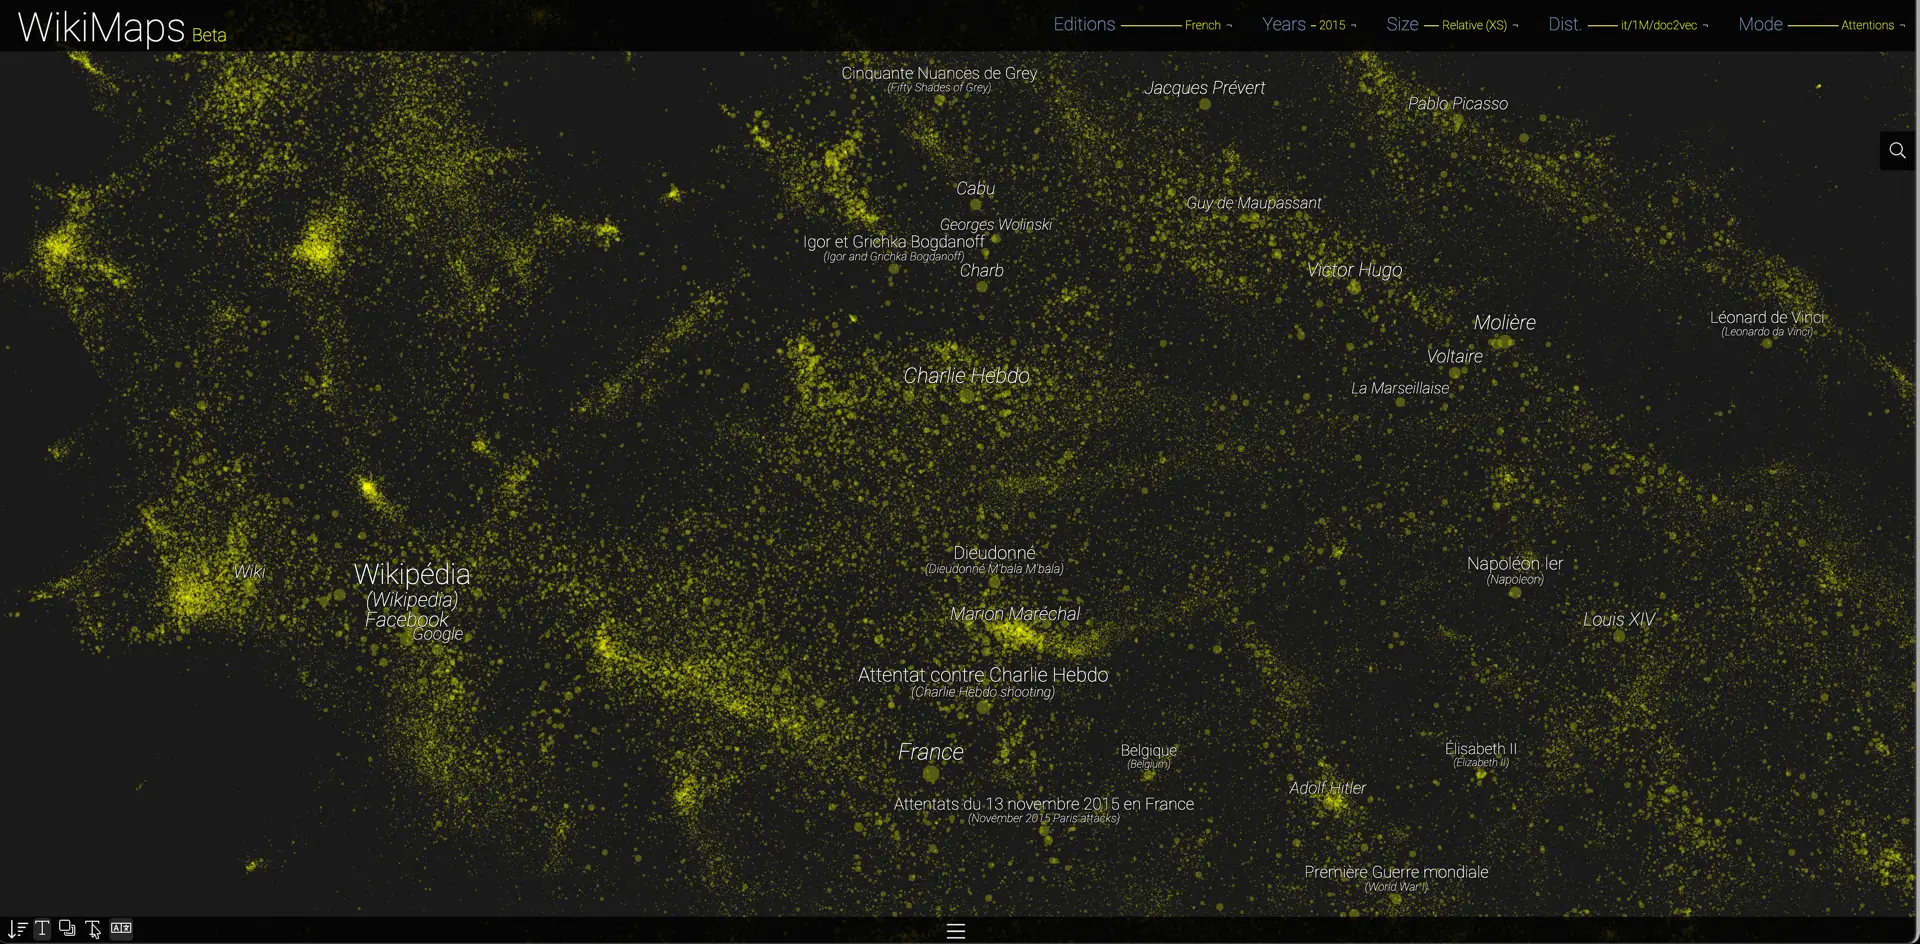
Hypertextual
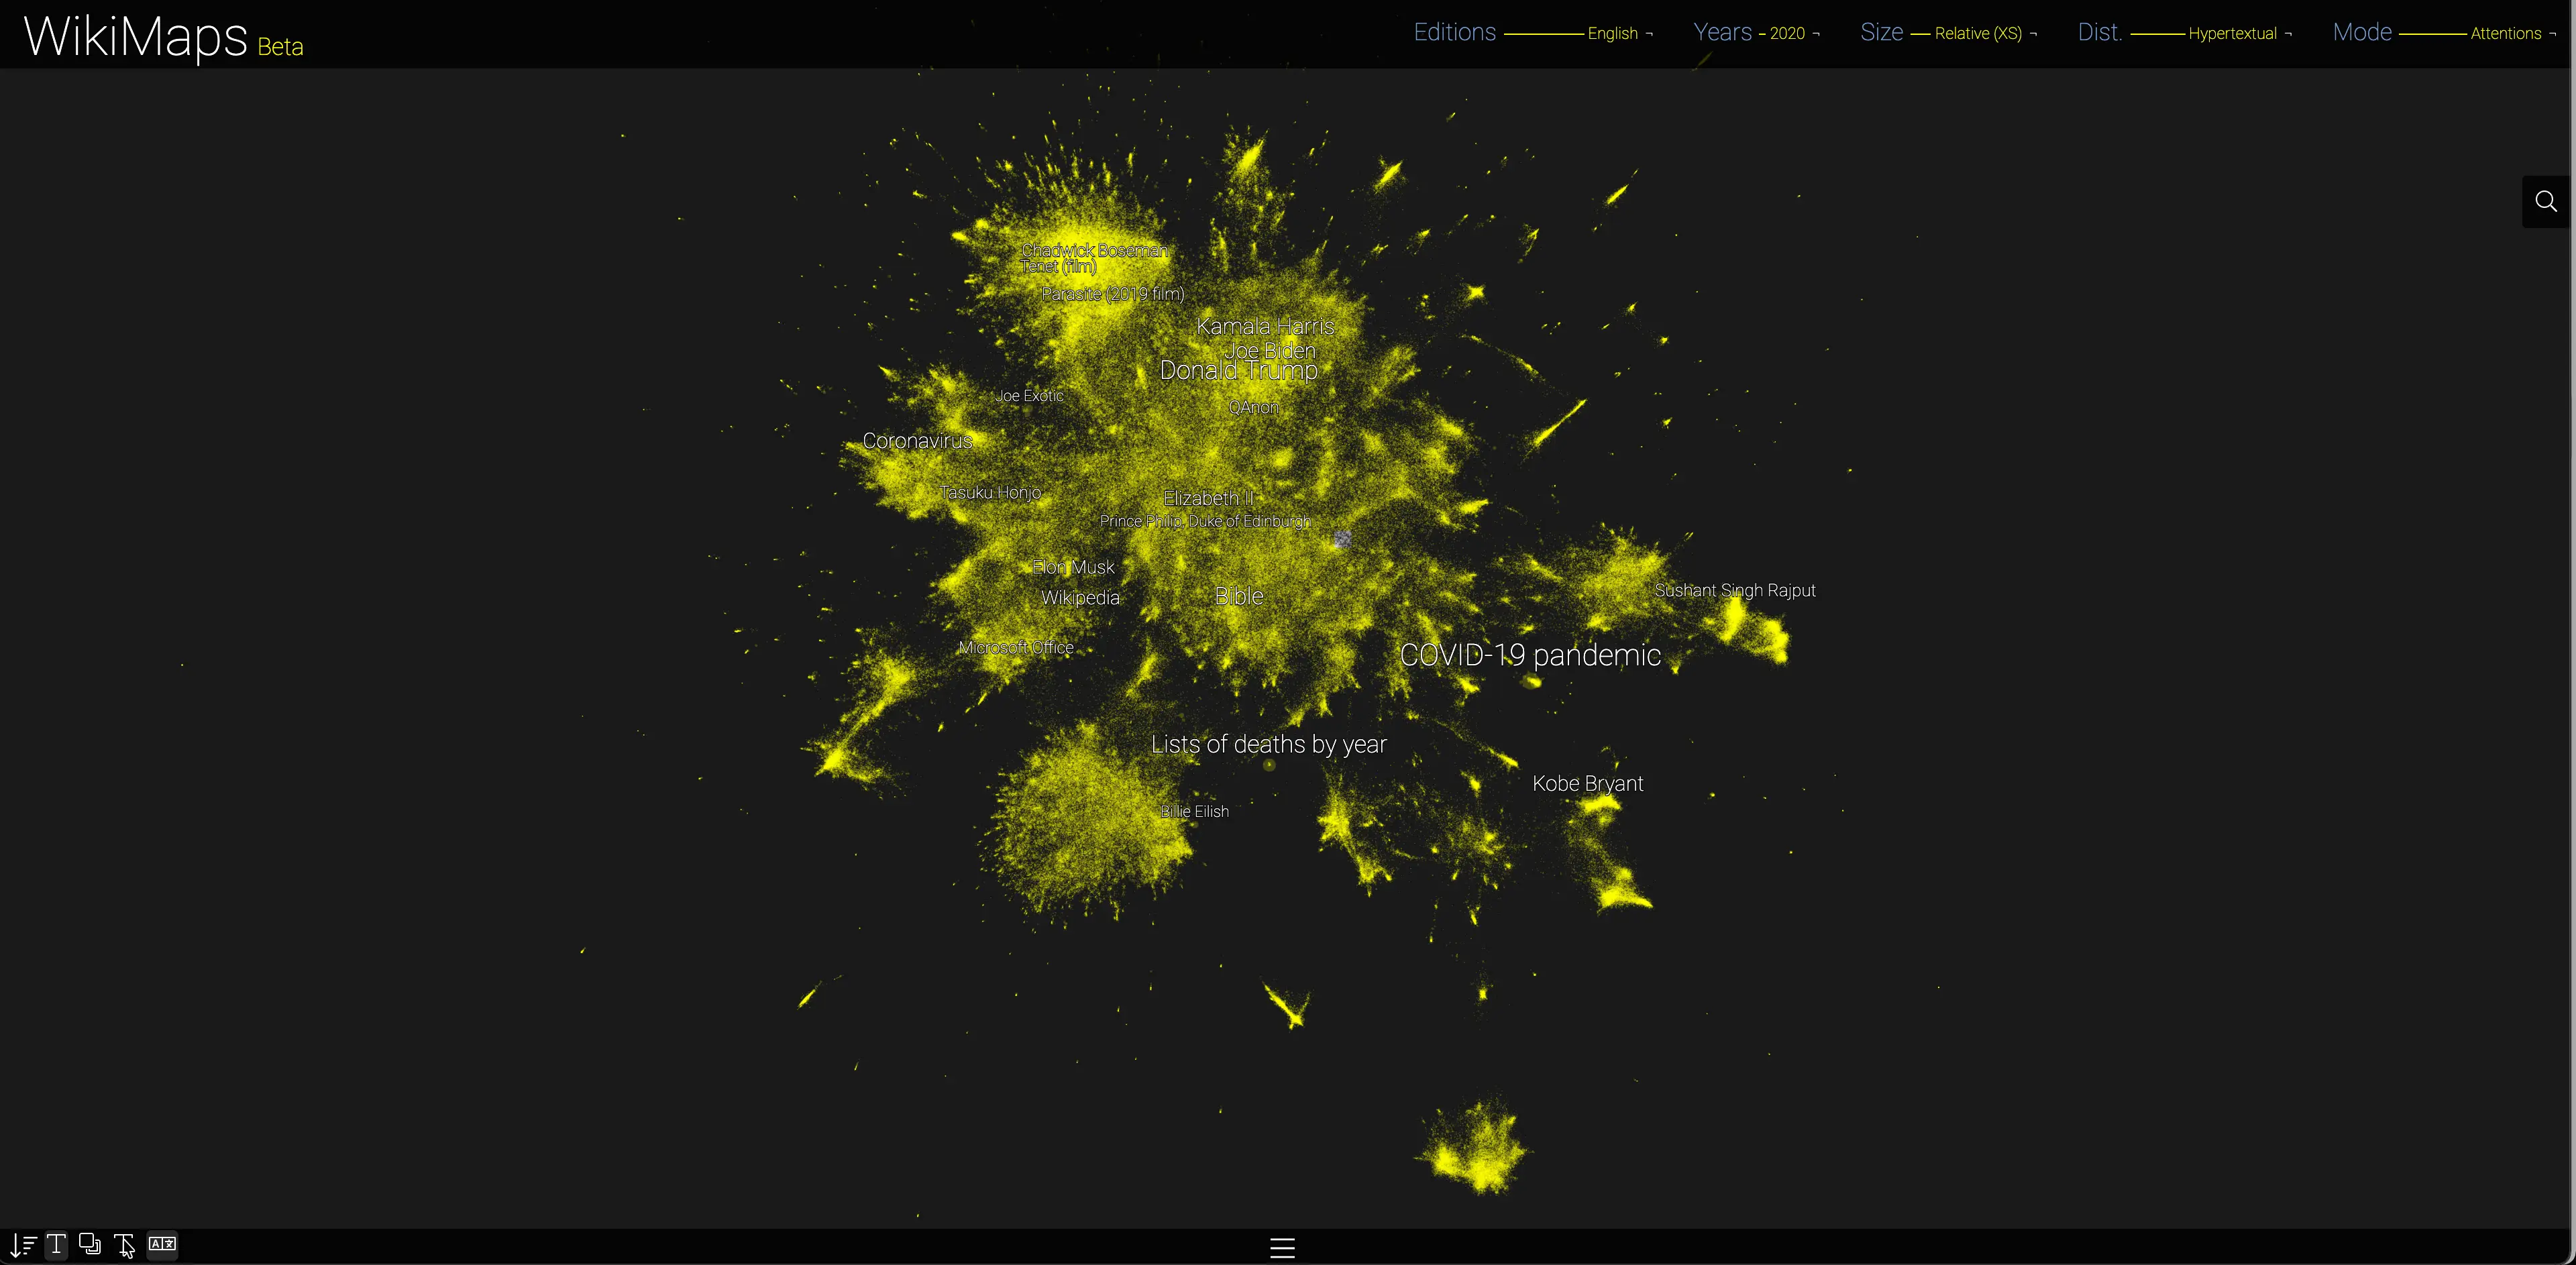
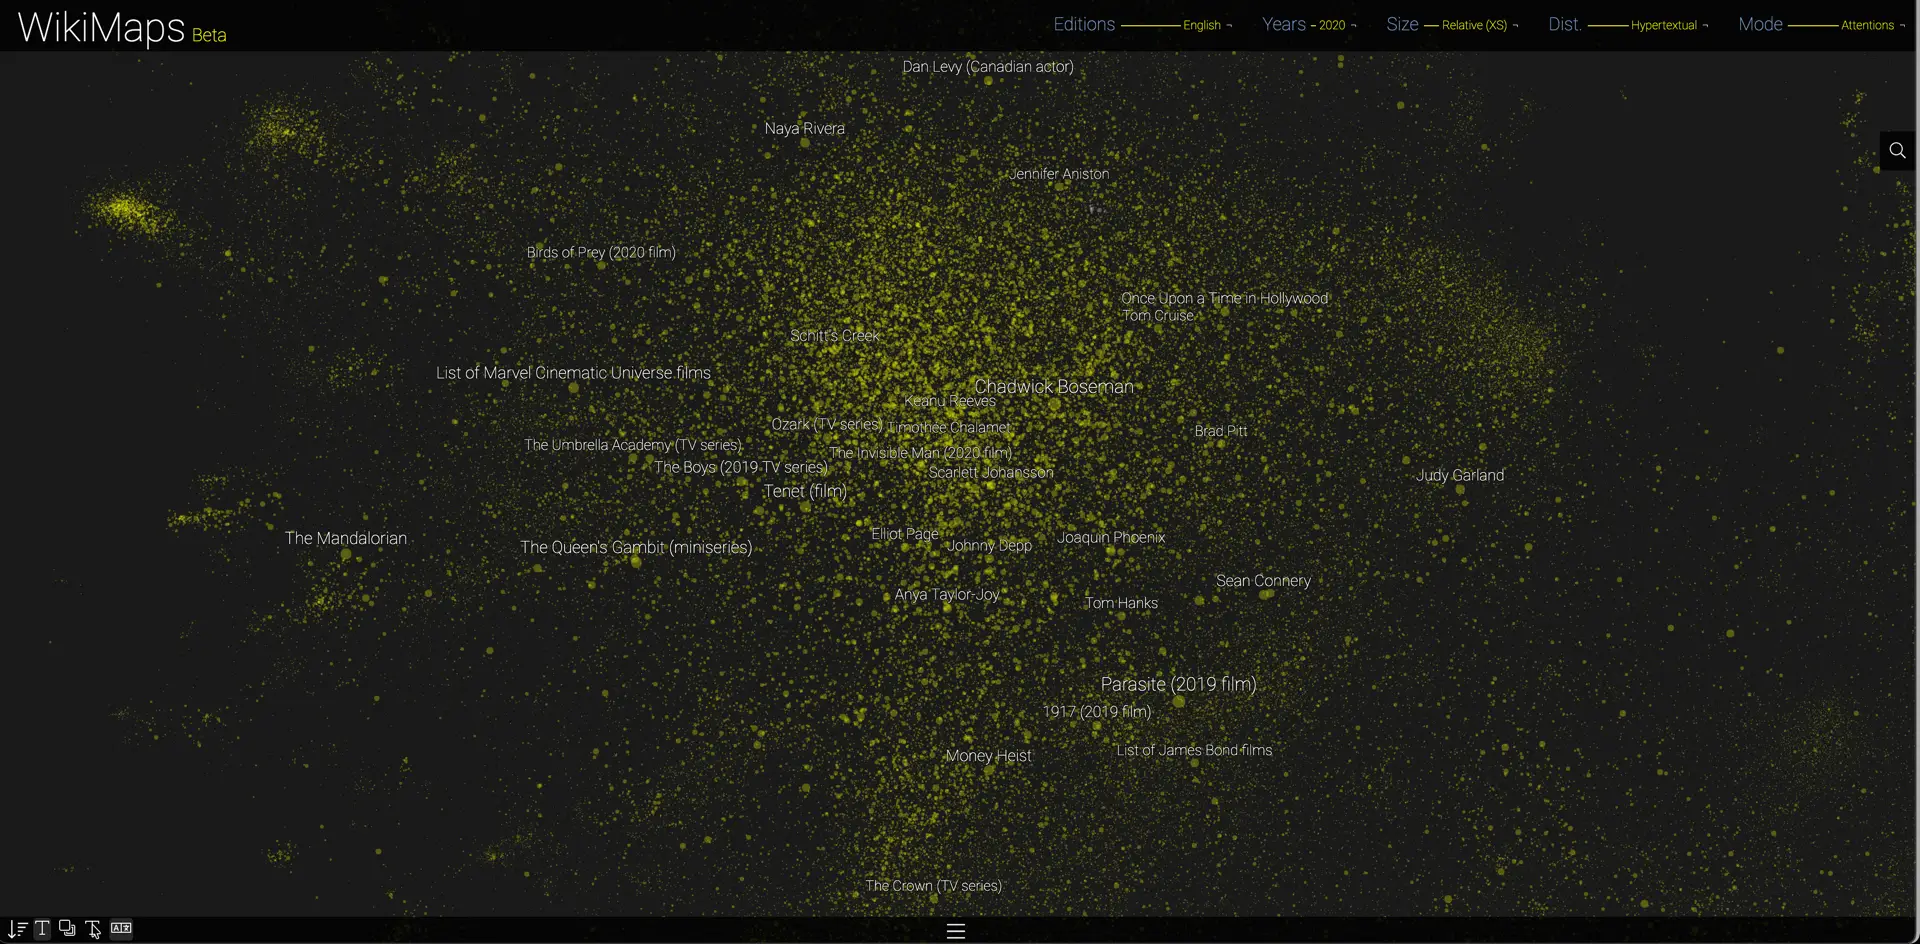
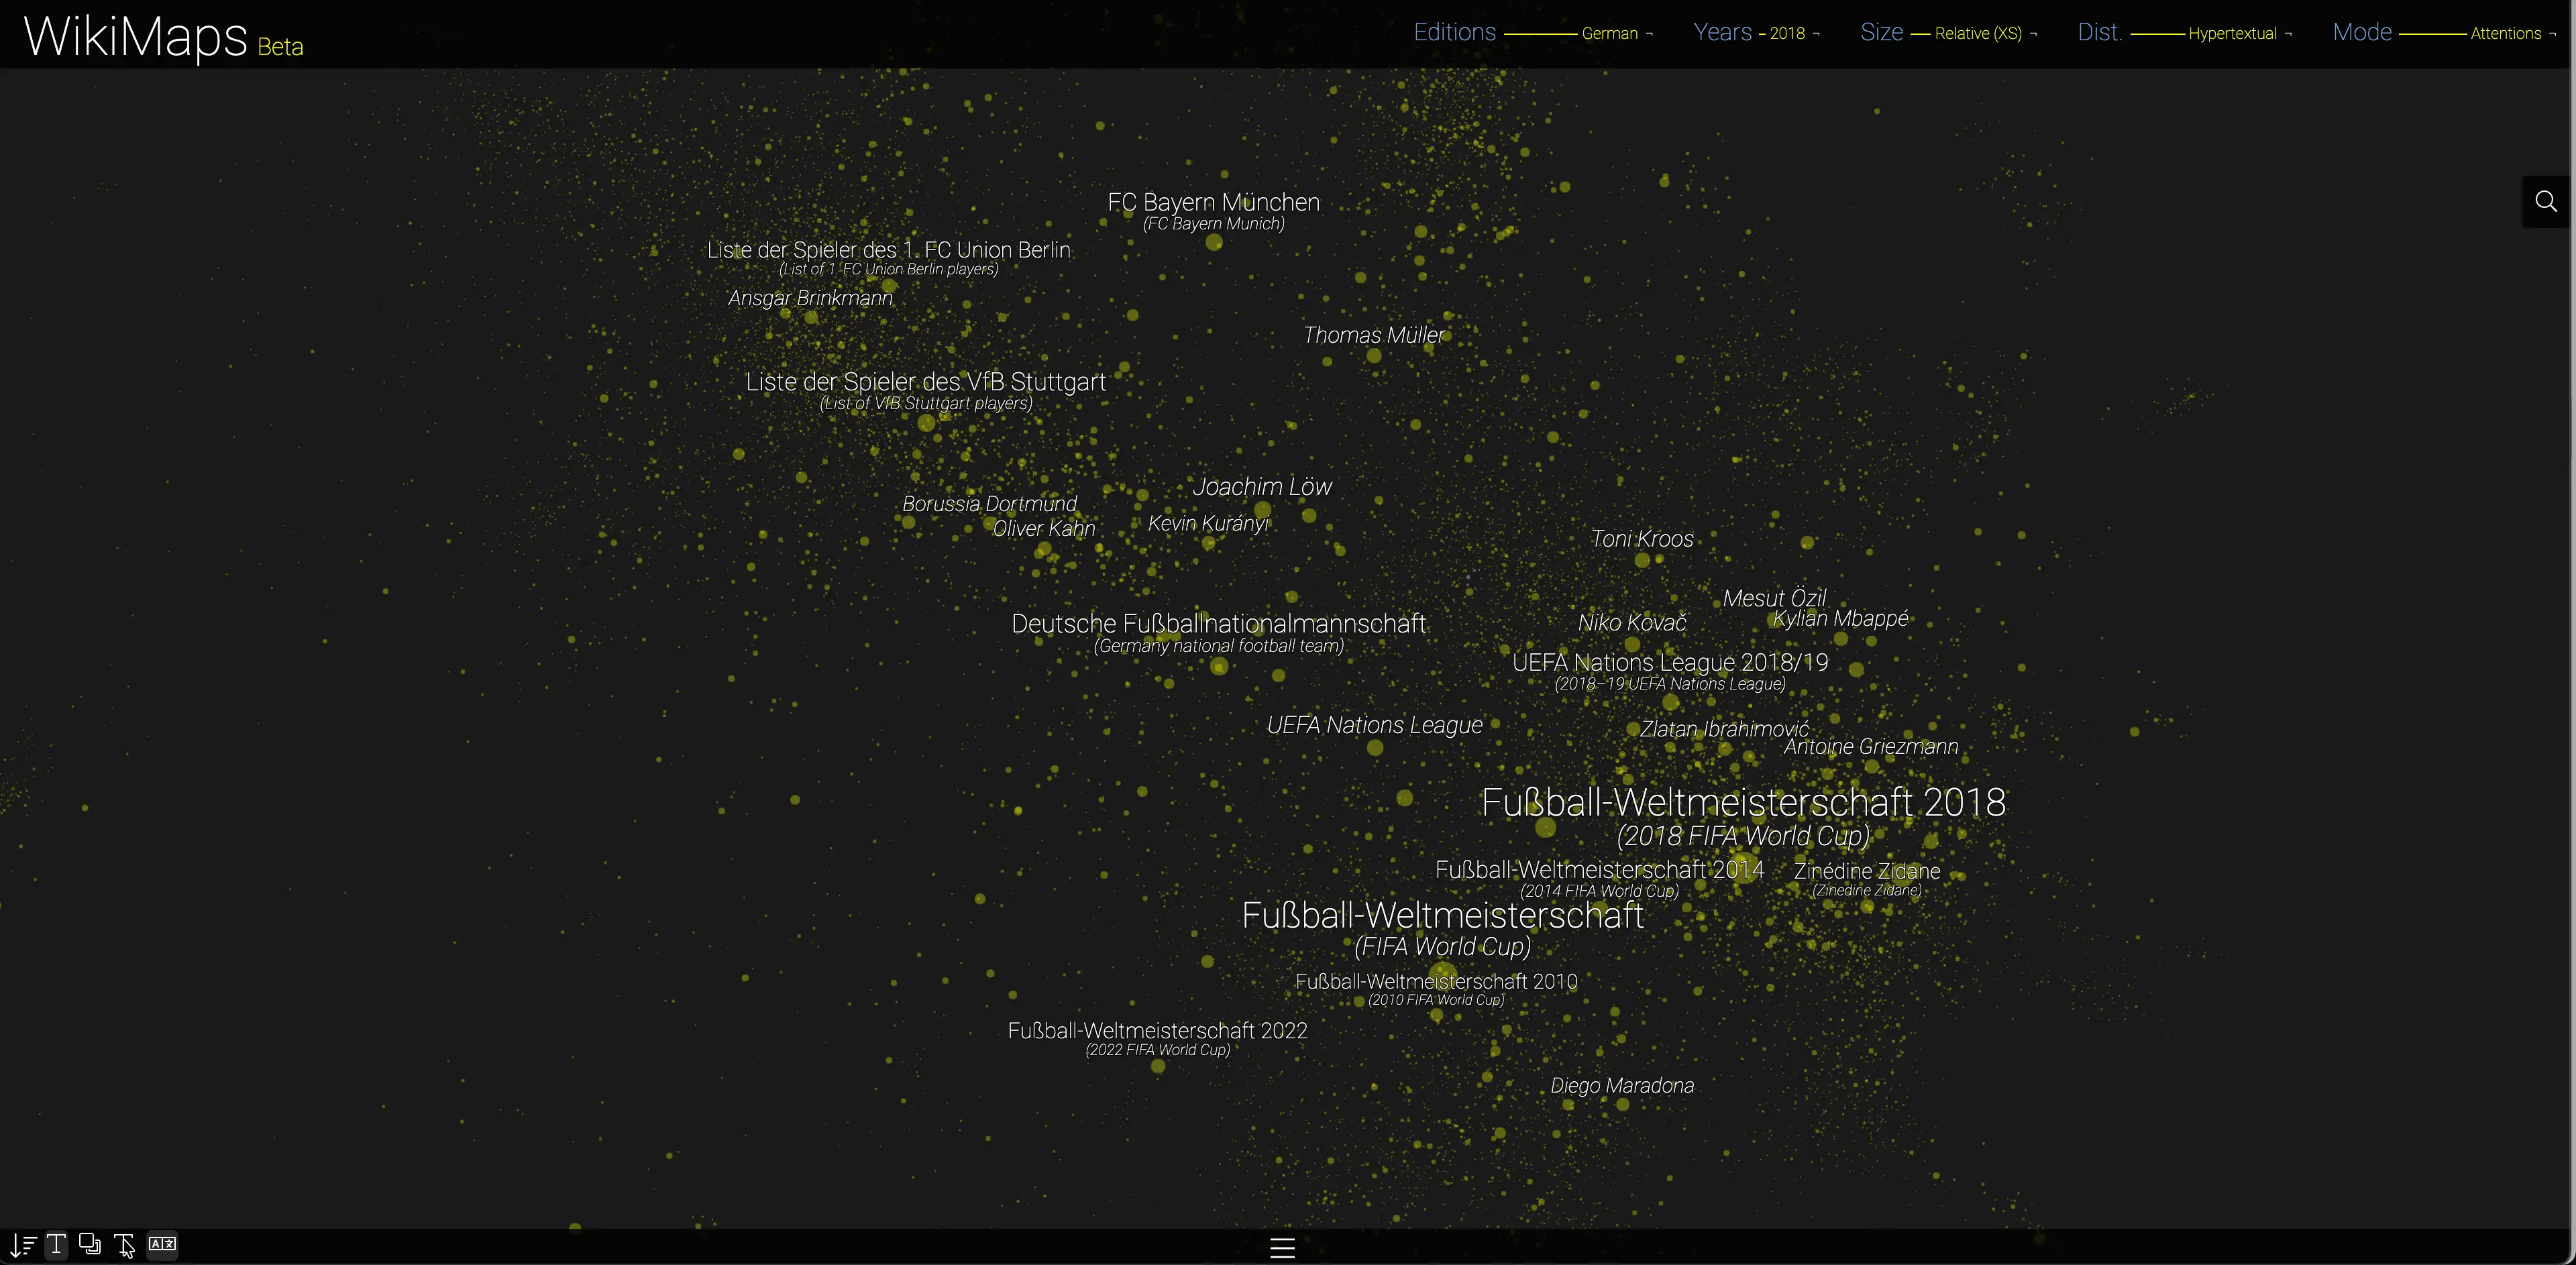
This projection uses the hyperlinks found in the pages to define their proximity. It draws on the billions of links between pages to define their relative positions. The two-dimensional spatialisation also uses UMAP. When links are so numerous, the advantage of UMAP is that it focuses on local clusters. We have nevertheless spent less time optimising this projection, which relies on a more conventional metric and has already been the subject of many other projects.
Modes
WikiMaps offers several exploration modes, from the most elementary to the most complex. These modes raise as many questions as there are corresponding points of view. They are Pages, Attentions, Global attentions, Events, Global events and Cyclic events (see below for details).
Modes 2008–2020 version
Pages
This mode explores pages without considering their pageviews. In this mode, the hierarchy between pages is limited to their length (in characters). It makes it possible to consider the supply of content, before looking more specifically at how it is viewed.
Attentions
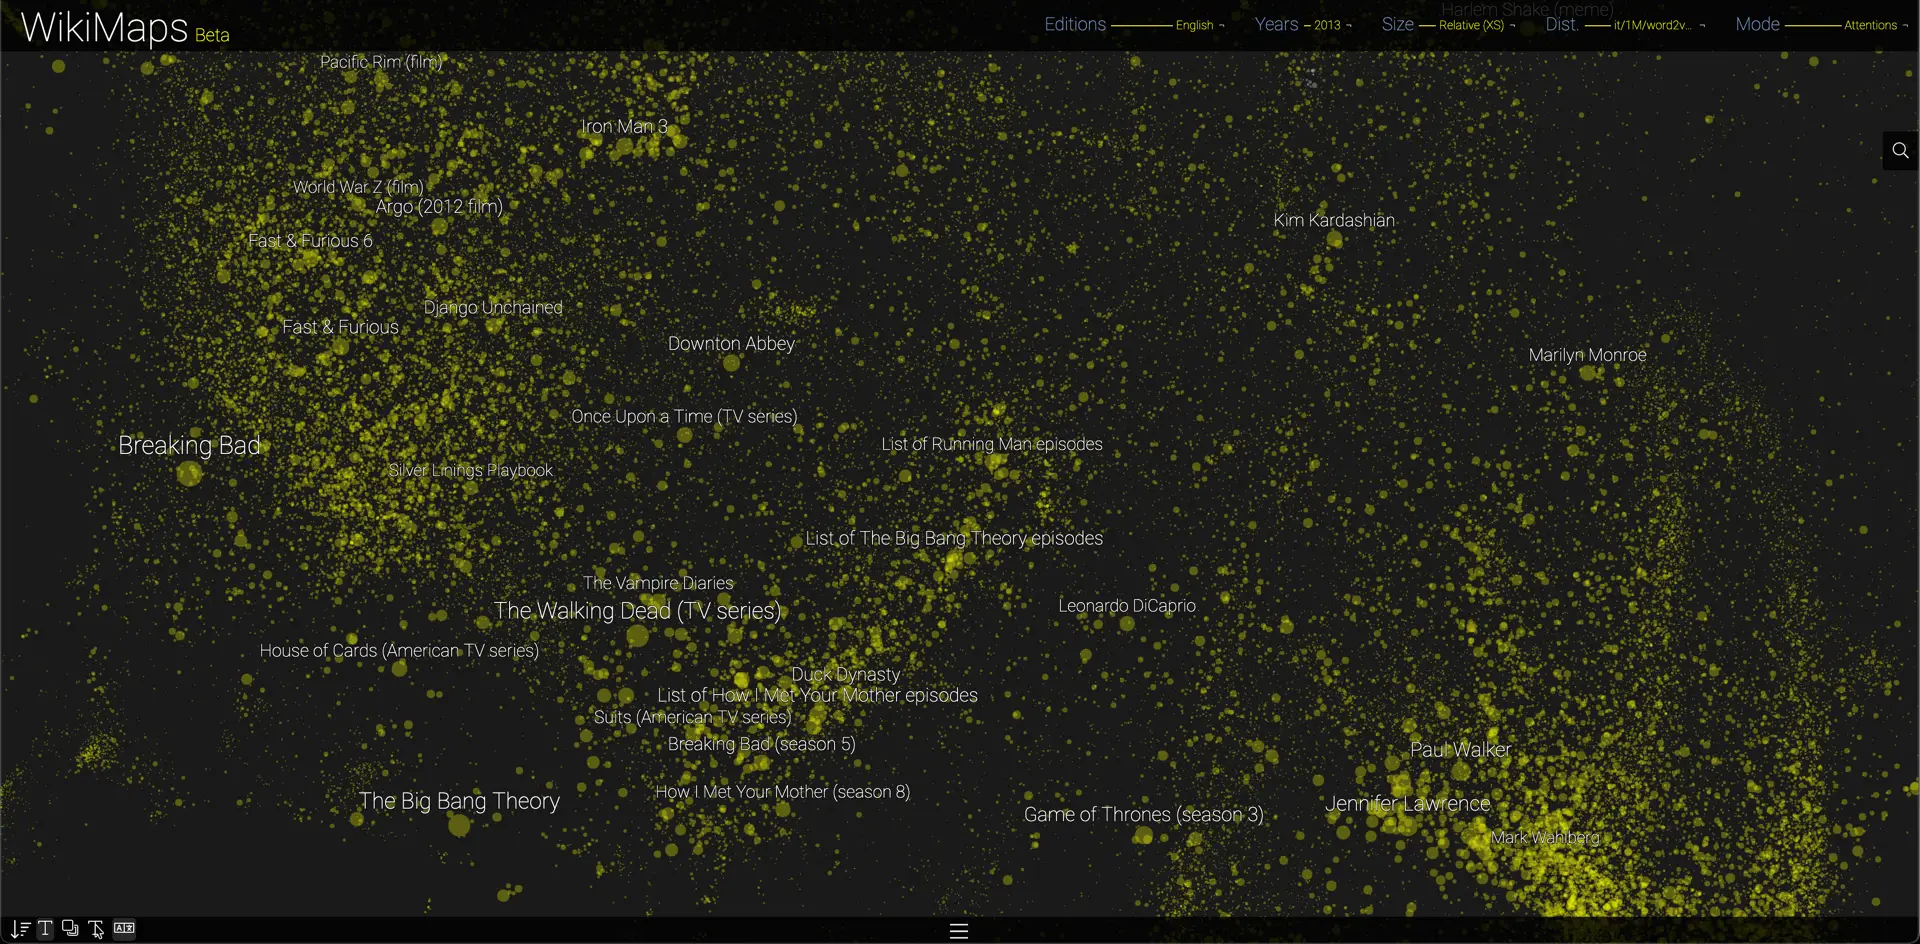
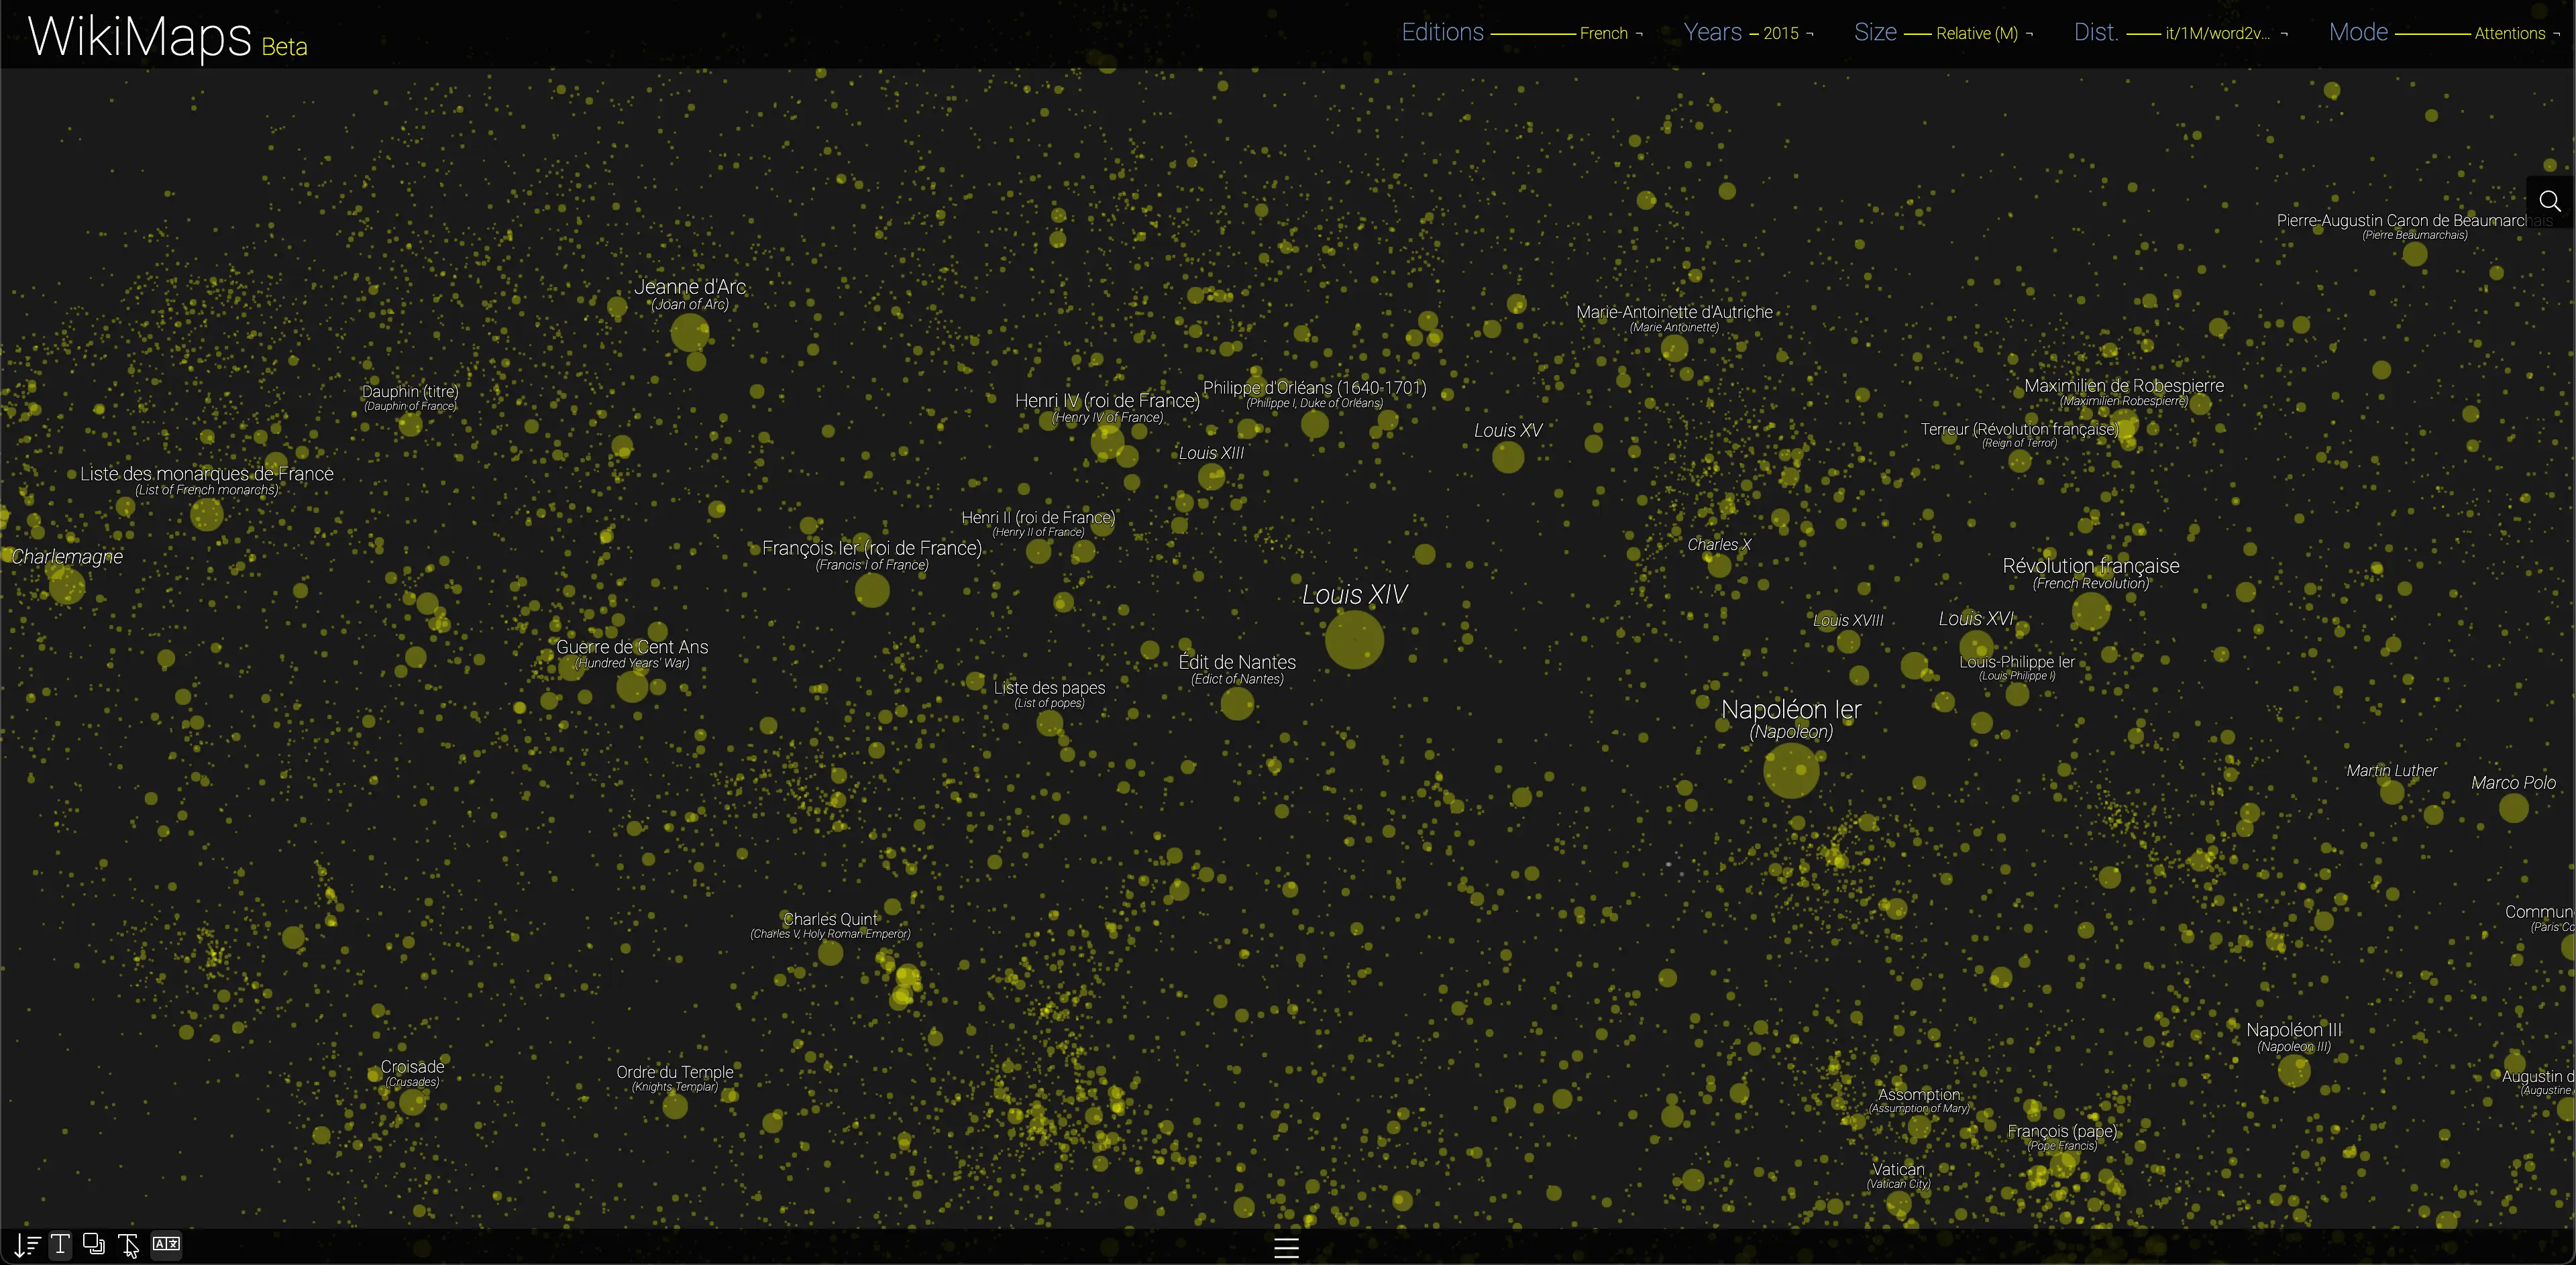
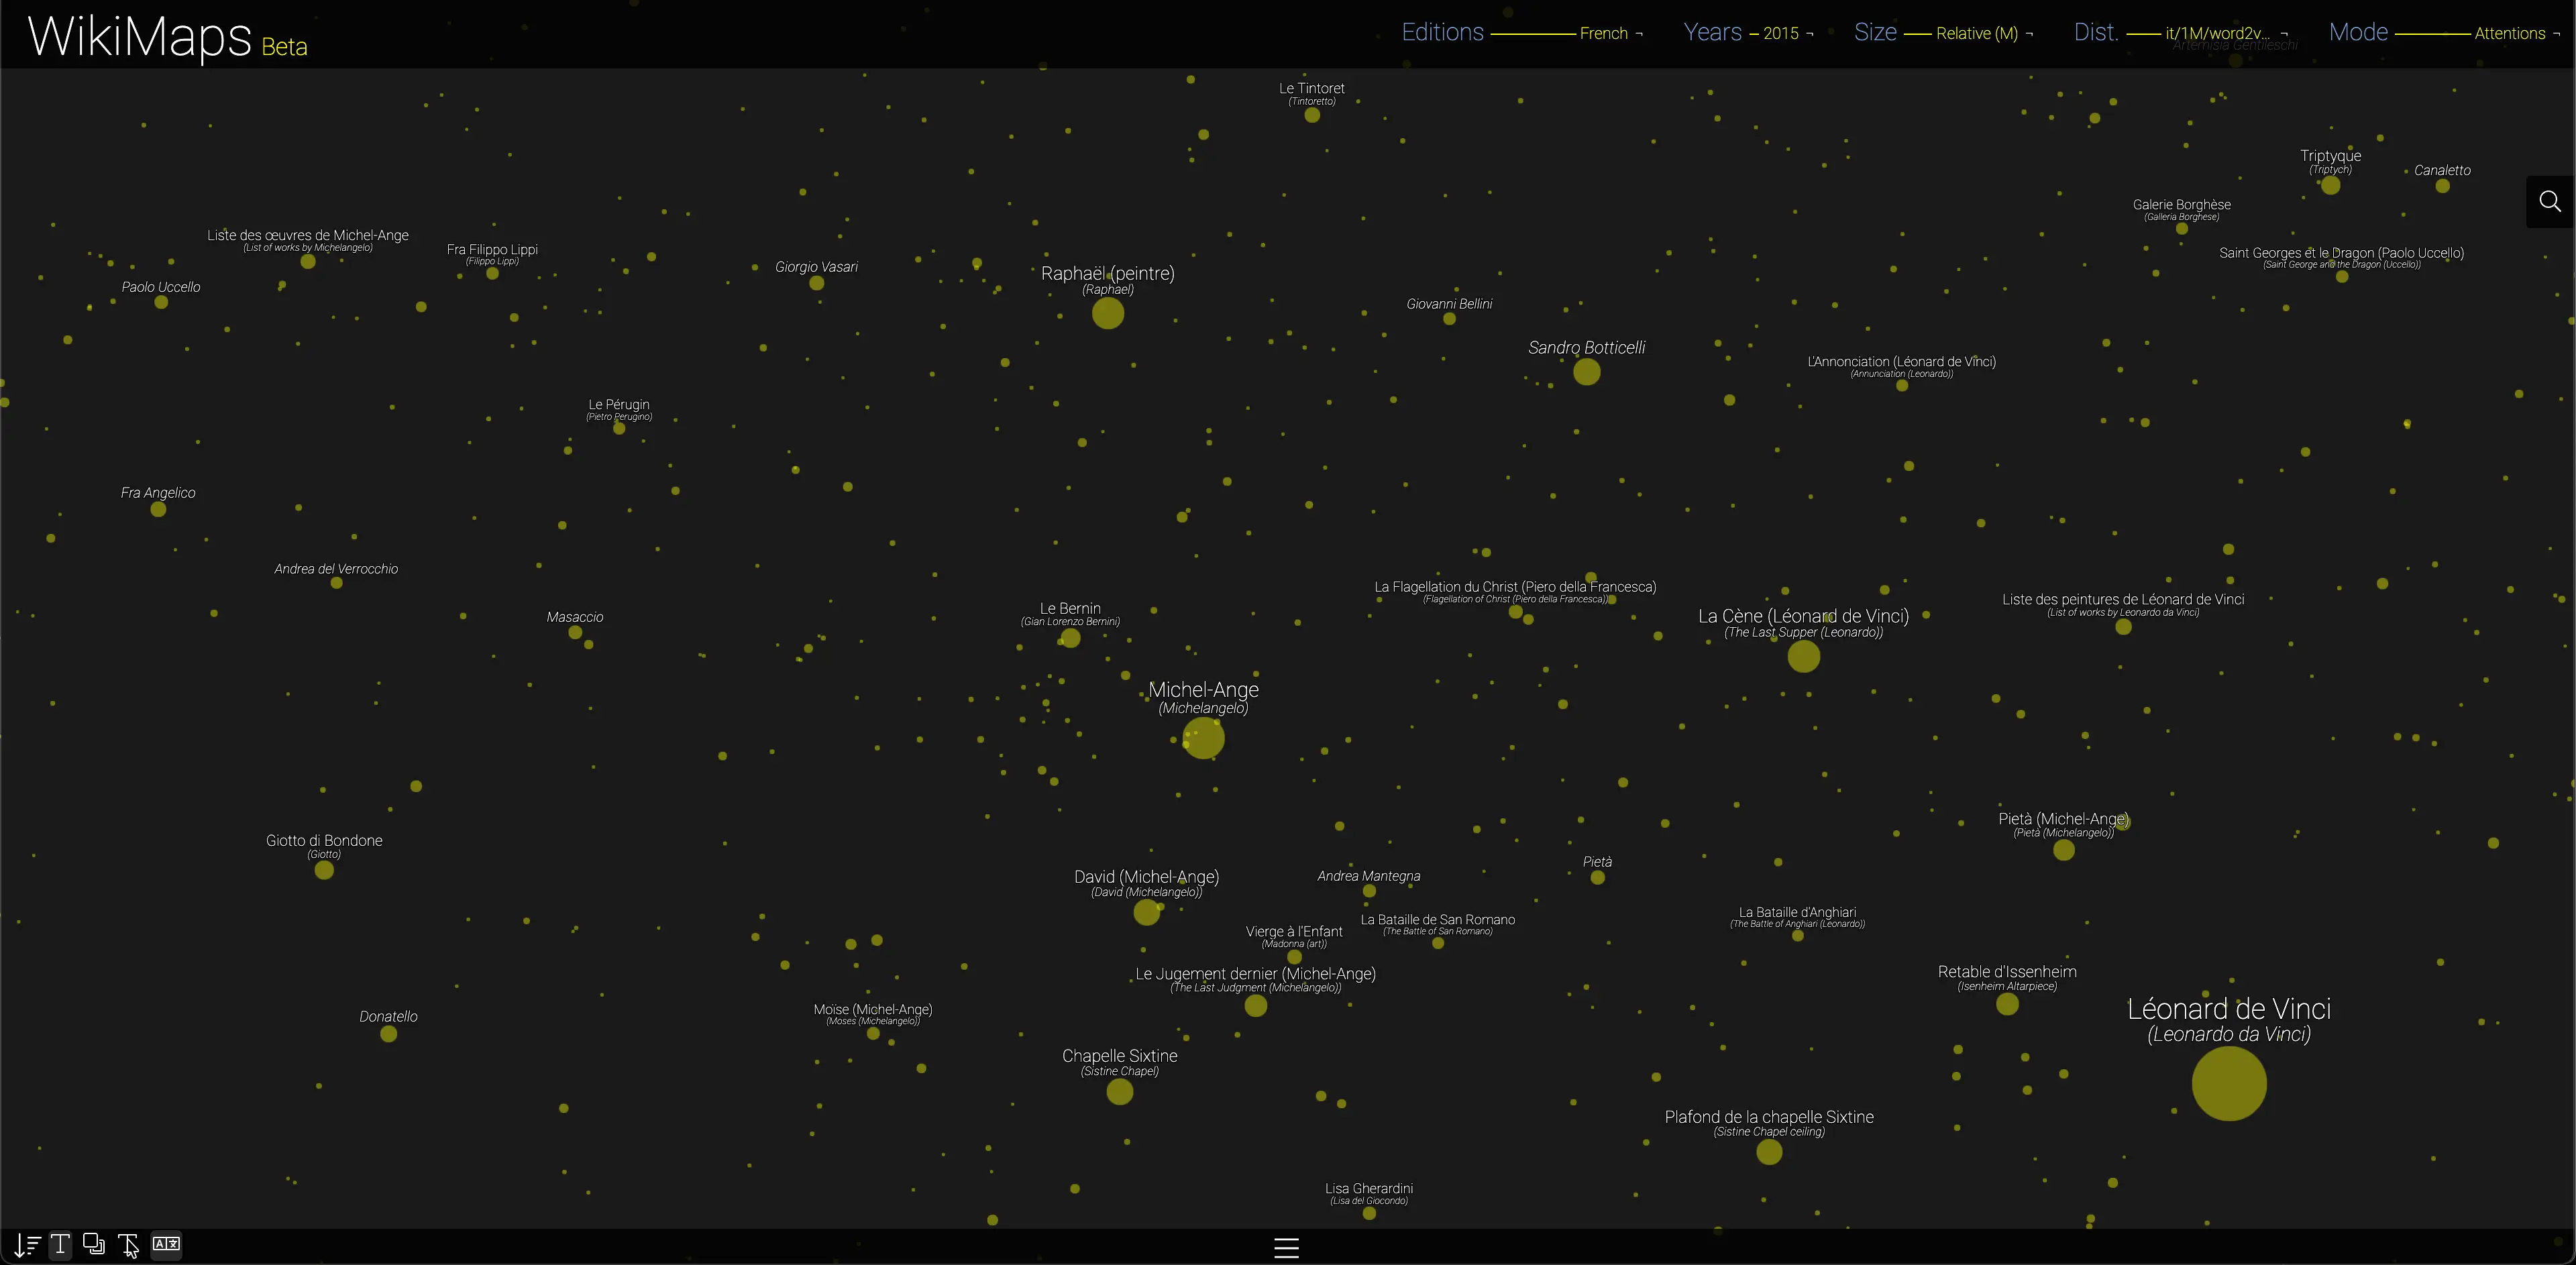
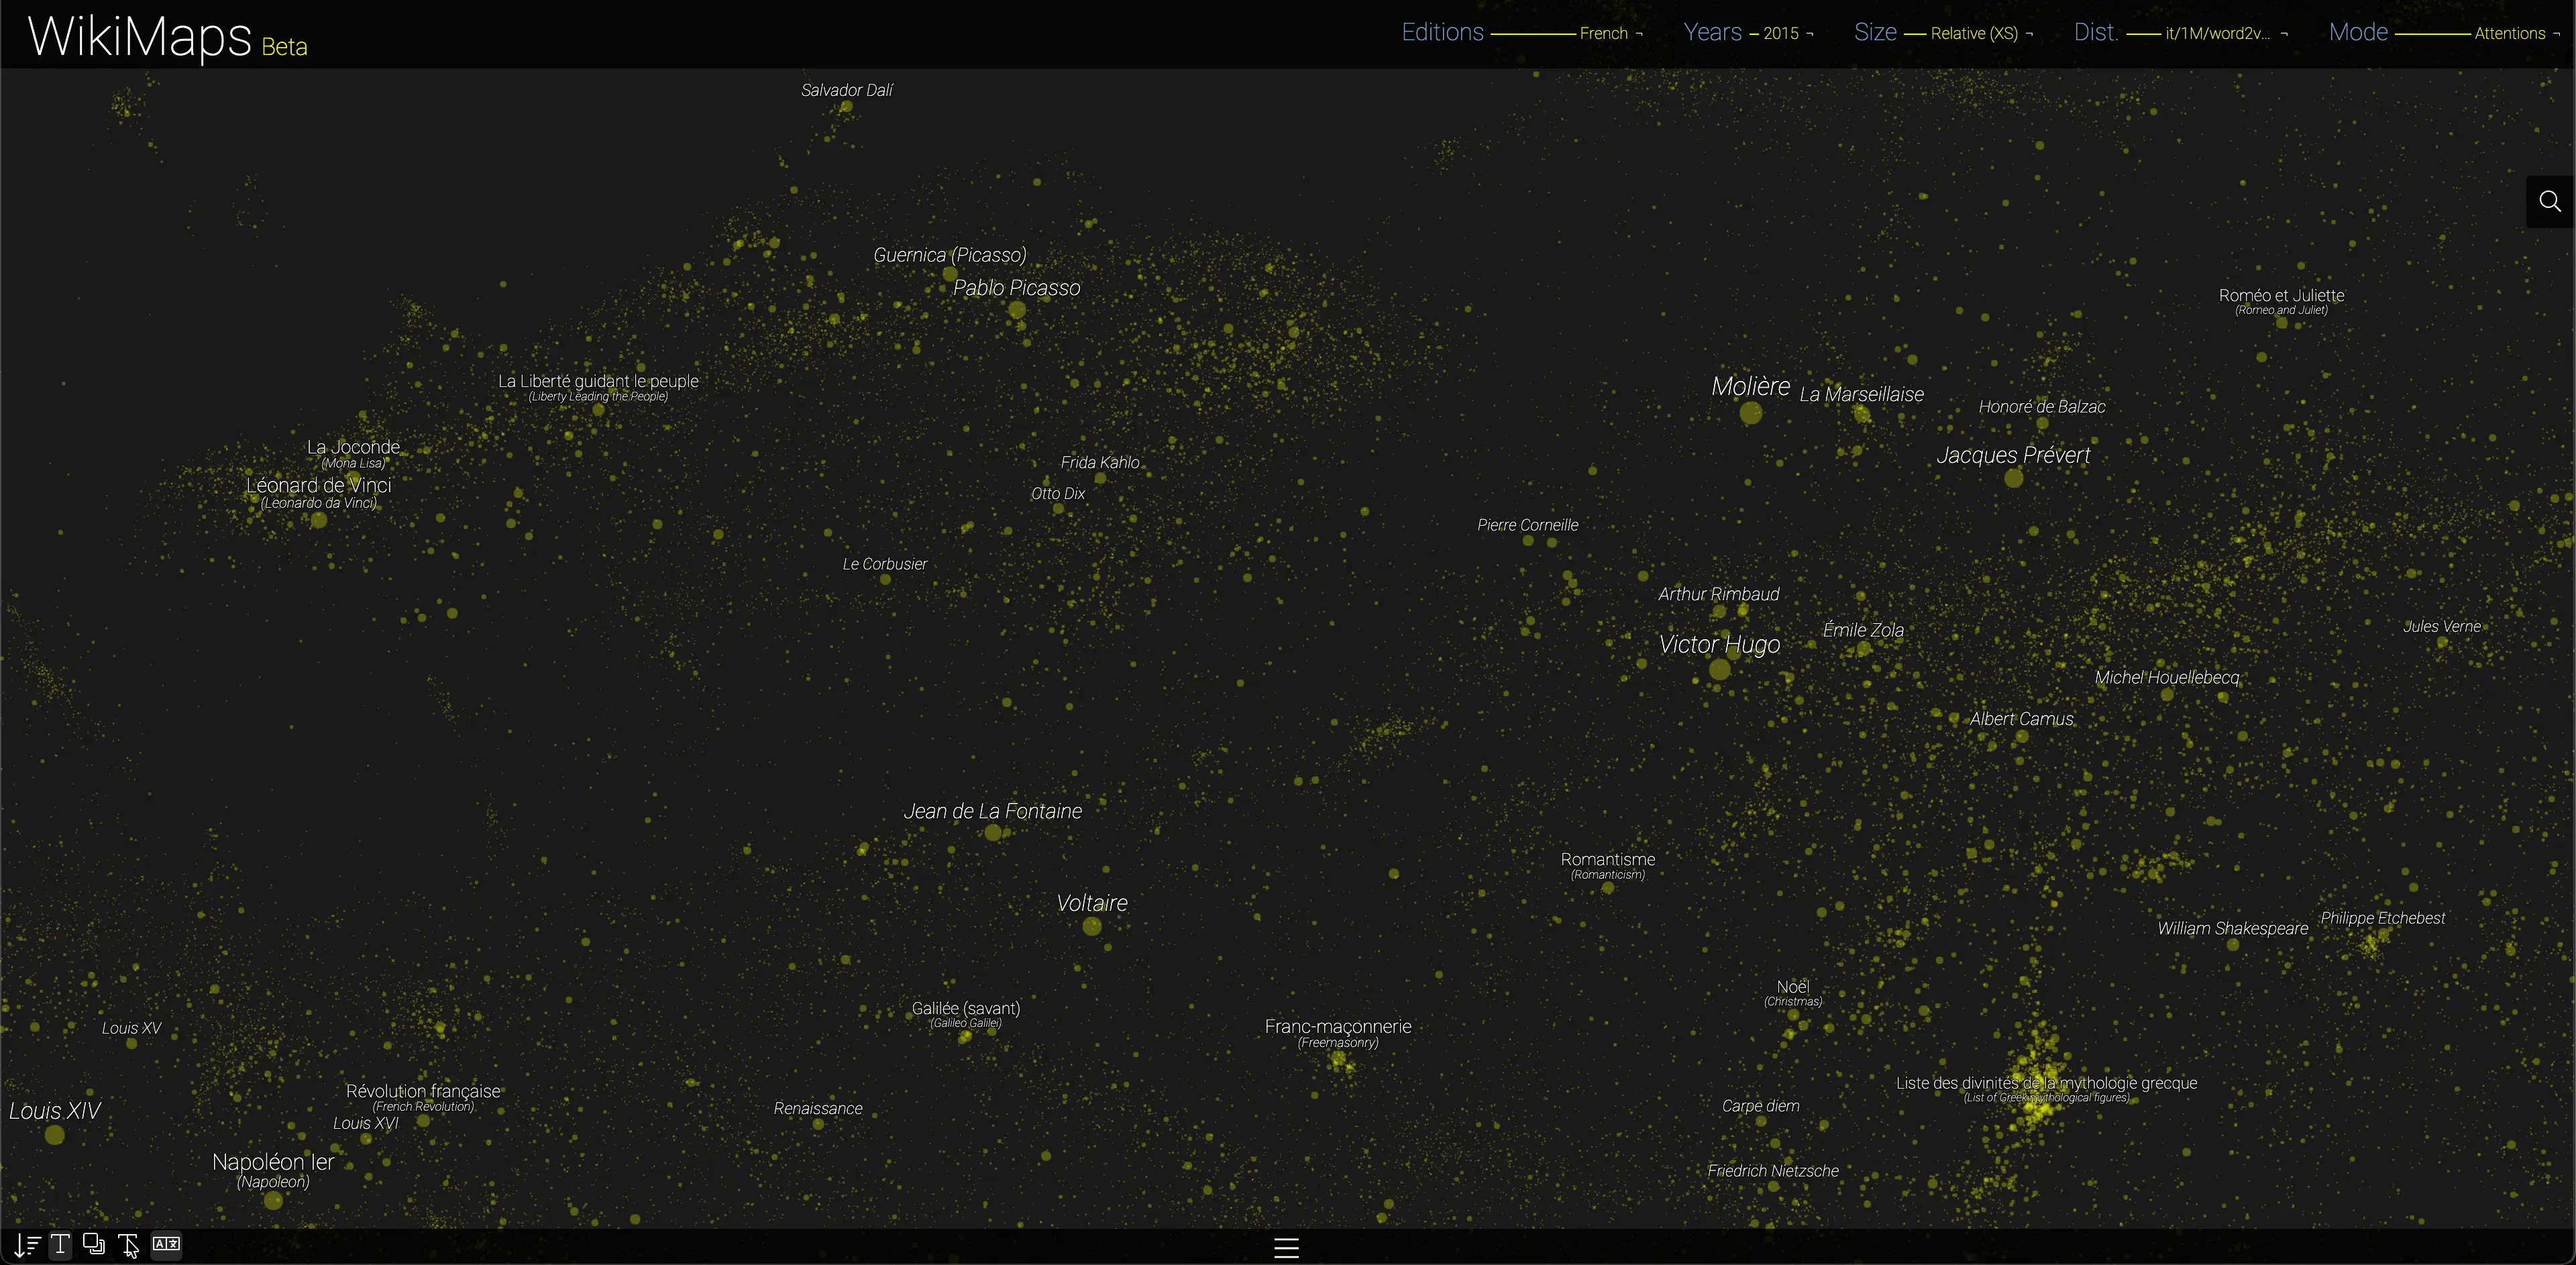
This mode explores pages according to the importance of their annual pageviews. It is the most central mode of WikiMaps, on which the more advanced modes are built.
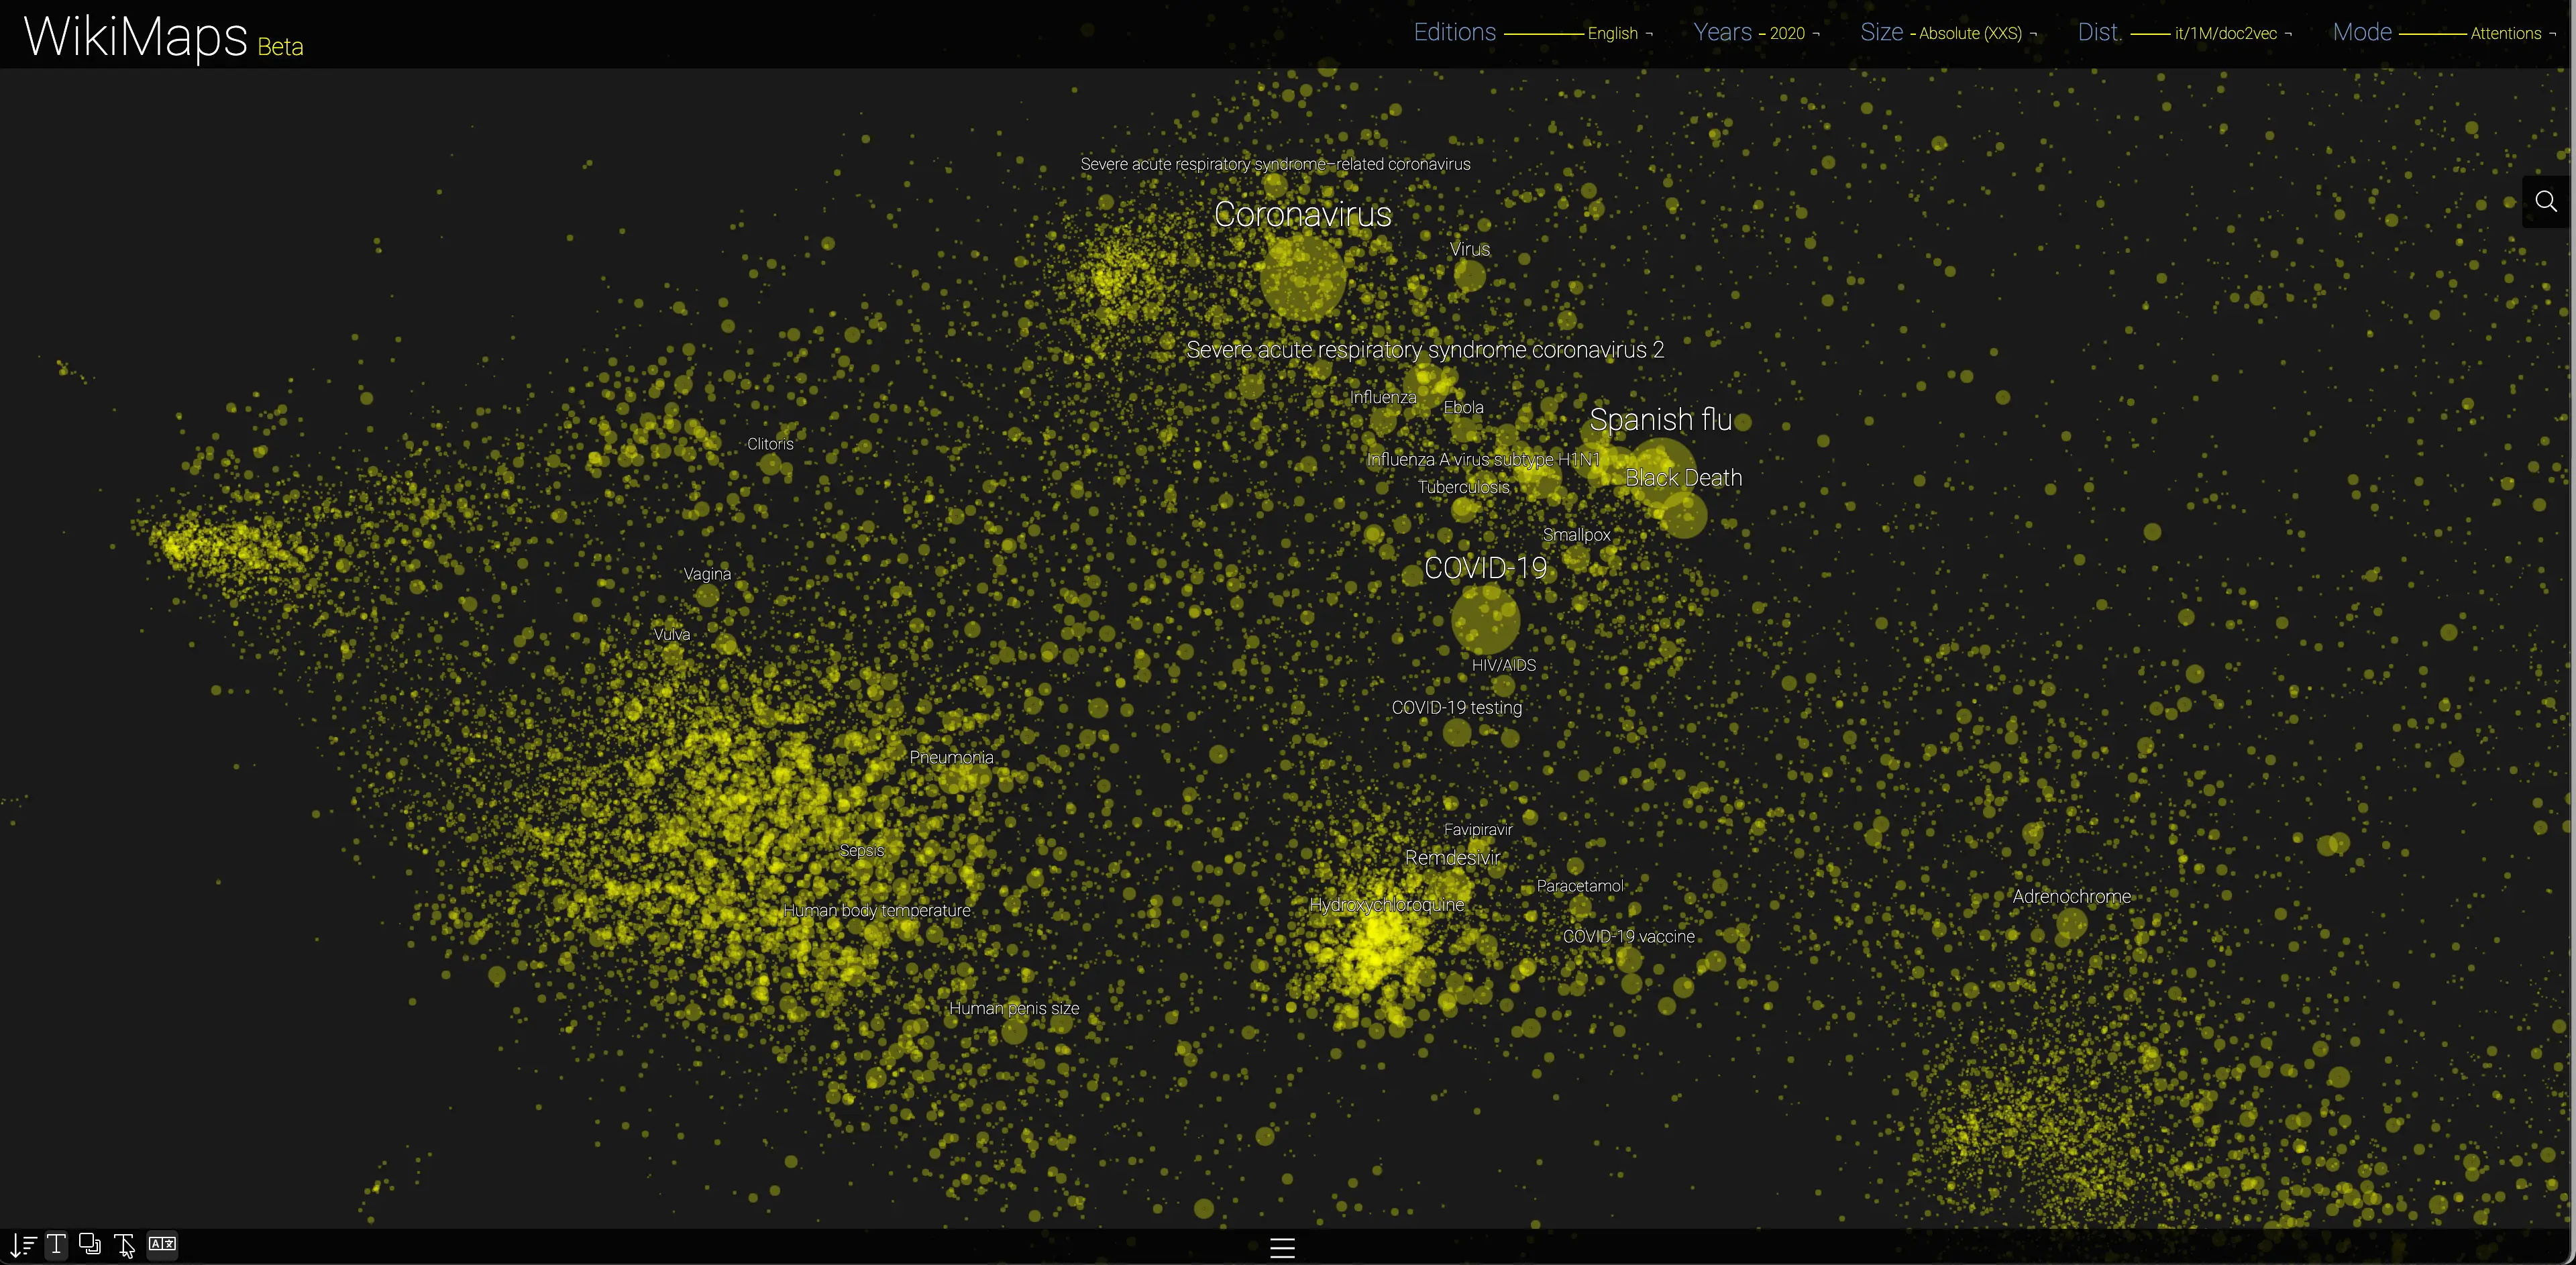
It is thus possible to compare the evolution of attention in a field, such as health. The differences in attention between 2019 (on the left) and 2020 (on the right) are particularly striking with the coronavirus epidemic.
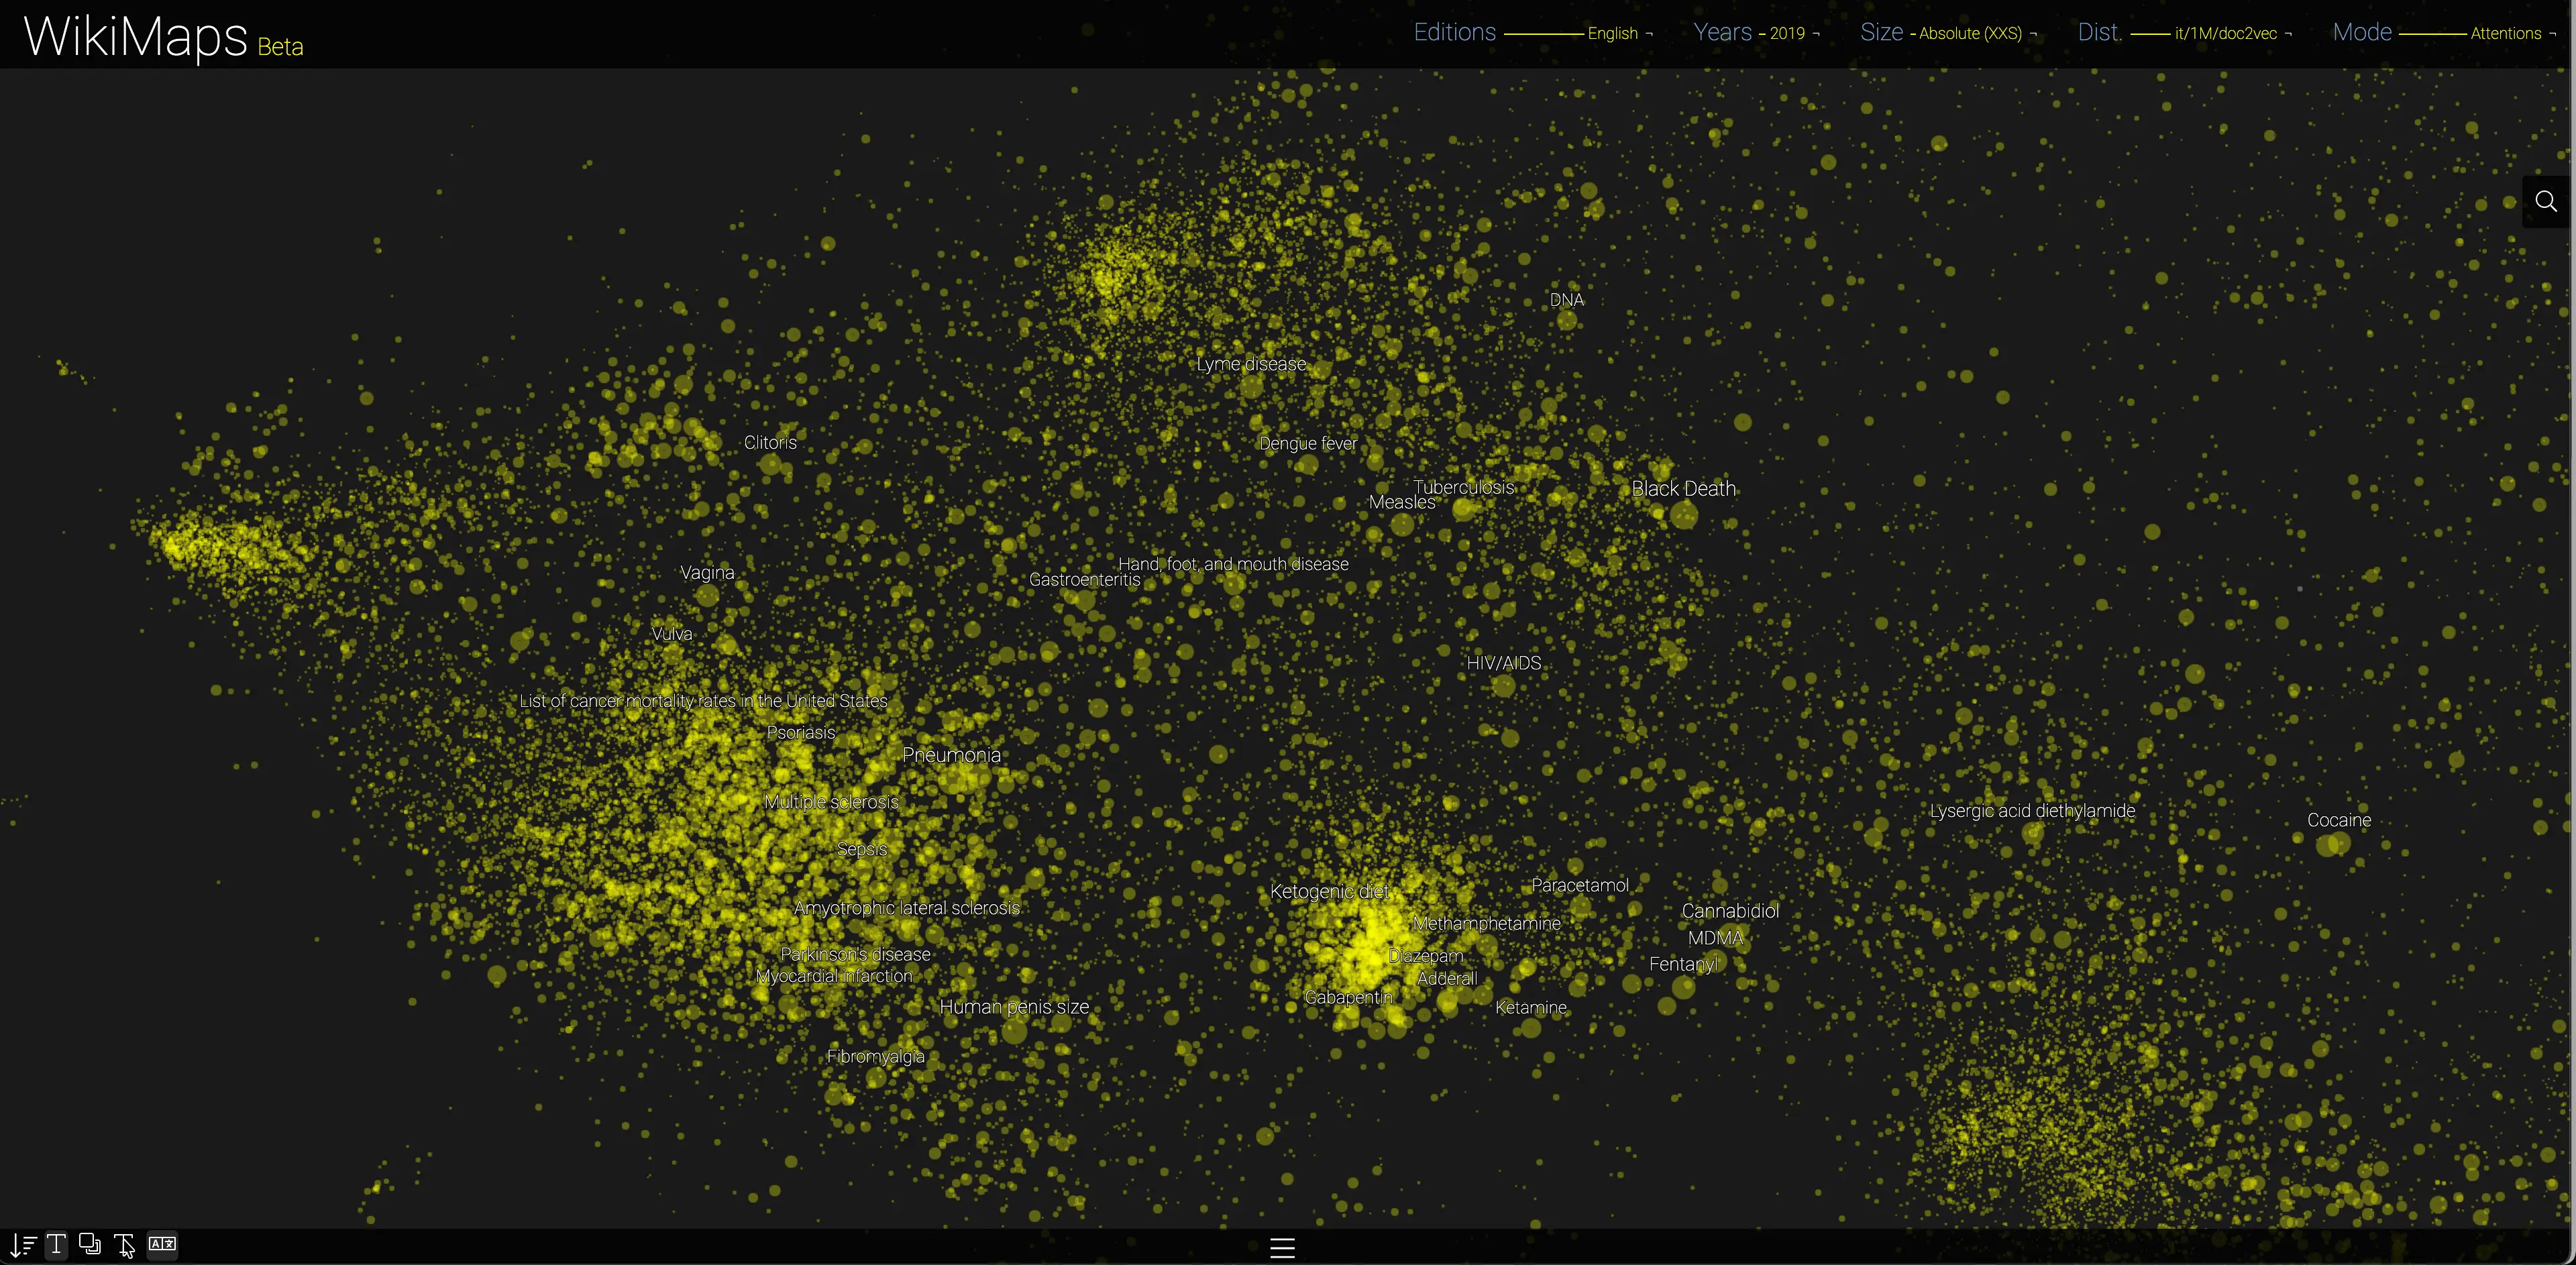
English - 2019 - Intertextual - Attentions
English - 2020 - Intertextual - Attentions
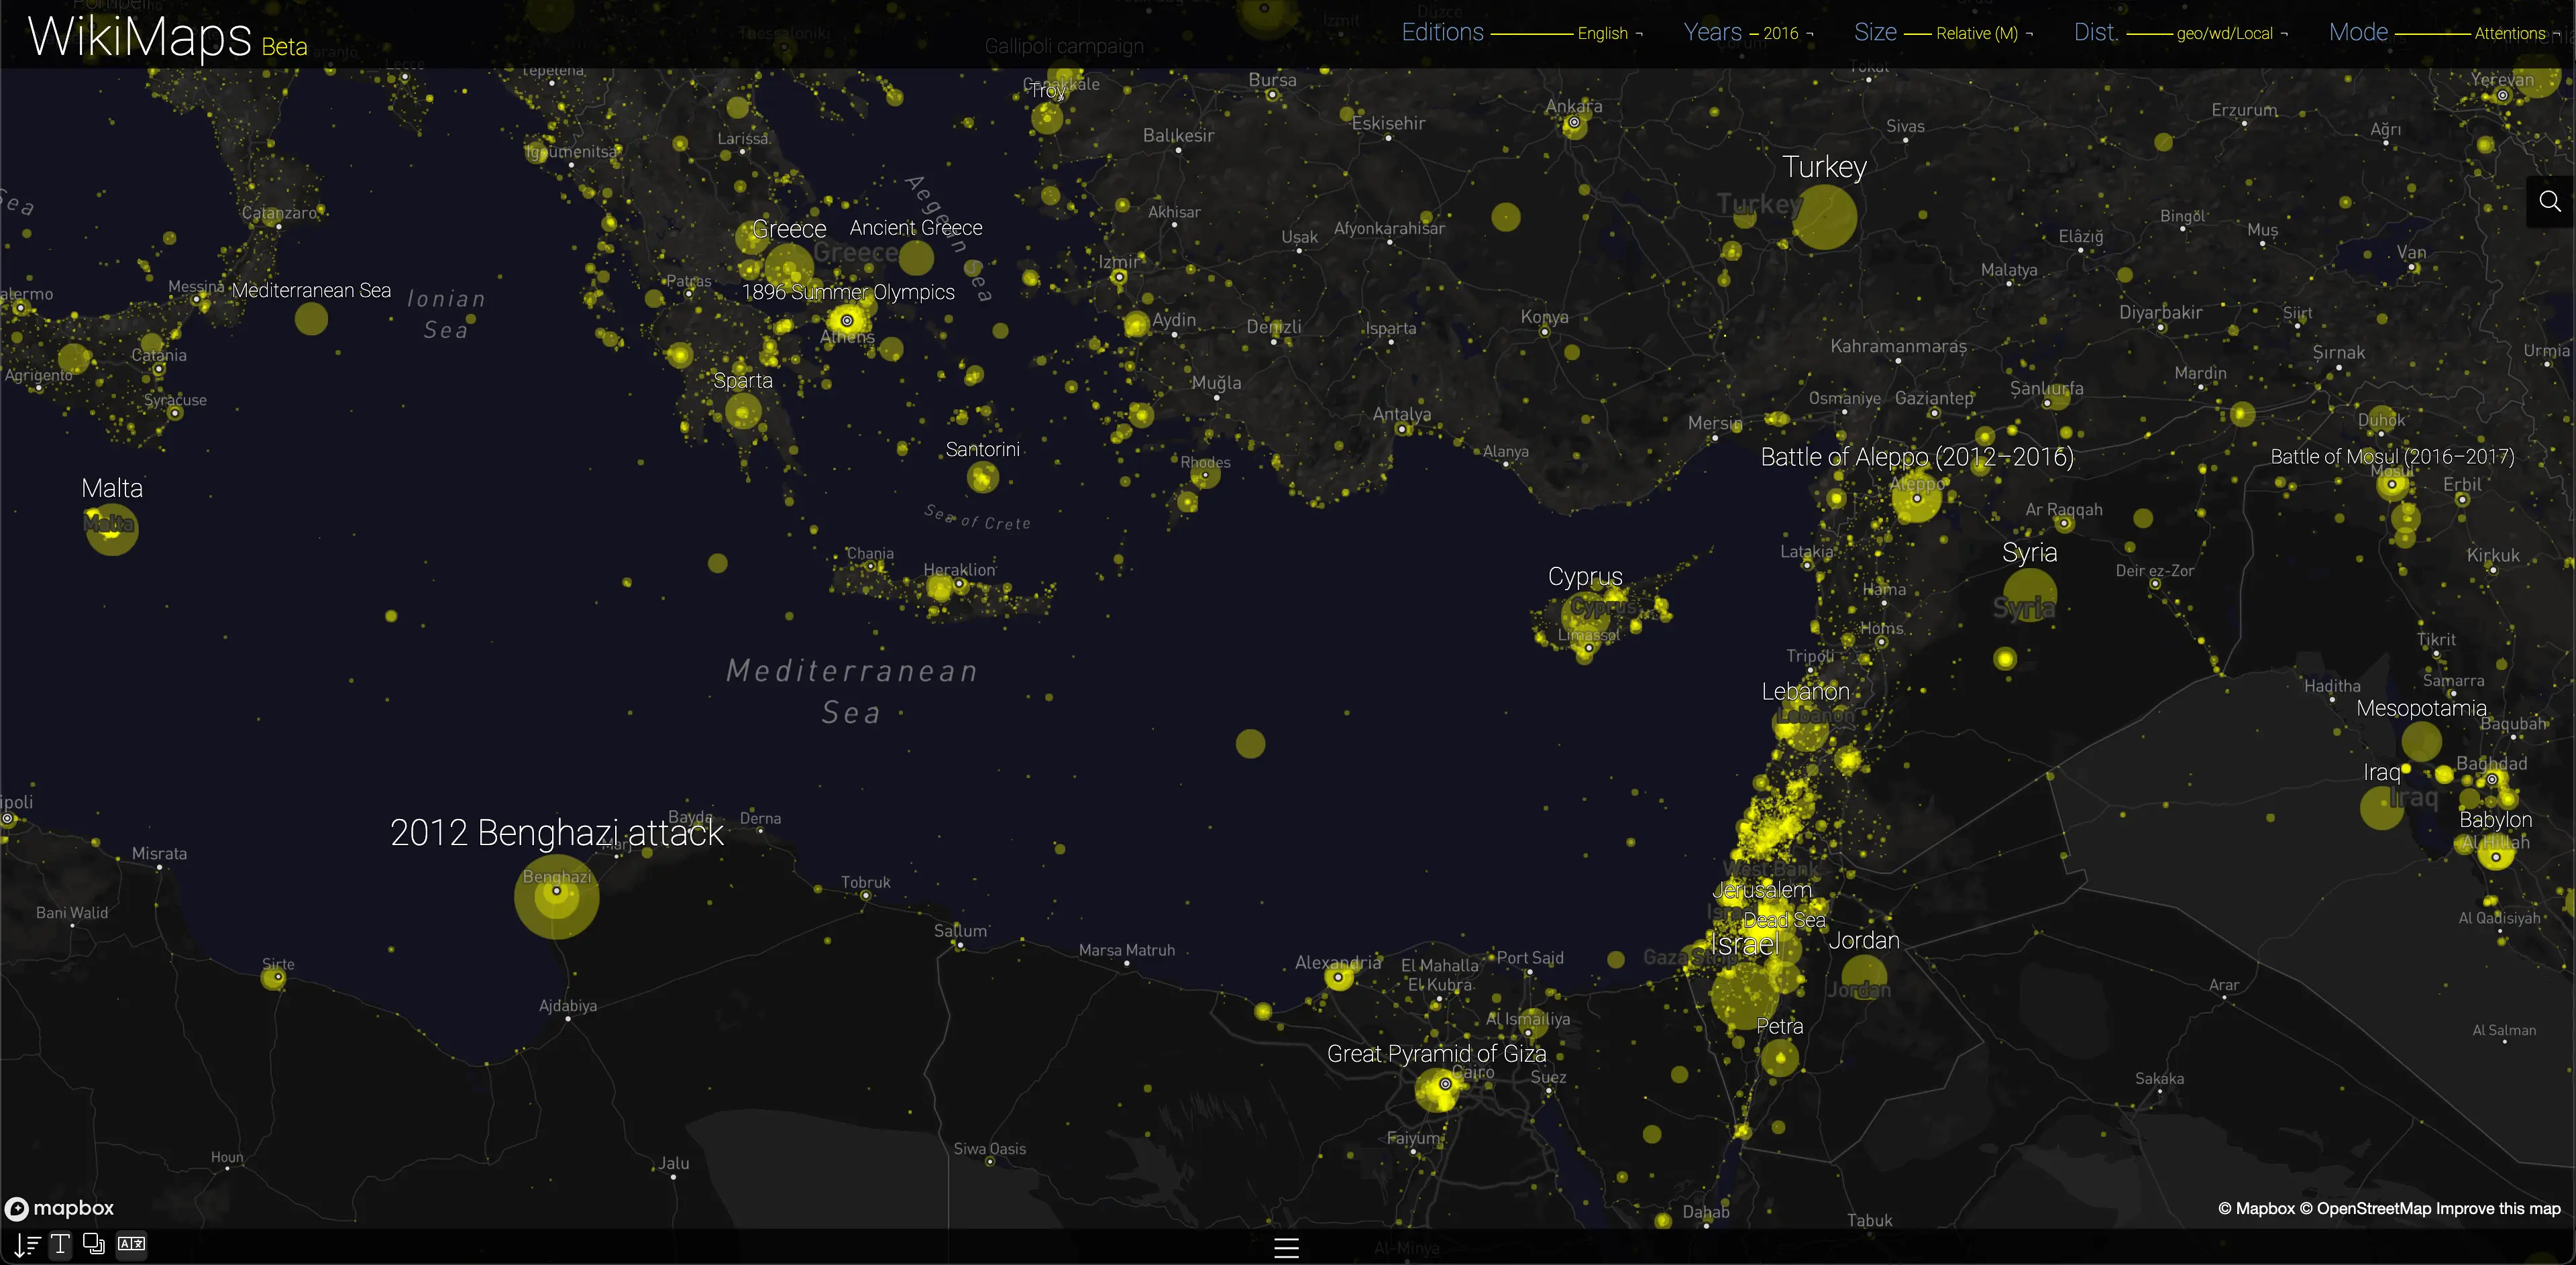
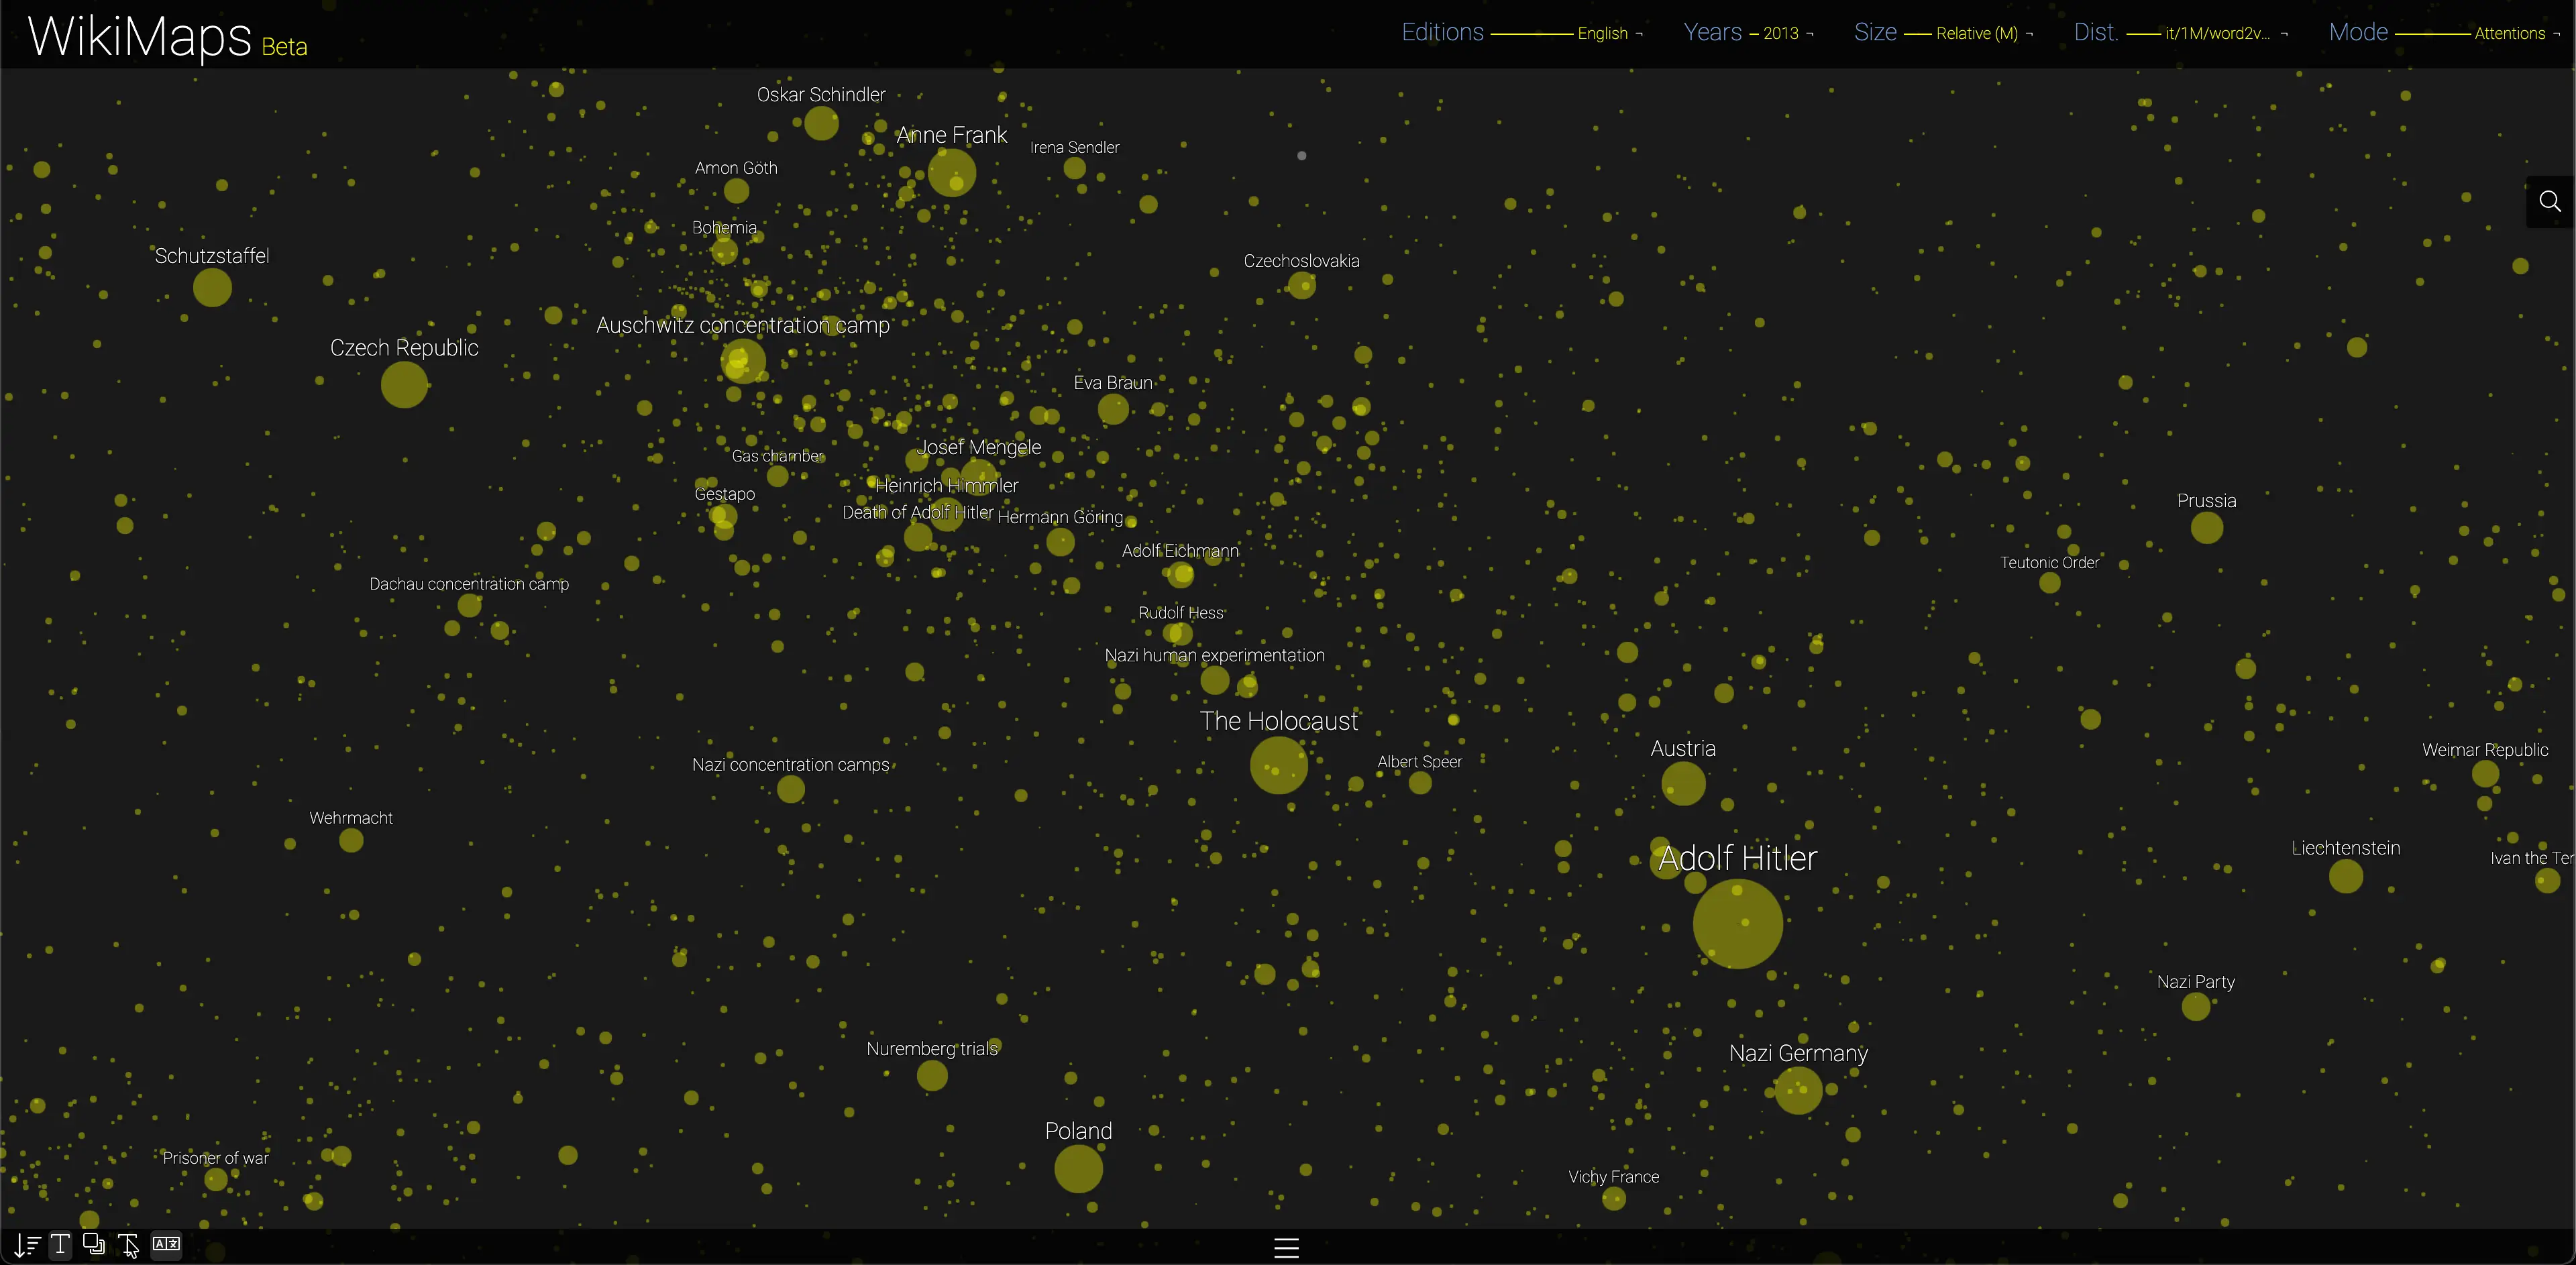
This mode reveals the unequal interest in Wikipedia pages across years and language editions.
Events
This mode only considers the pages that have been the subject of sudden attention. It is the second most central mode of the WikiMaps project. It relies on an analysis of the variation in the daily pageviews of each page, in order to identify sudden peaks of attention. These peaks are characteristic of sudden attention shared by many individuals, as so many signs of what could be interpreted as events.
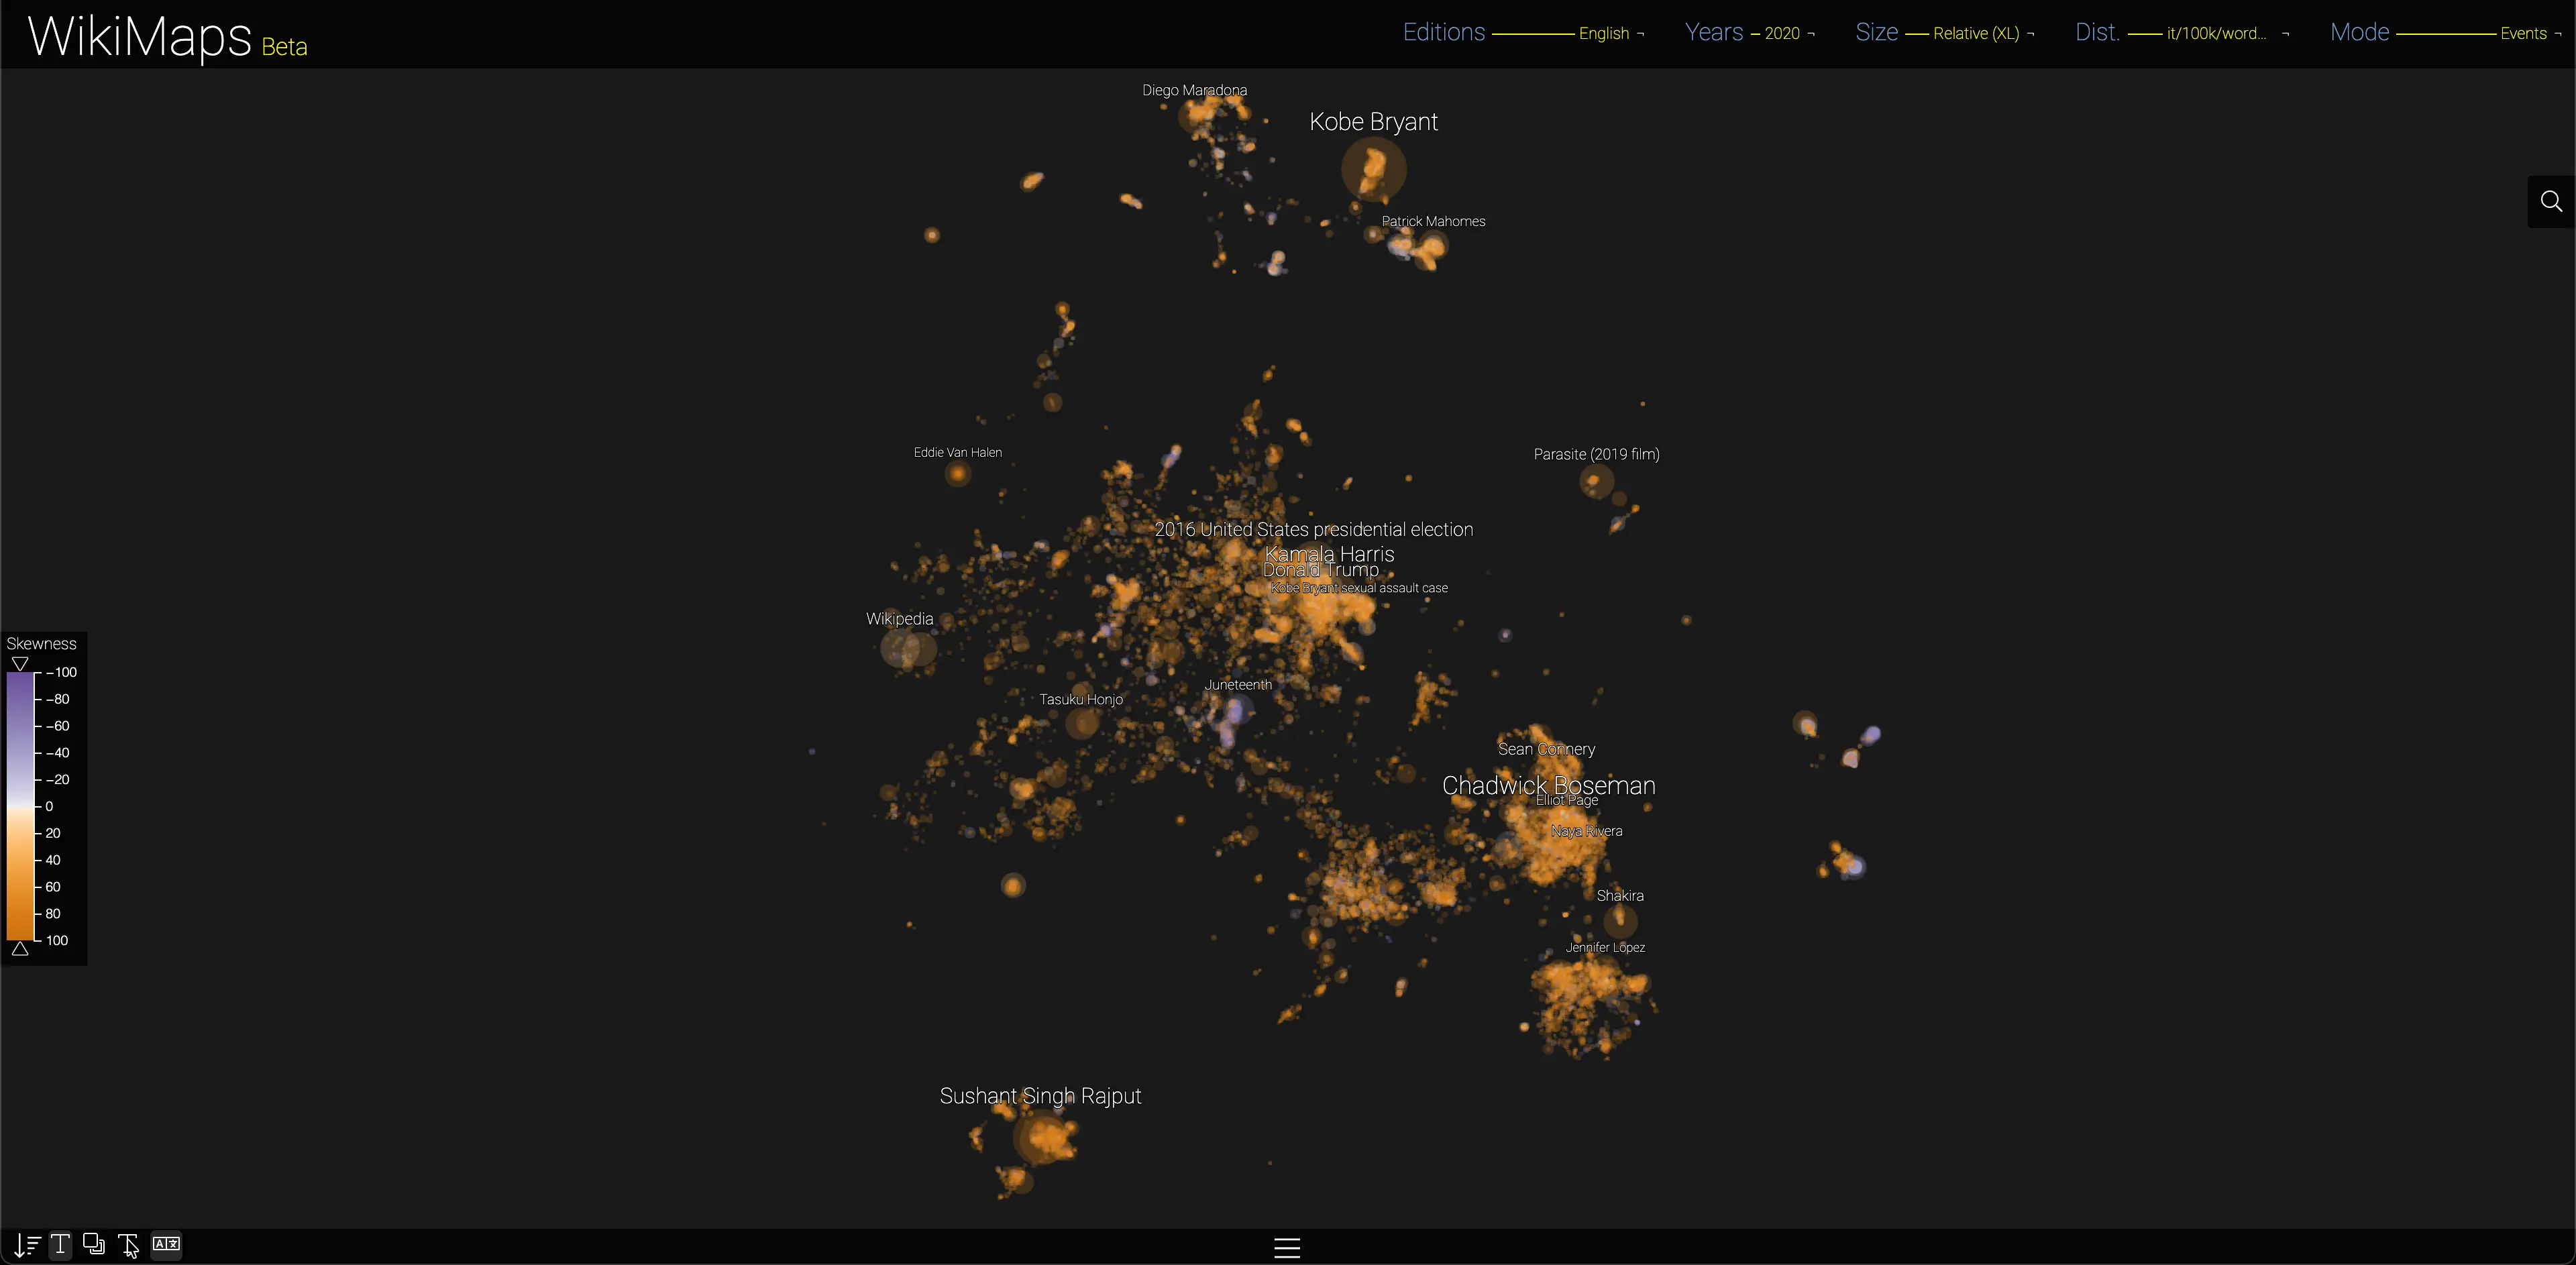
Comparison of attentions and events - English - 2020
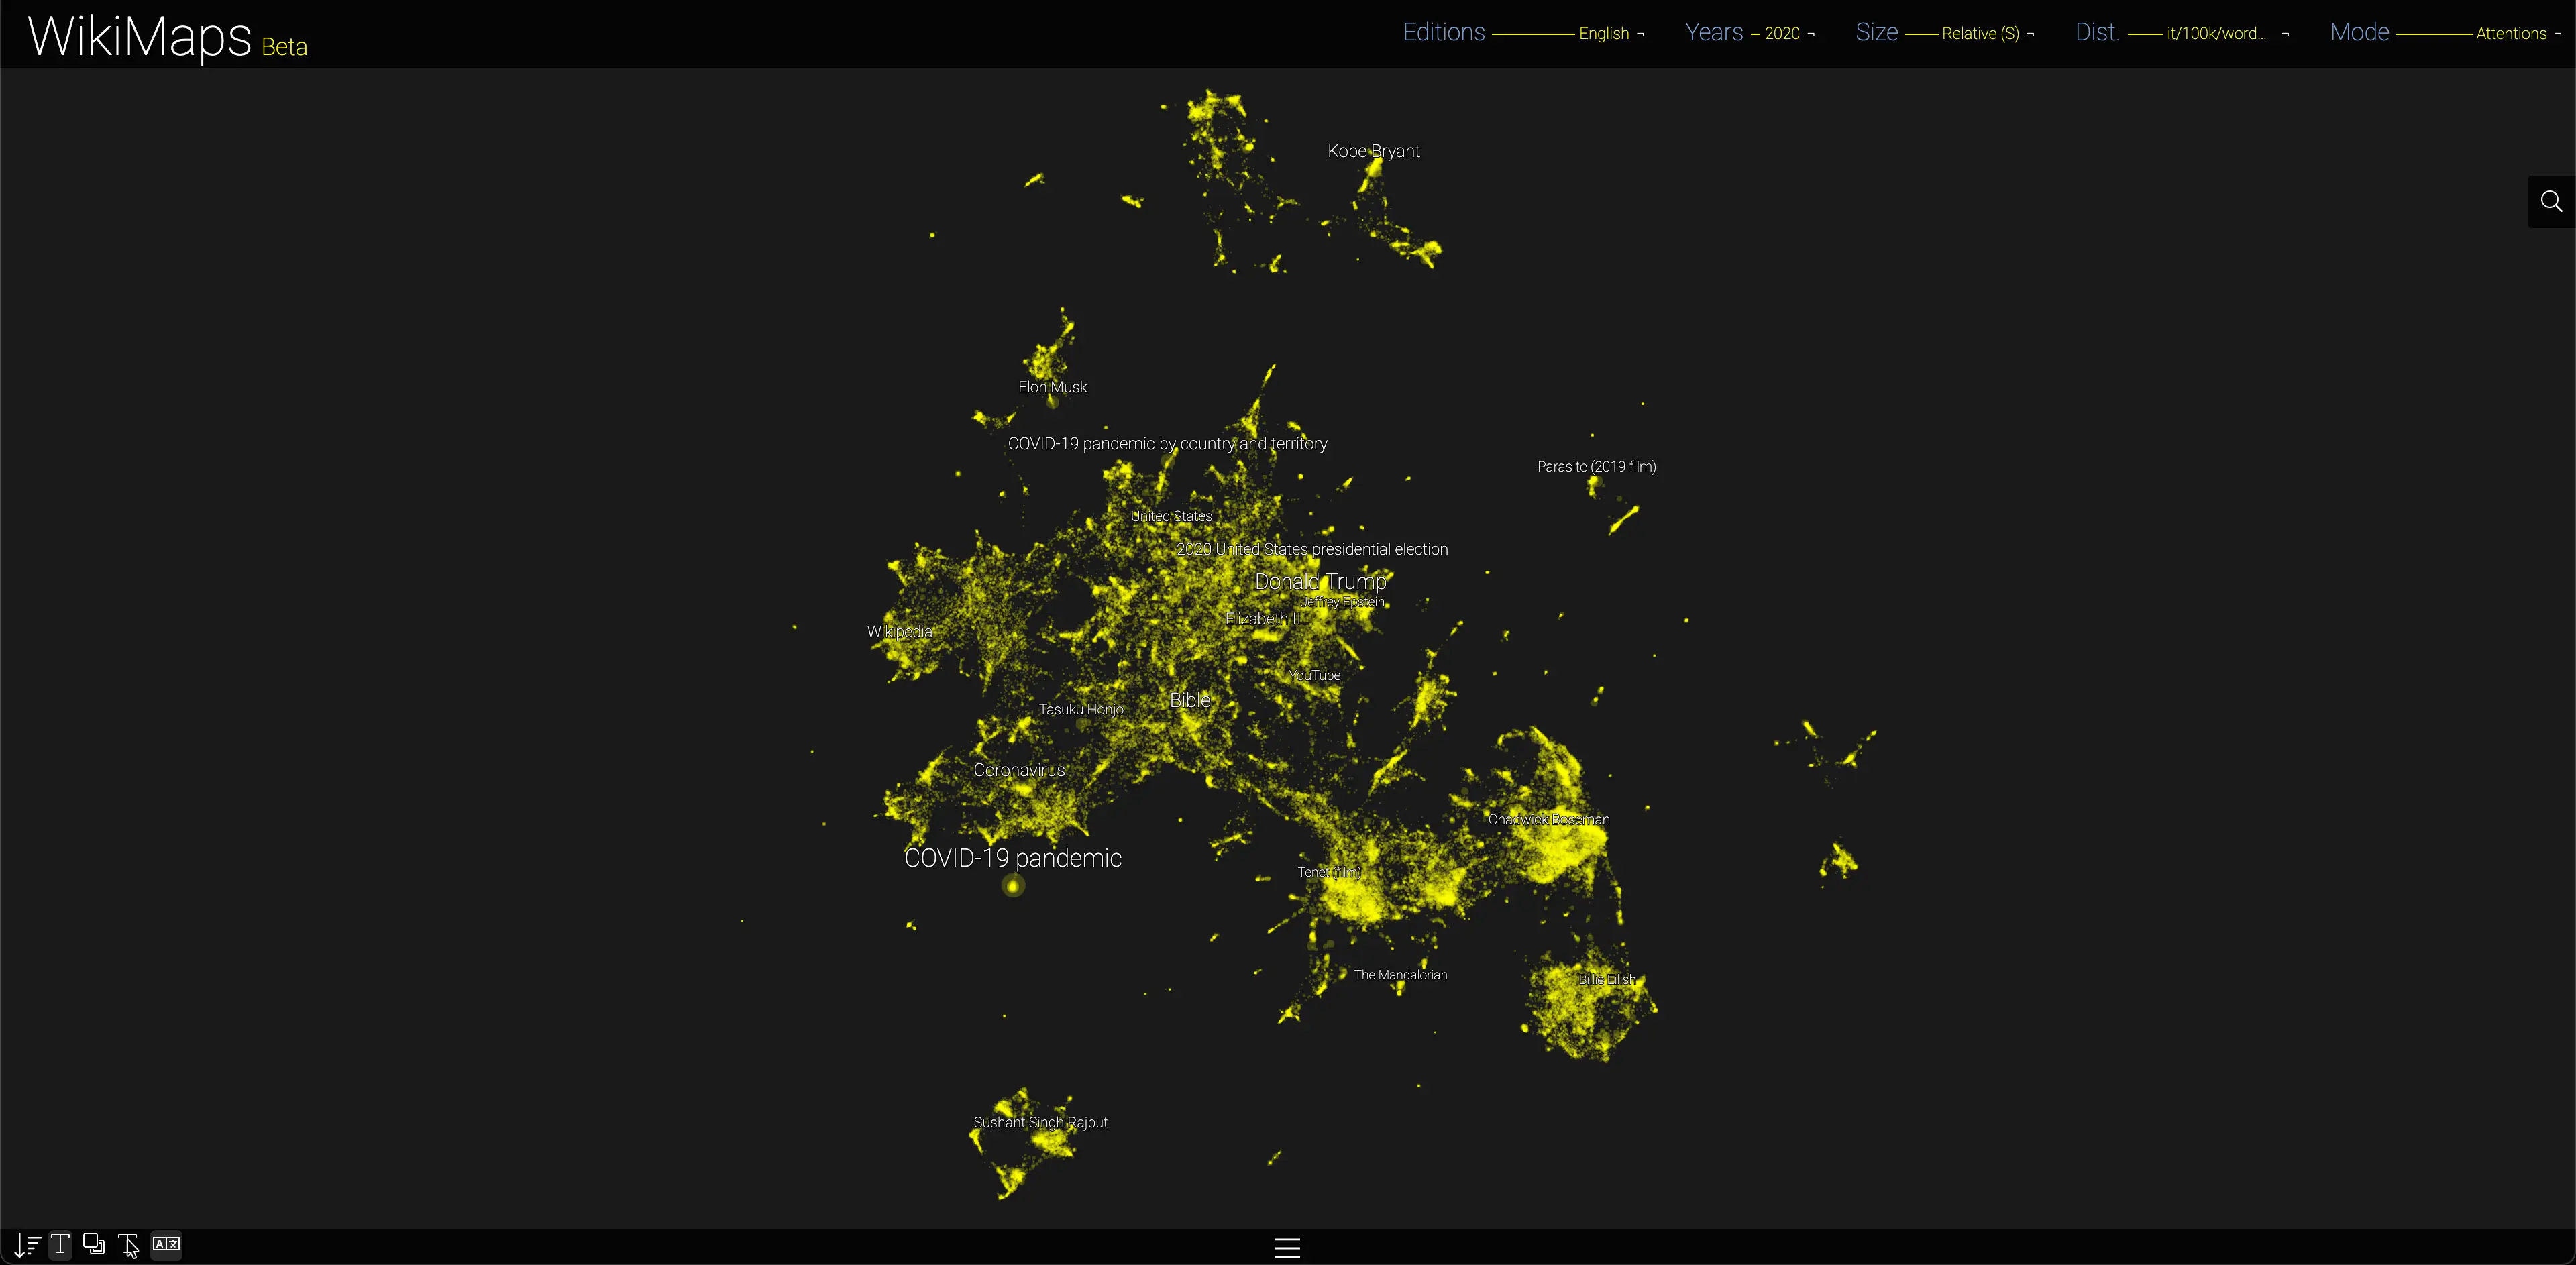
English - 2020 - Intertextual - Attentions
English - 2020 - Intertextual - Events
When an entire edition is considered, such as the English edition in 2020 here, it appears that the main events relate to politics, to the deaths of celebrities and to traumatic phenomena such as the COVID-19 pandemic, or cultural ones such as the release of the Korean film Parasite.
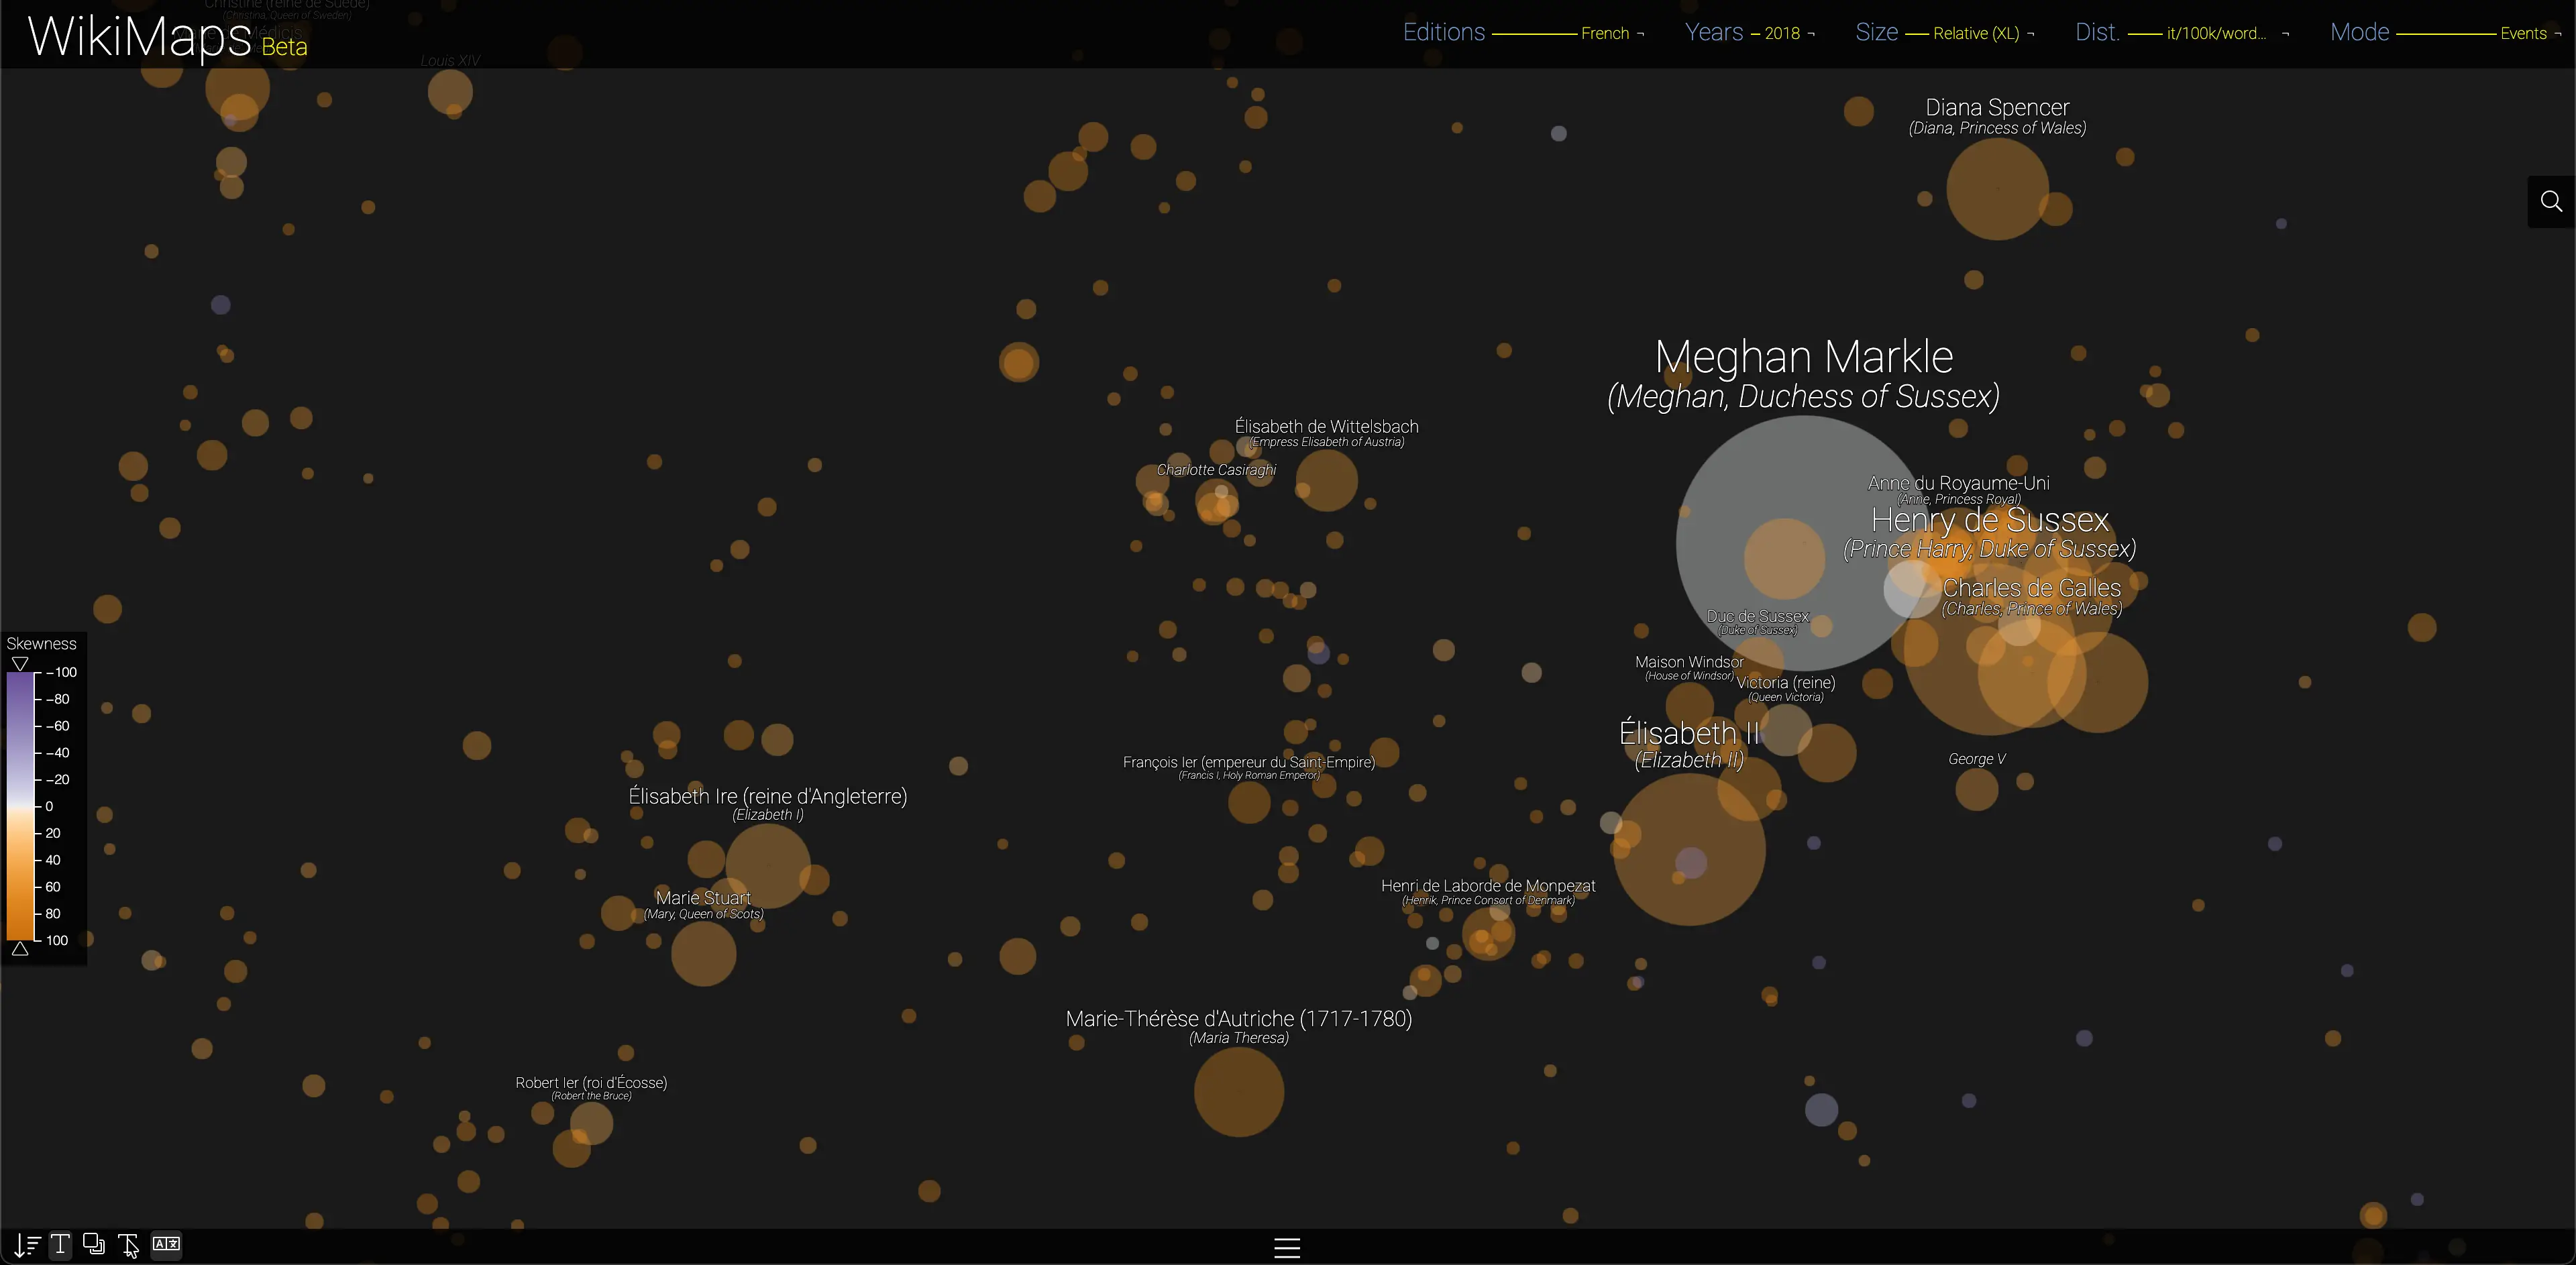
The effect of the series The Crown between 2014 and 2018 in the French edition
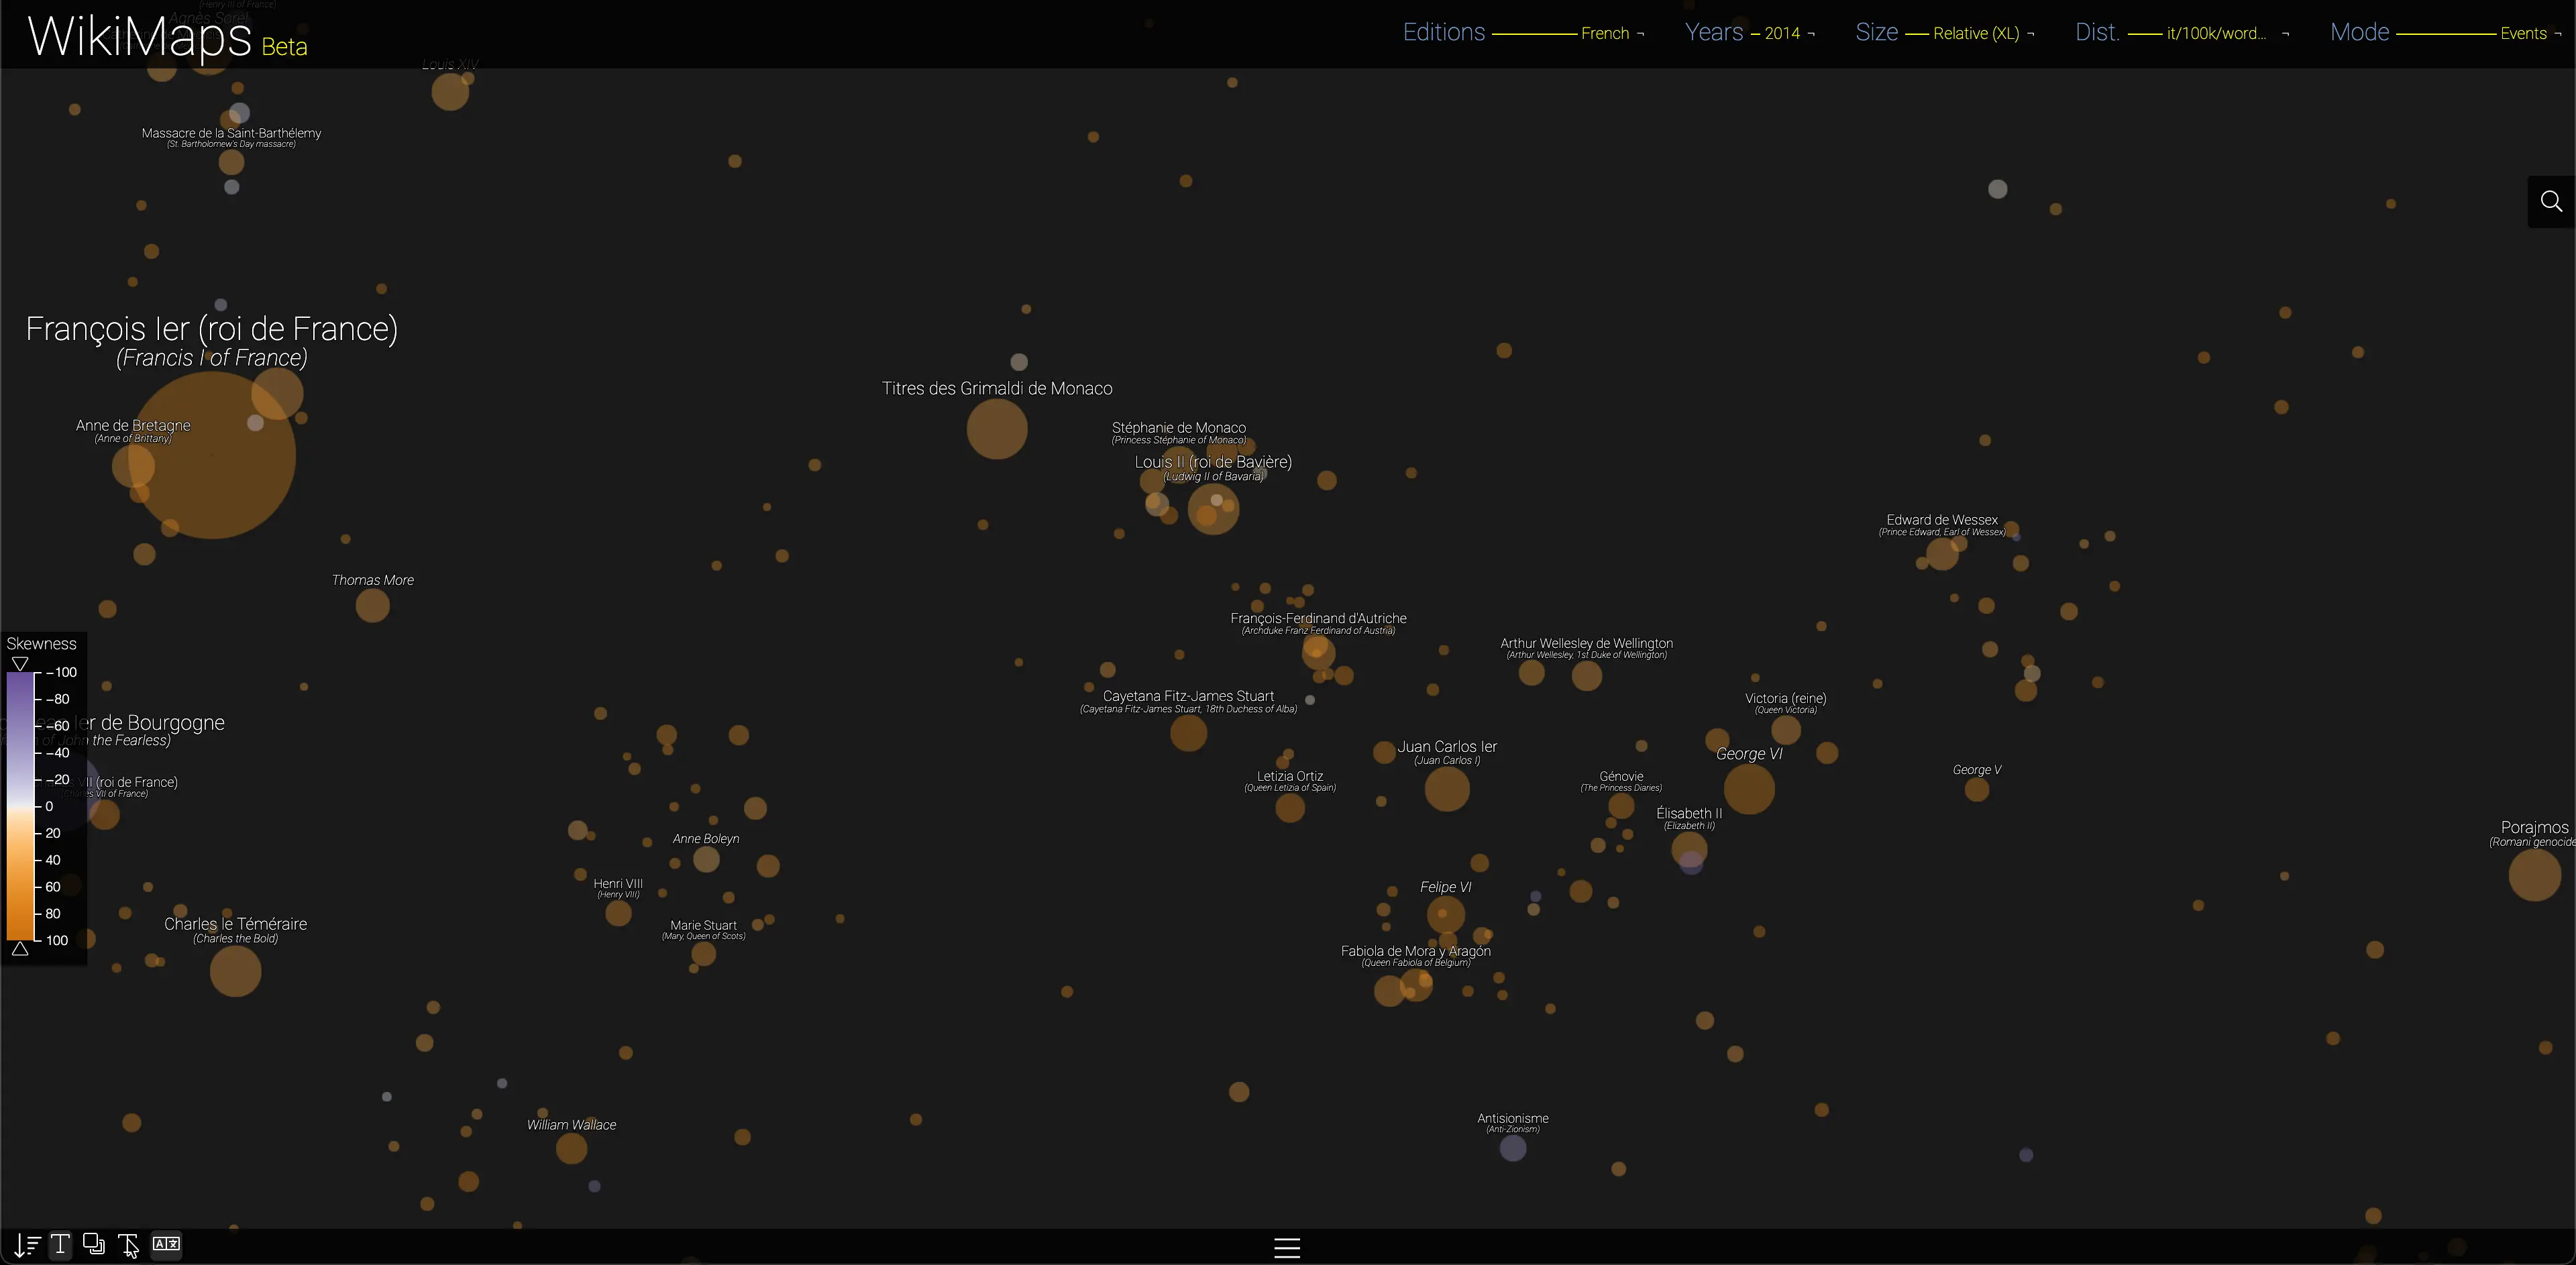
French - 2014 - Intertextual - Events
French - 2018 - Intertextual - Events
The series The Crown, whose success has been growing since its launch in 2016, has generated a considerable increase in attention for the historical figures associated with the series. This phenomenon is observed not only in English, but also in other languages such as French, highlighting the effect of such a series on representations and on sudden interest in the history of the United Kingdom.
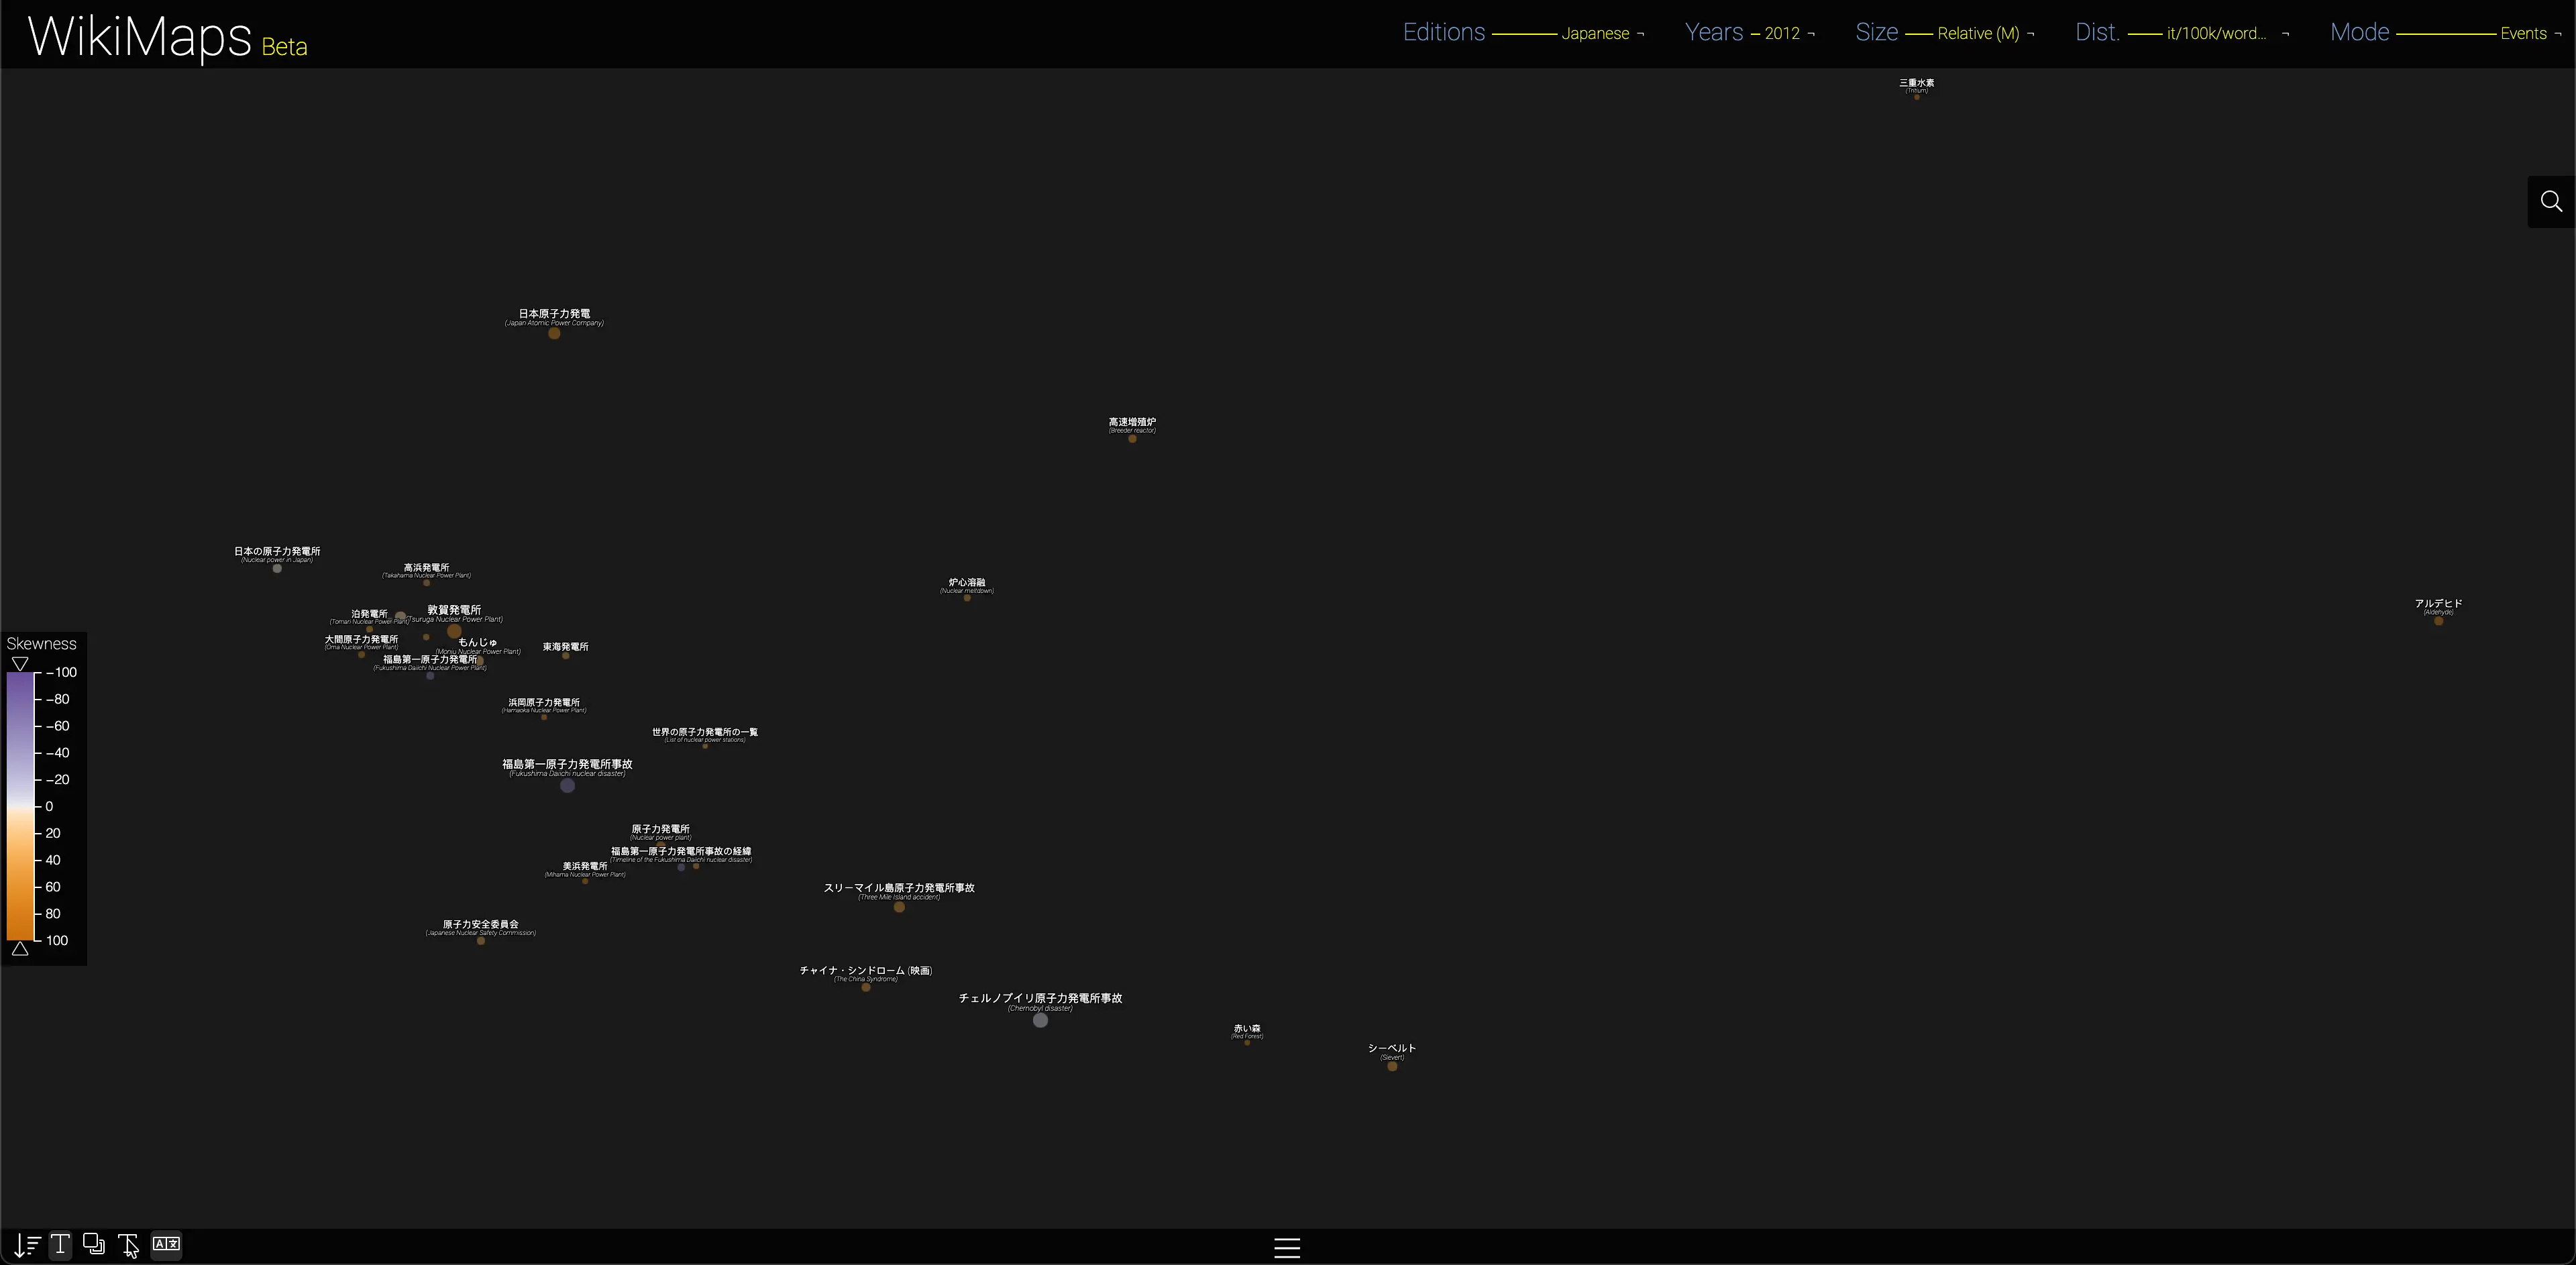
The effect of the Fukushima nuclear accident between 2011 and 2012 in the Japanese edition
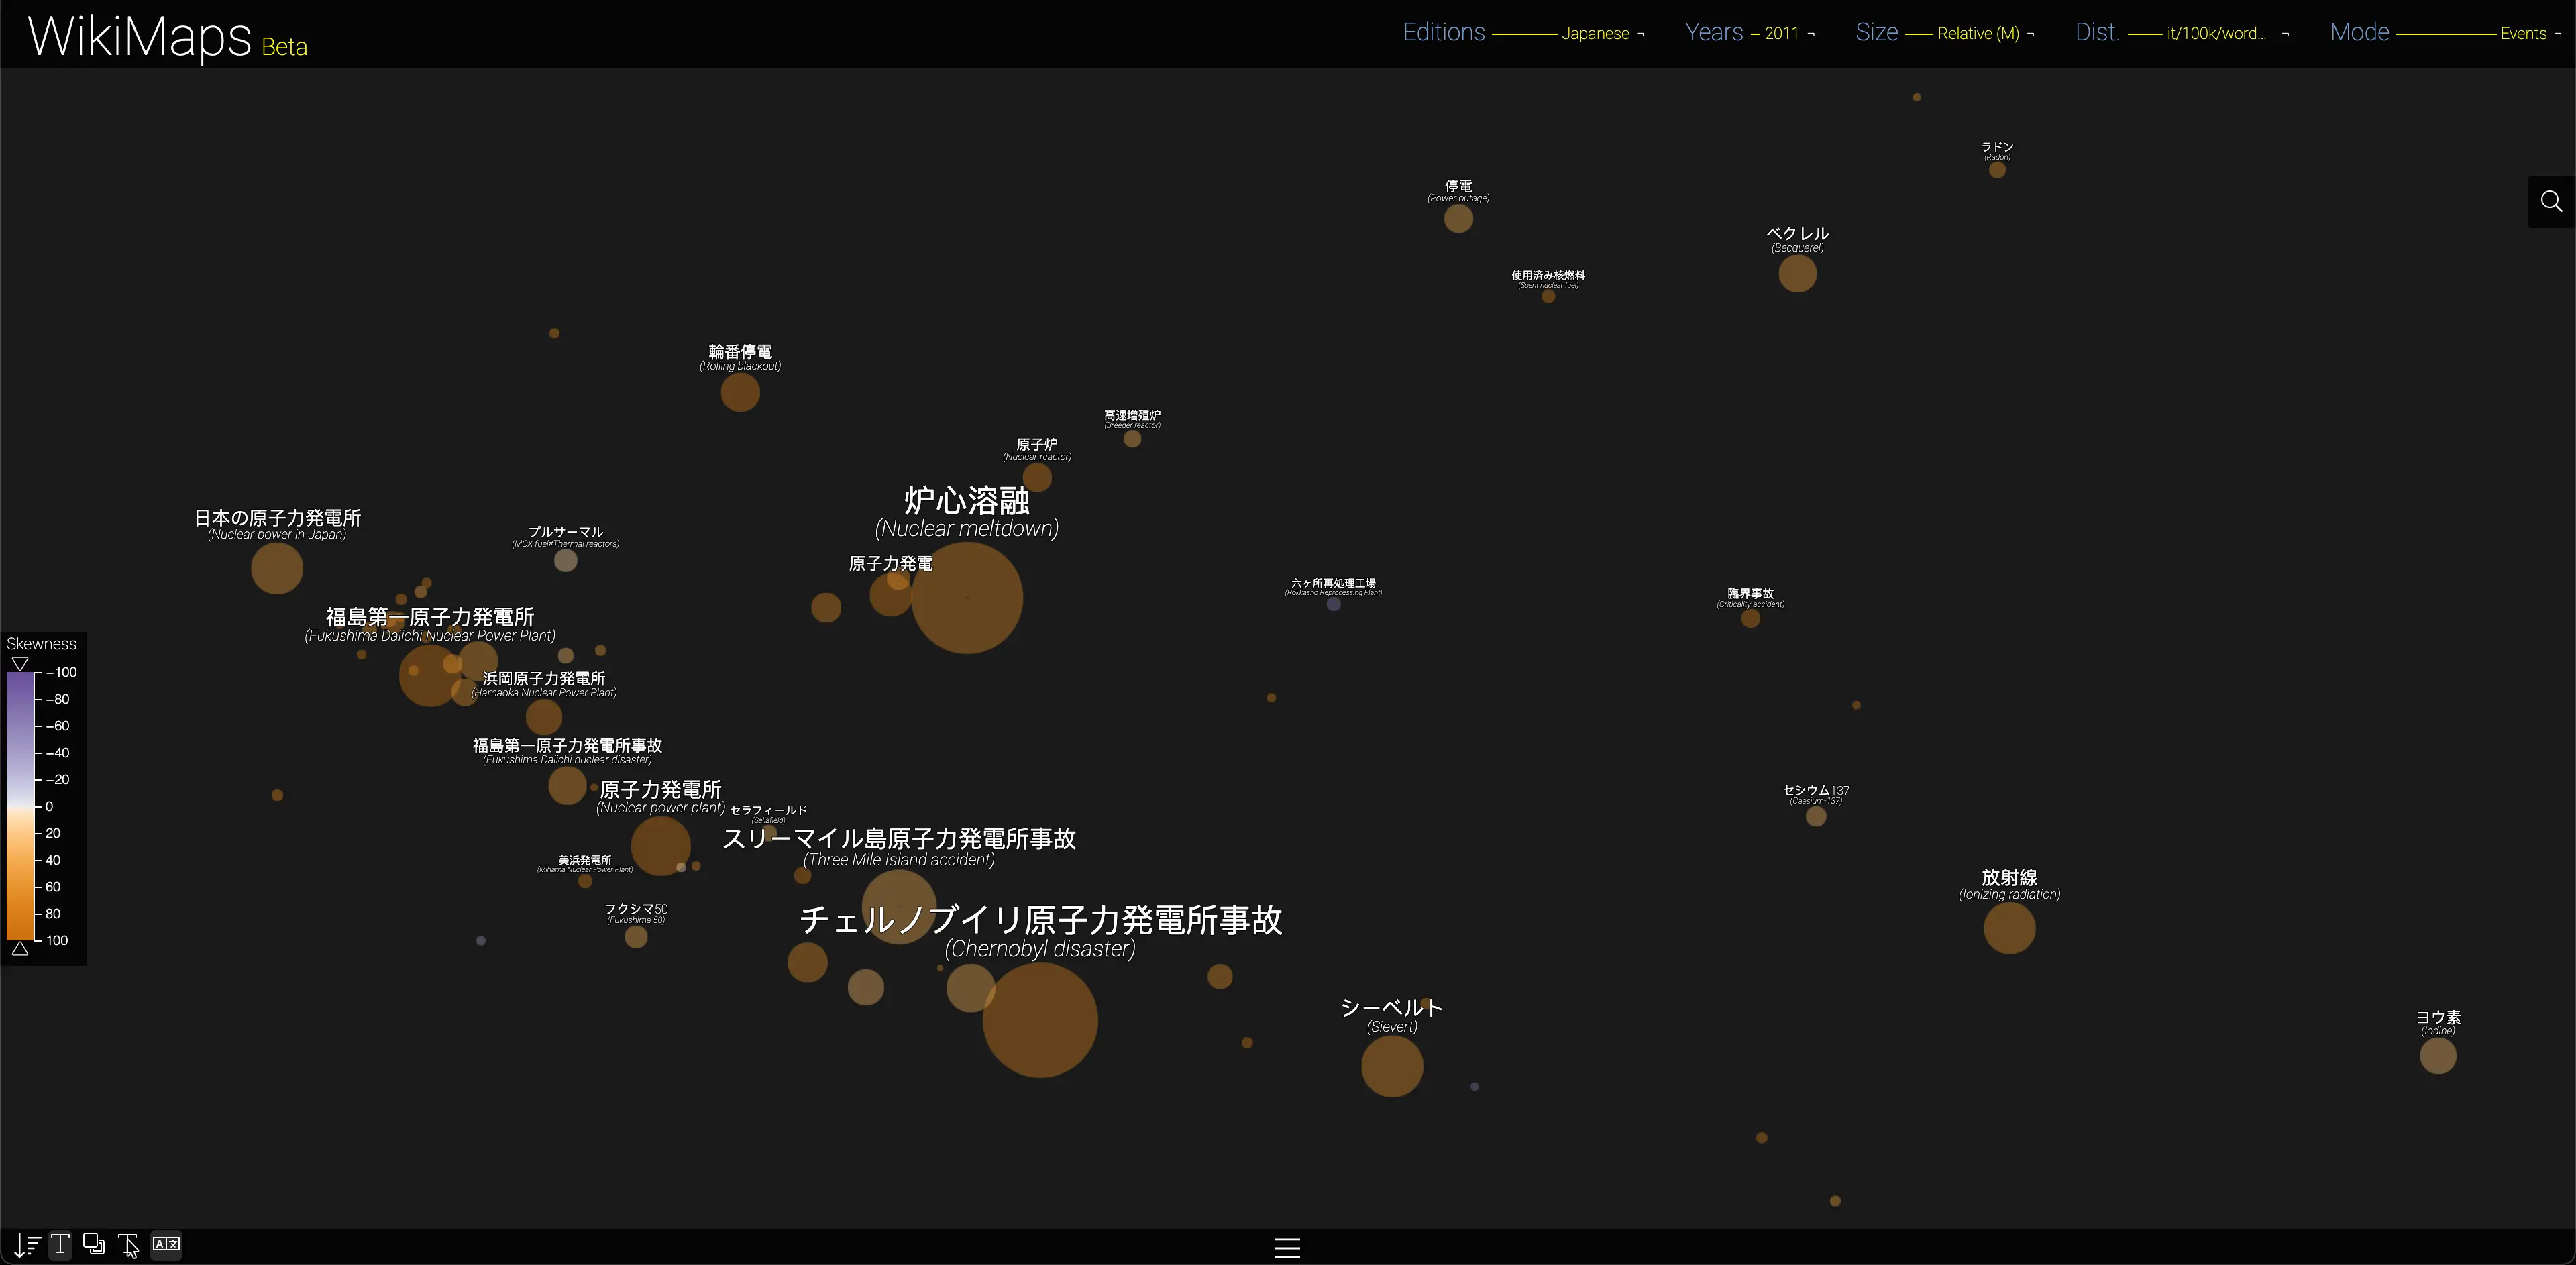
Japanese - 2011 - Intertextual - Events
Japanese - 2012 - Intertextual - Events
The nuclear accident that occurred at Fukushima following the 2011 tsunami aroused sudden interest in the power plant directly concerned, but also in other pages related to nuclear power, including the historic Chernobyl accident of 1986. By 2012, however, this attention had almost completely subsided, highlighting the relatively short attention given to a phenomenon that was nevertheless very striking.
This accident makes it possible to introduce the interactive legend for events, which shows the asymmetry of attention, from attention that rises before reaching its peak (strongly negative skewness) to attention that peaks almost instantly before decreasing more gradually.
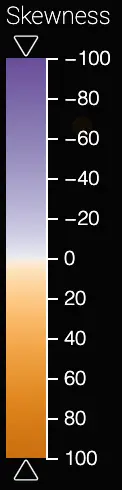
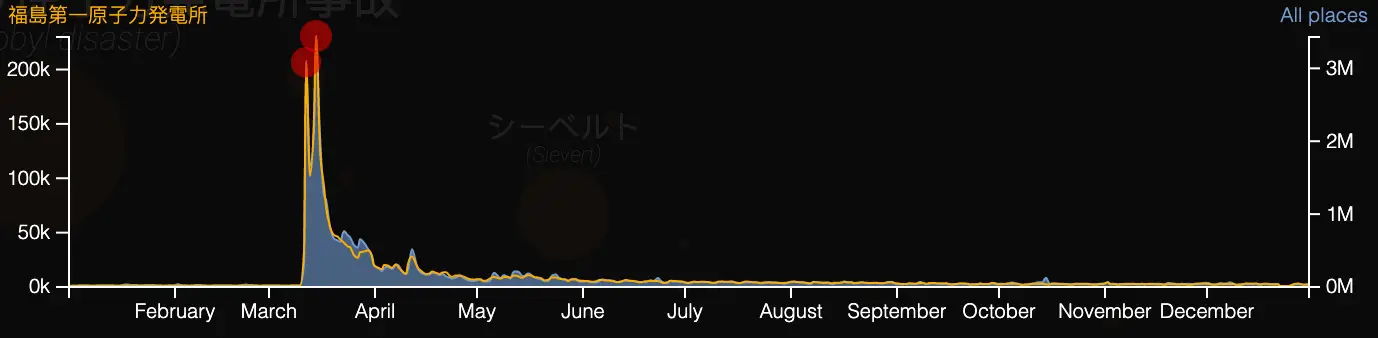
In the case of the Fukushima accident, we can observe that attention is strongly right-skewed. This phenomenon is typical of sudden events, such as the deaths of celebrities, attacks or industrial accidents.
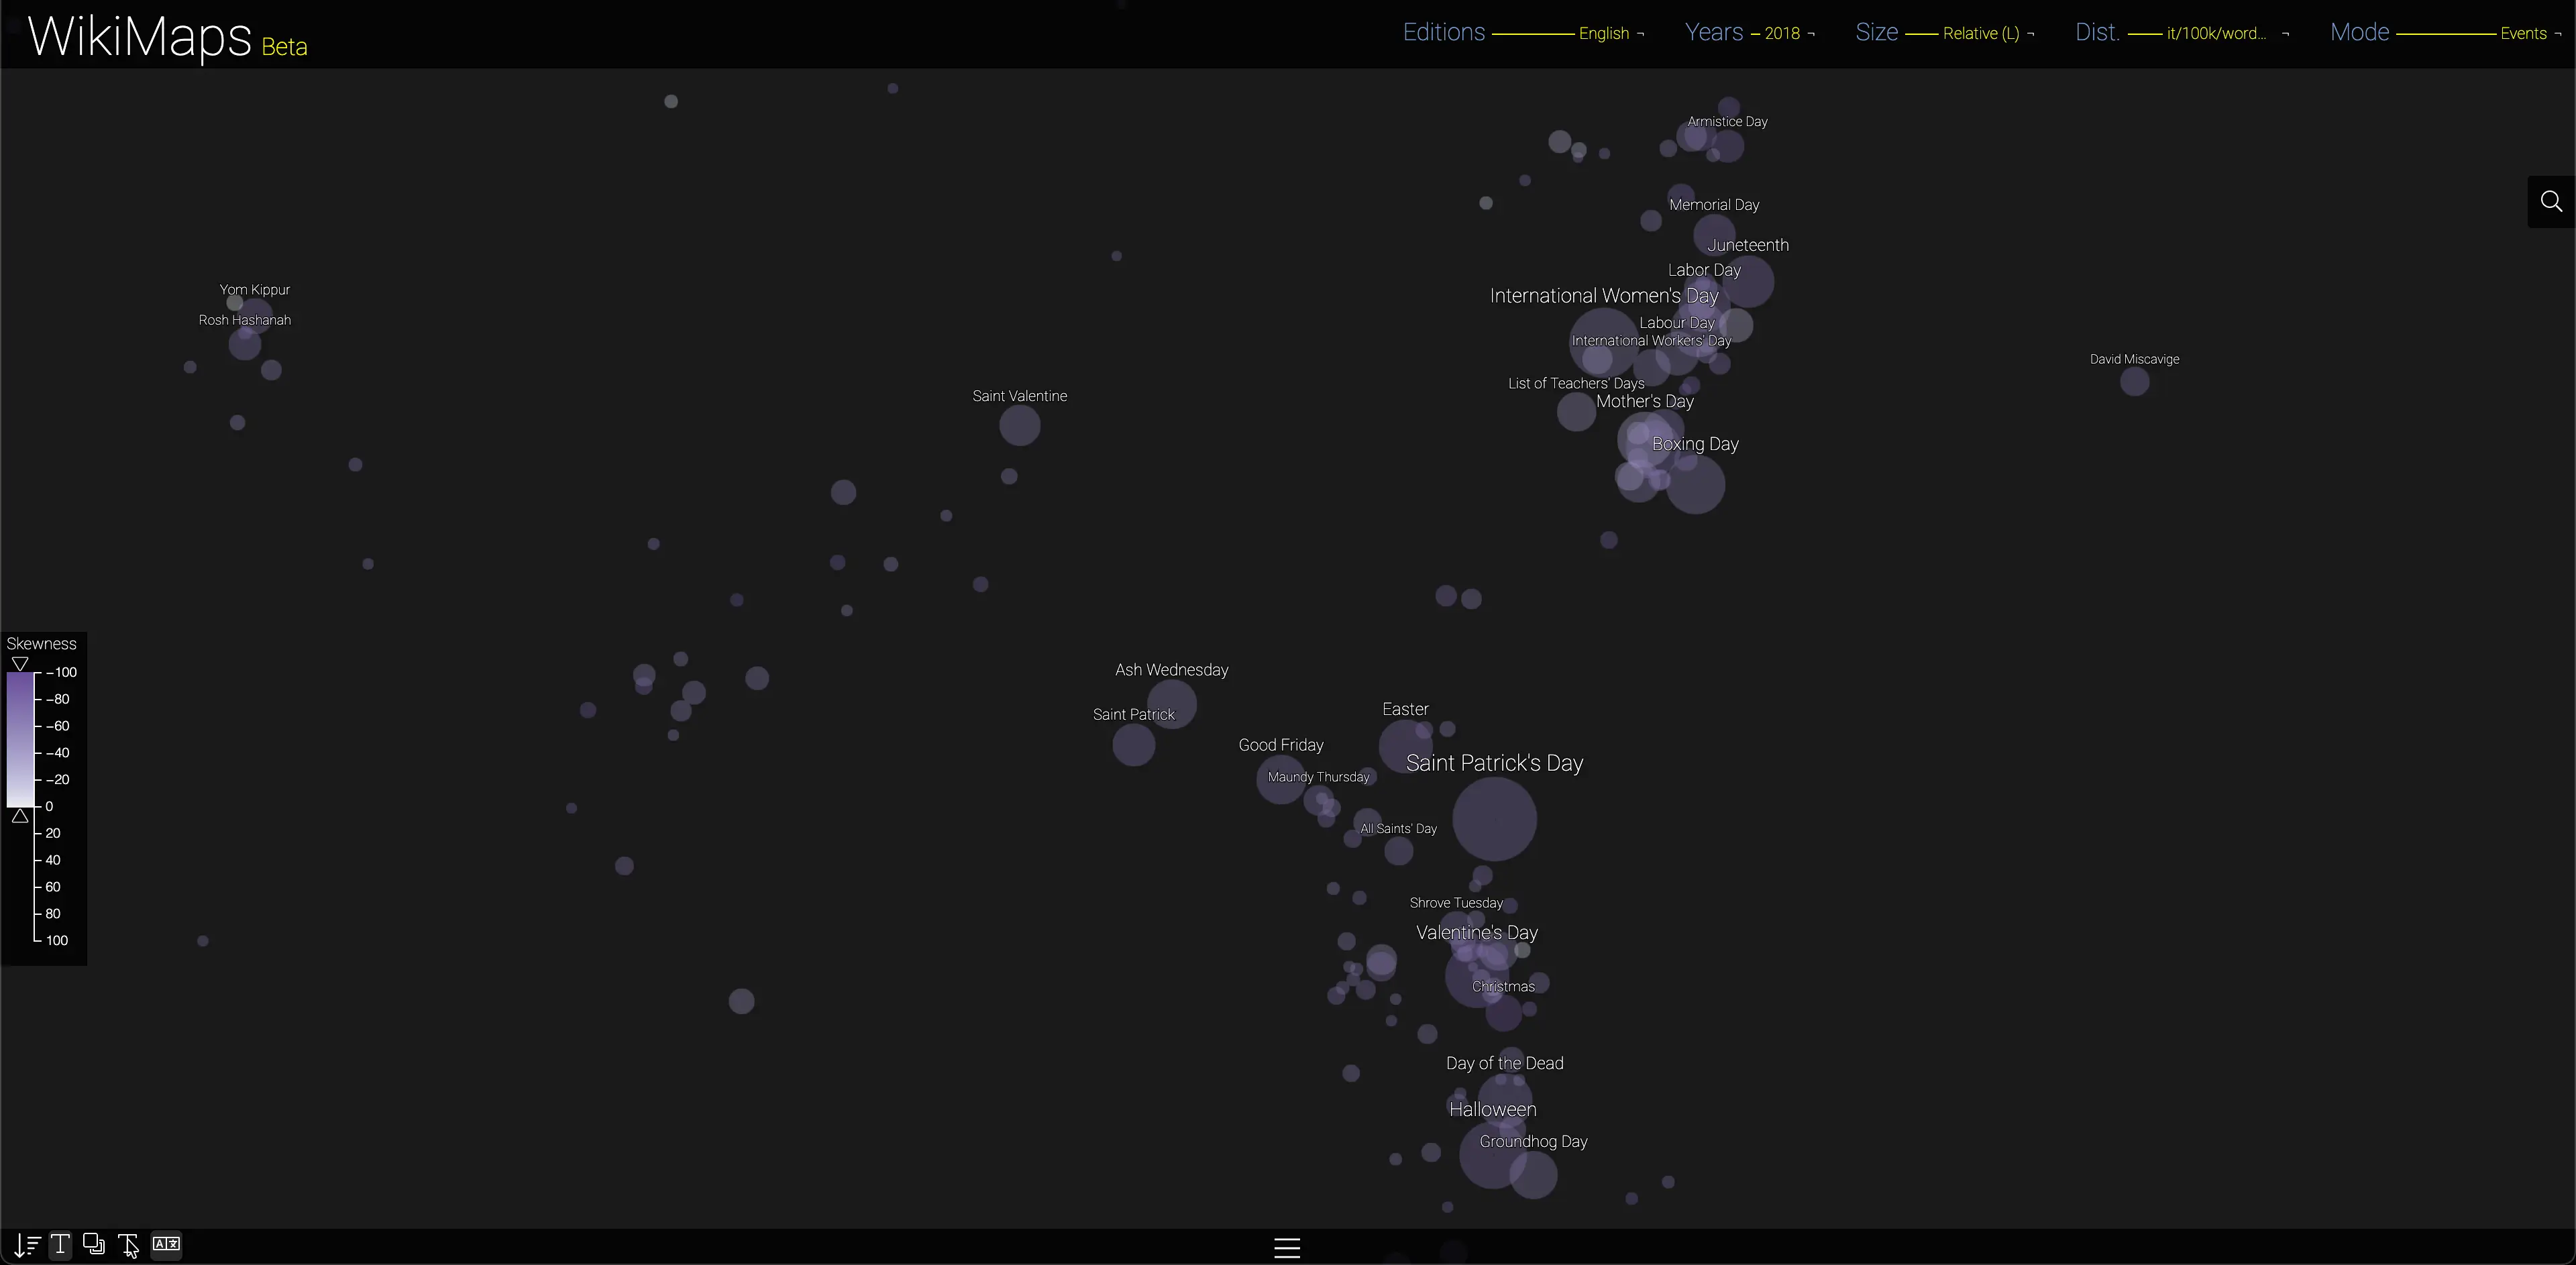
The left-skewed attention specific to feasts
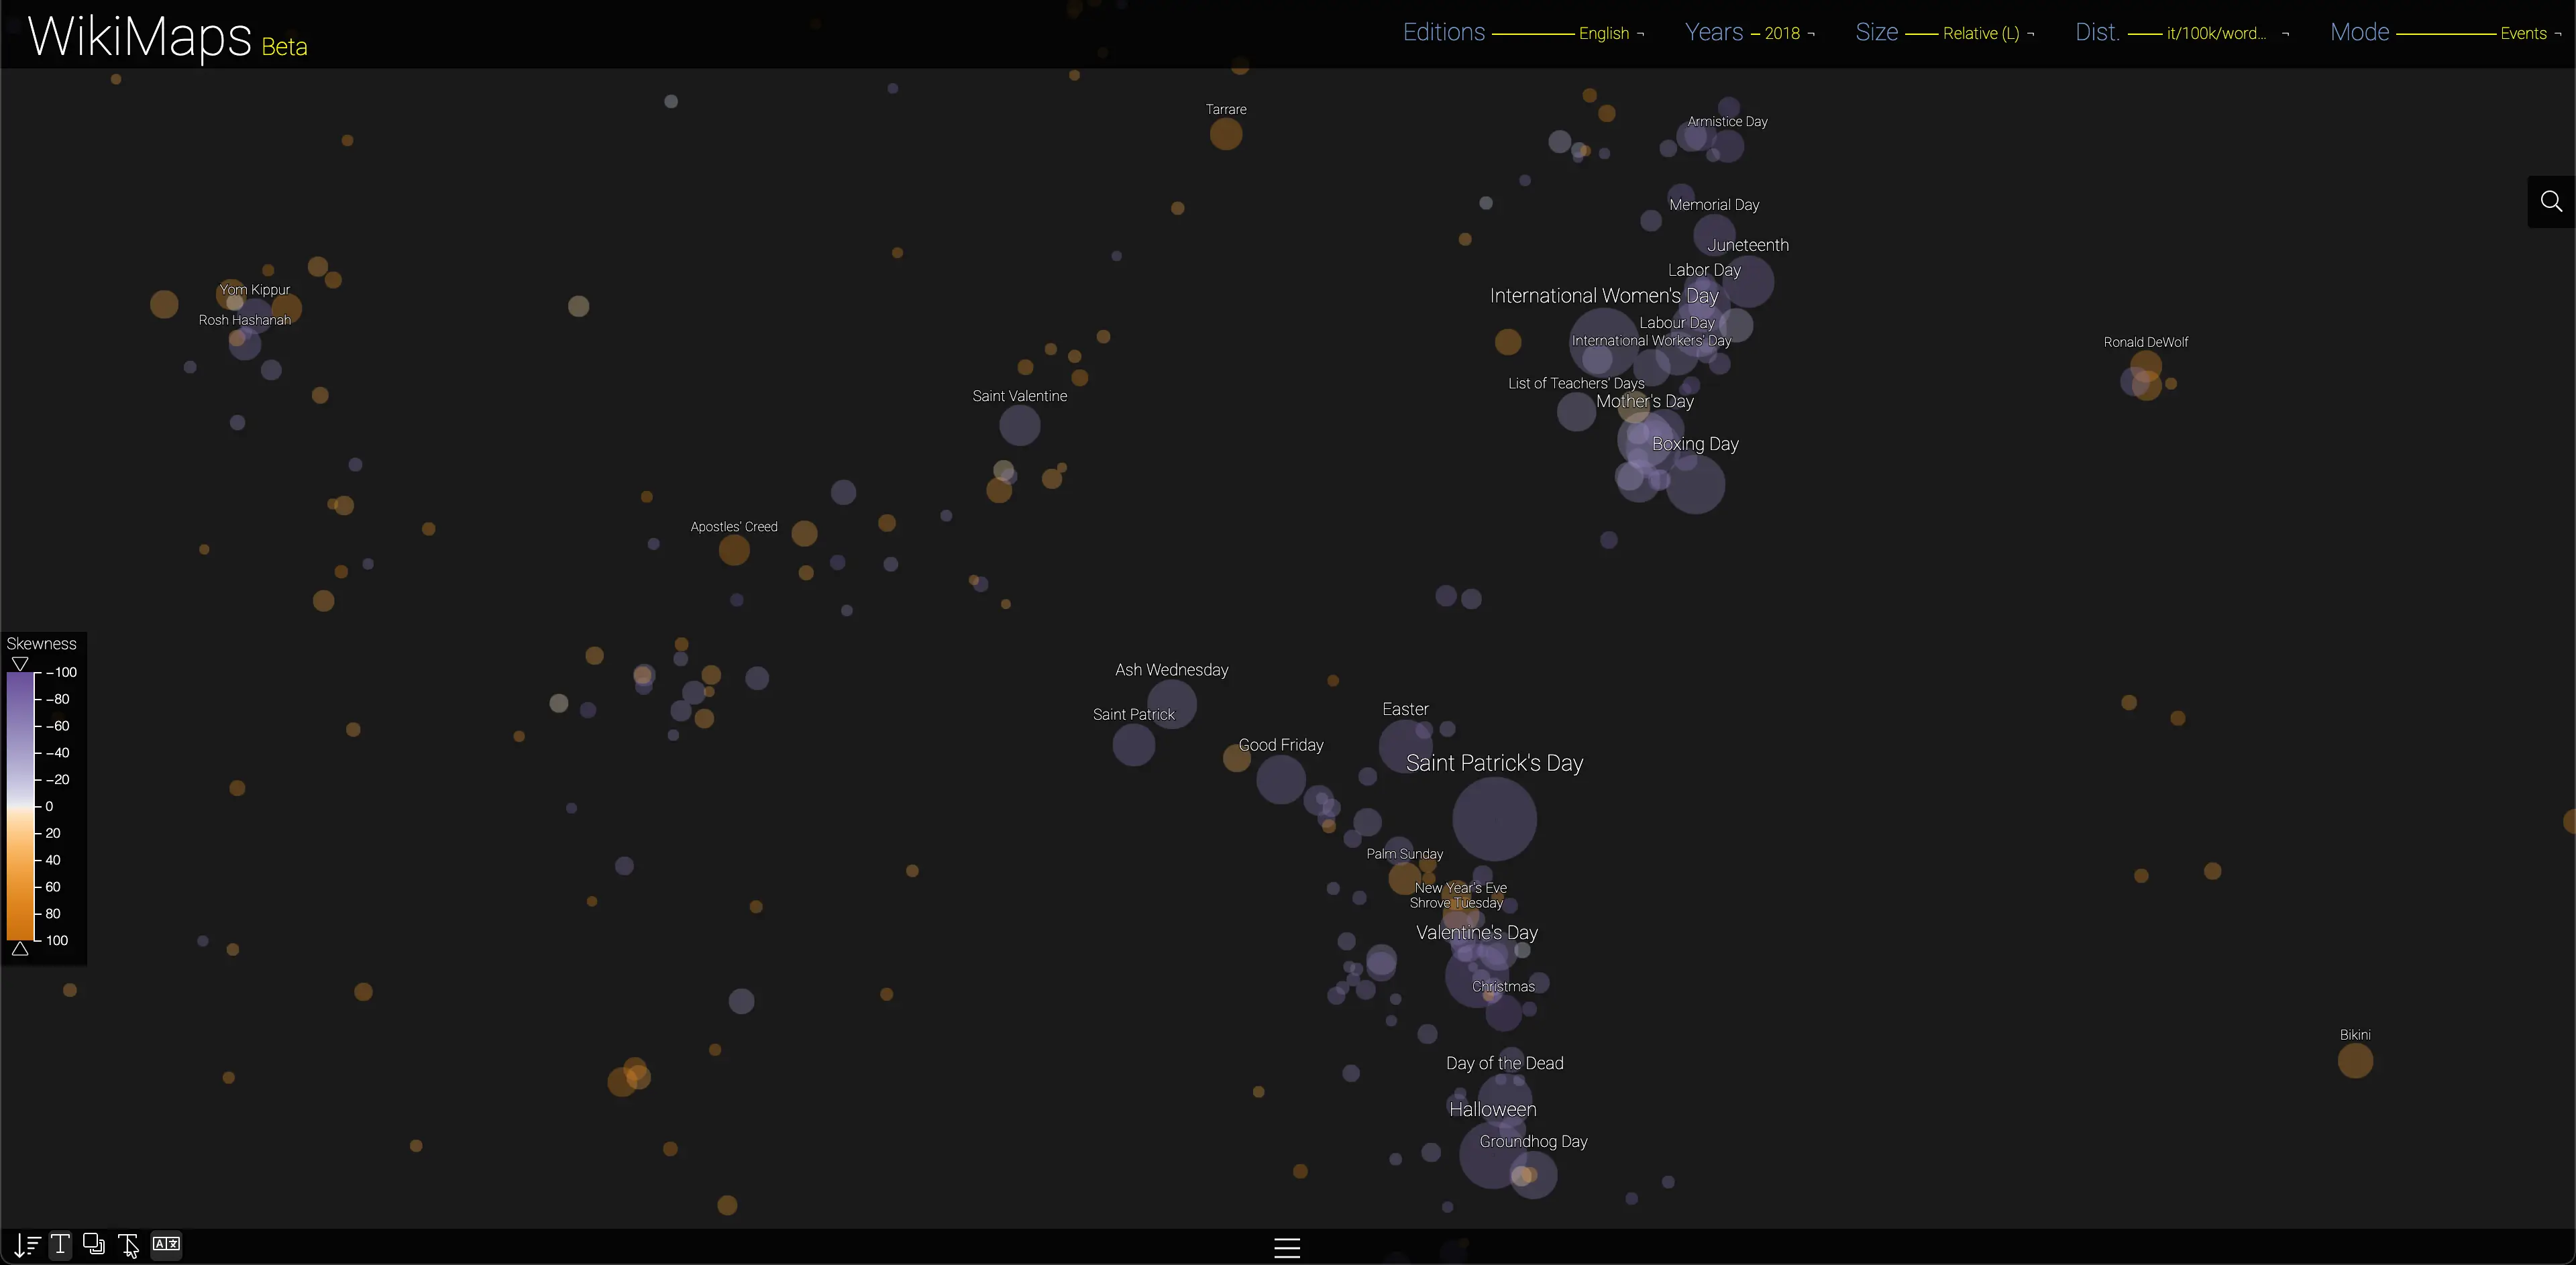
English - 2018 - Intertextual - Events - no filter
English - 2018 - Intertextual - Events - filter on skewness
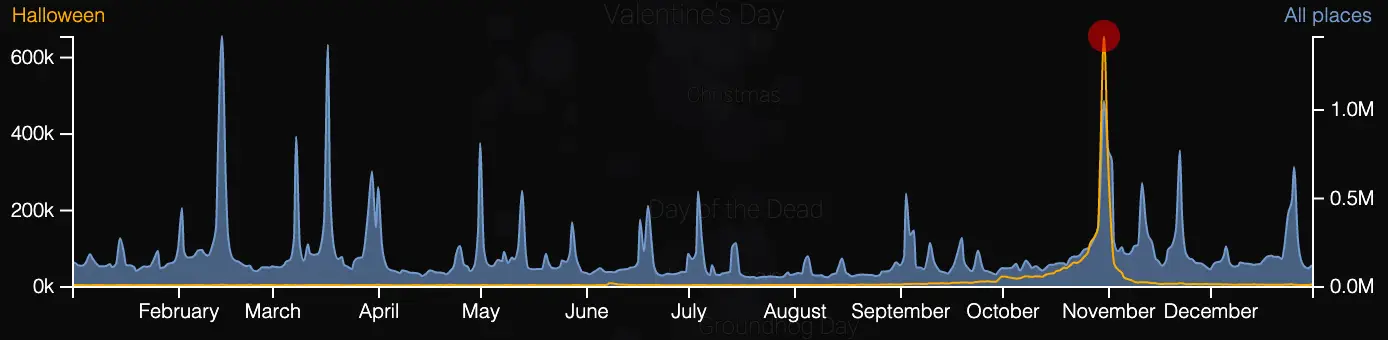
Unlike traumatic events, which occur suddenly, feasts are left-skewed, reflecting the preparation of the celebration, attention to which stops abruptly once the feast is over.
The 2015 attack on Charlie Hebdo
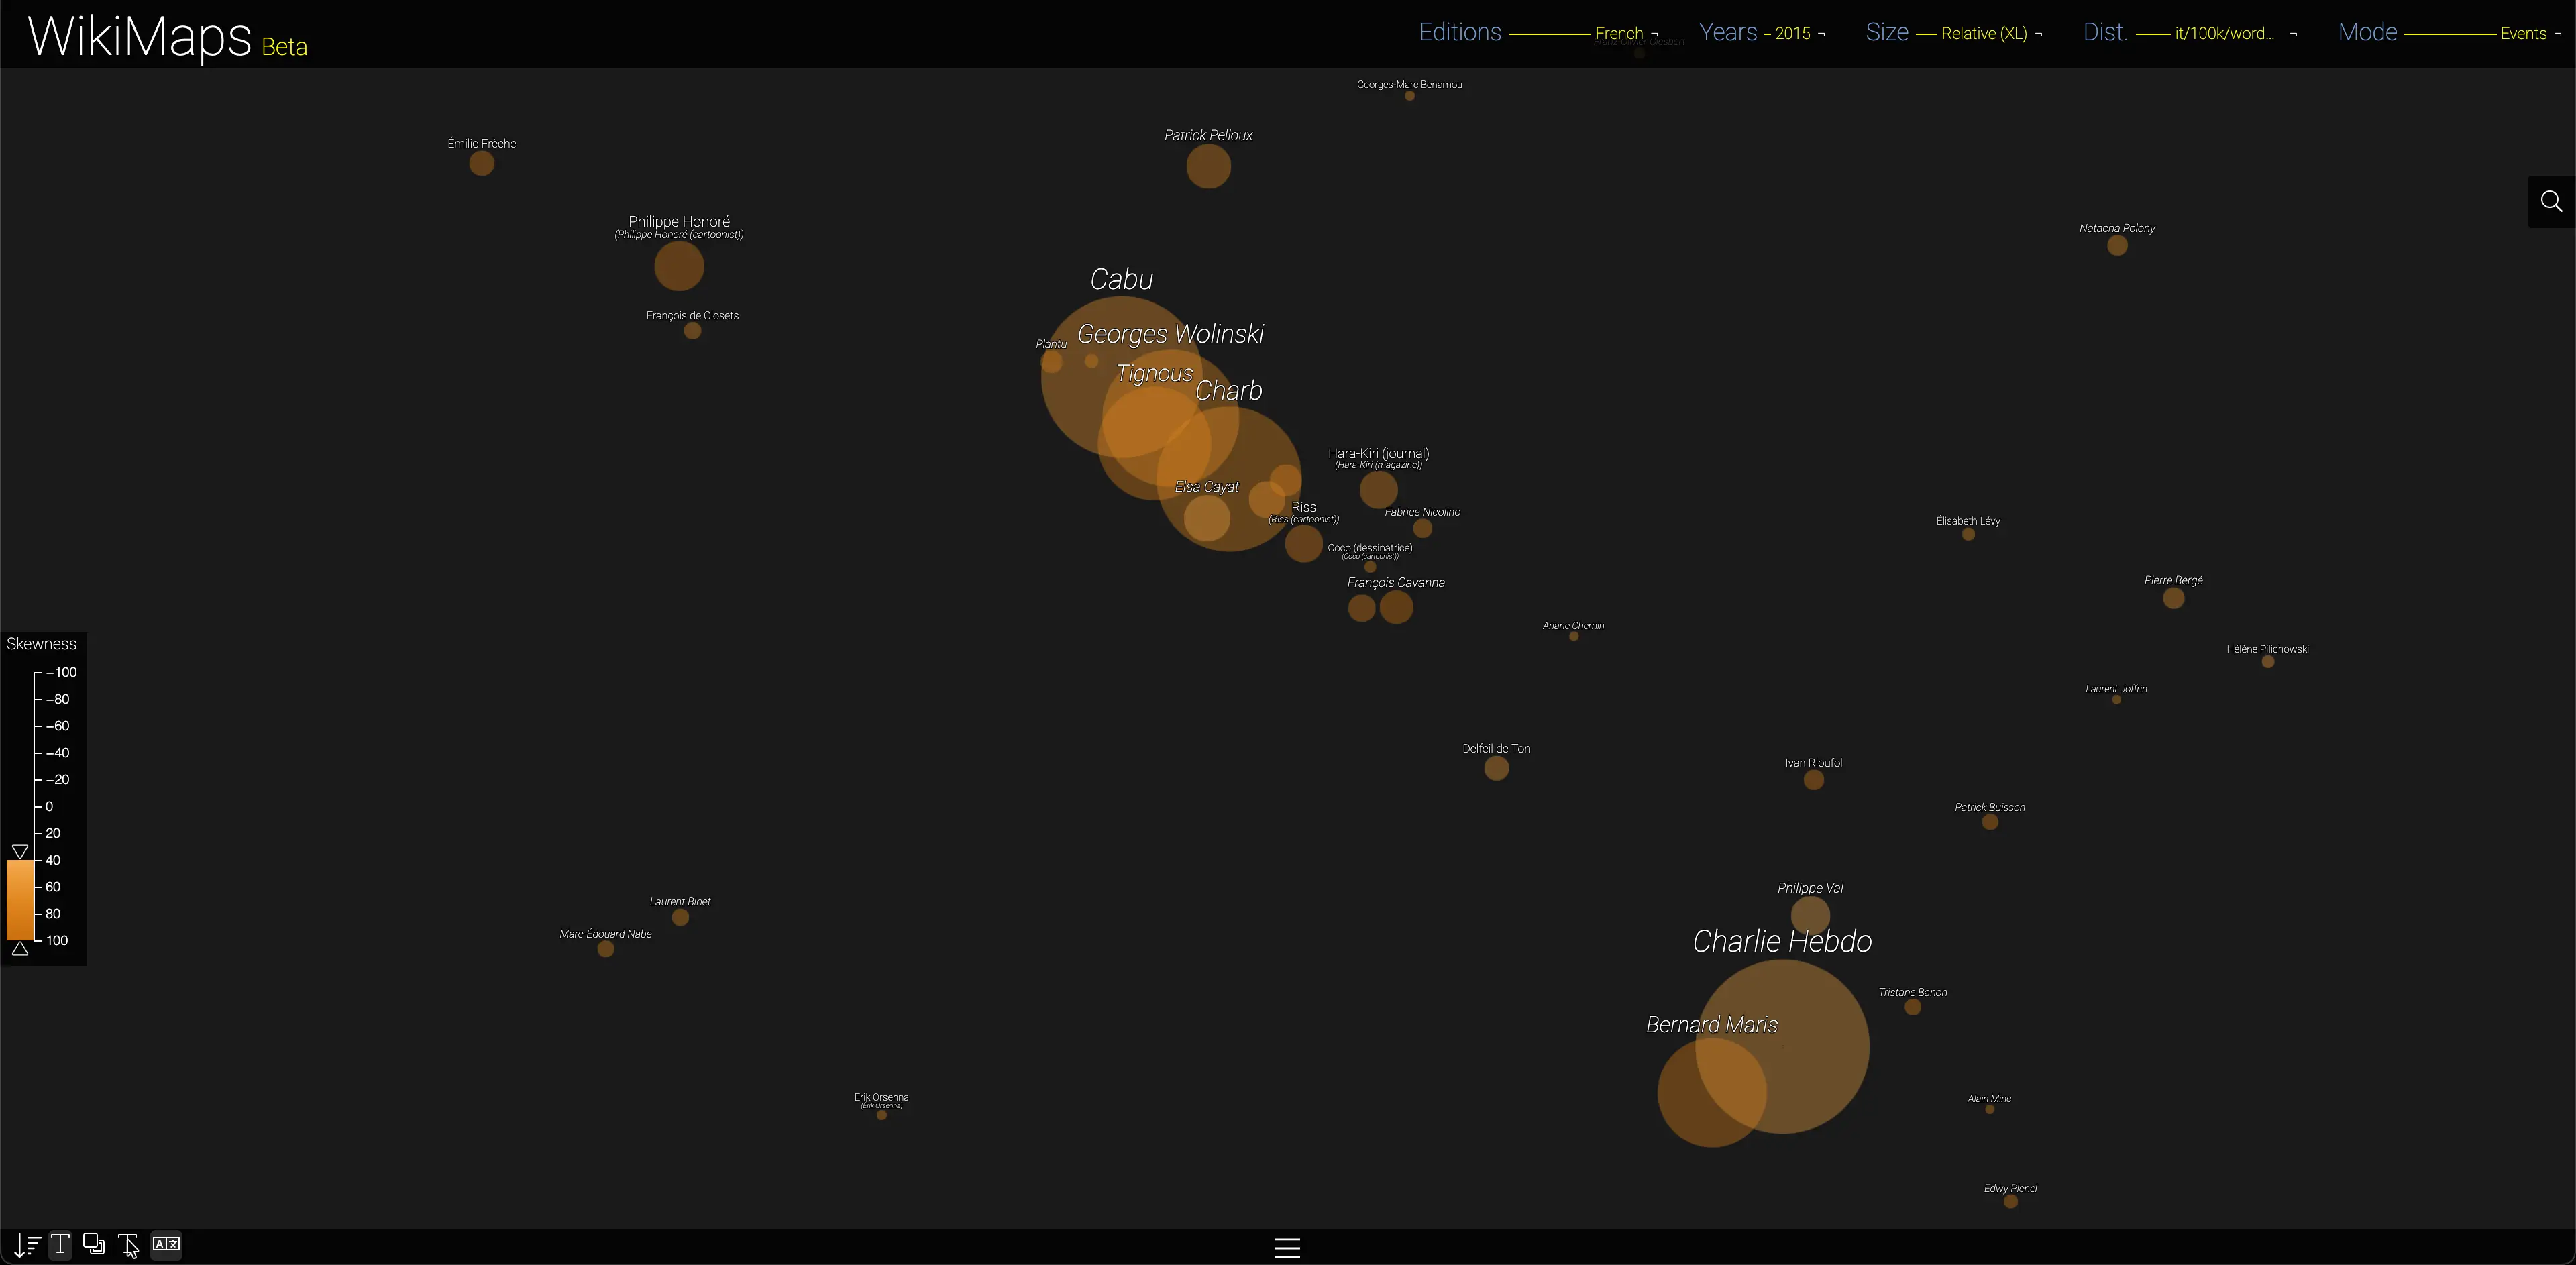
French - 2015 - Intertextual - Events
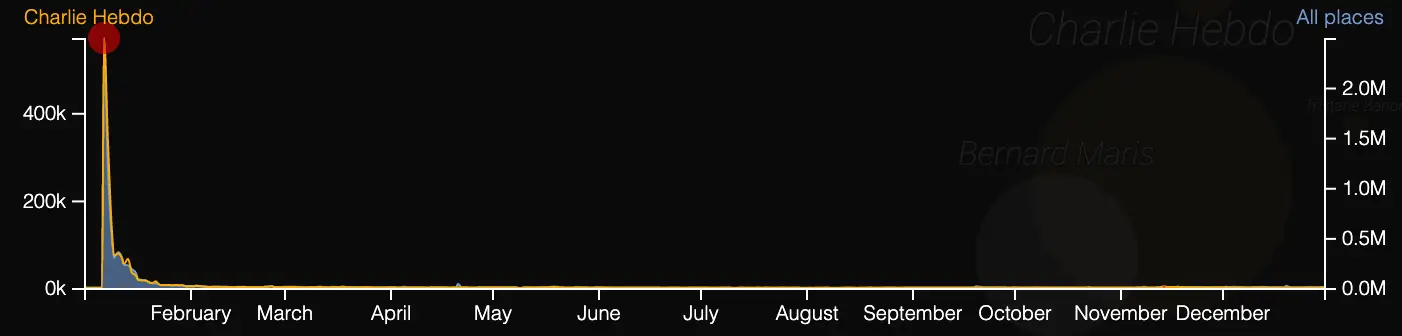
The deadly attack on Charlie Hebdo in 2015 is very clearly visible. The newspaper, but also the people killed in the attack, aroused sudden attention, characterised by a very strong right skew, typical of reactions to terrorist acts.
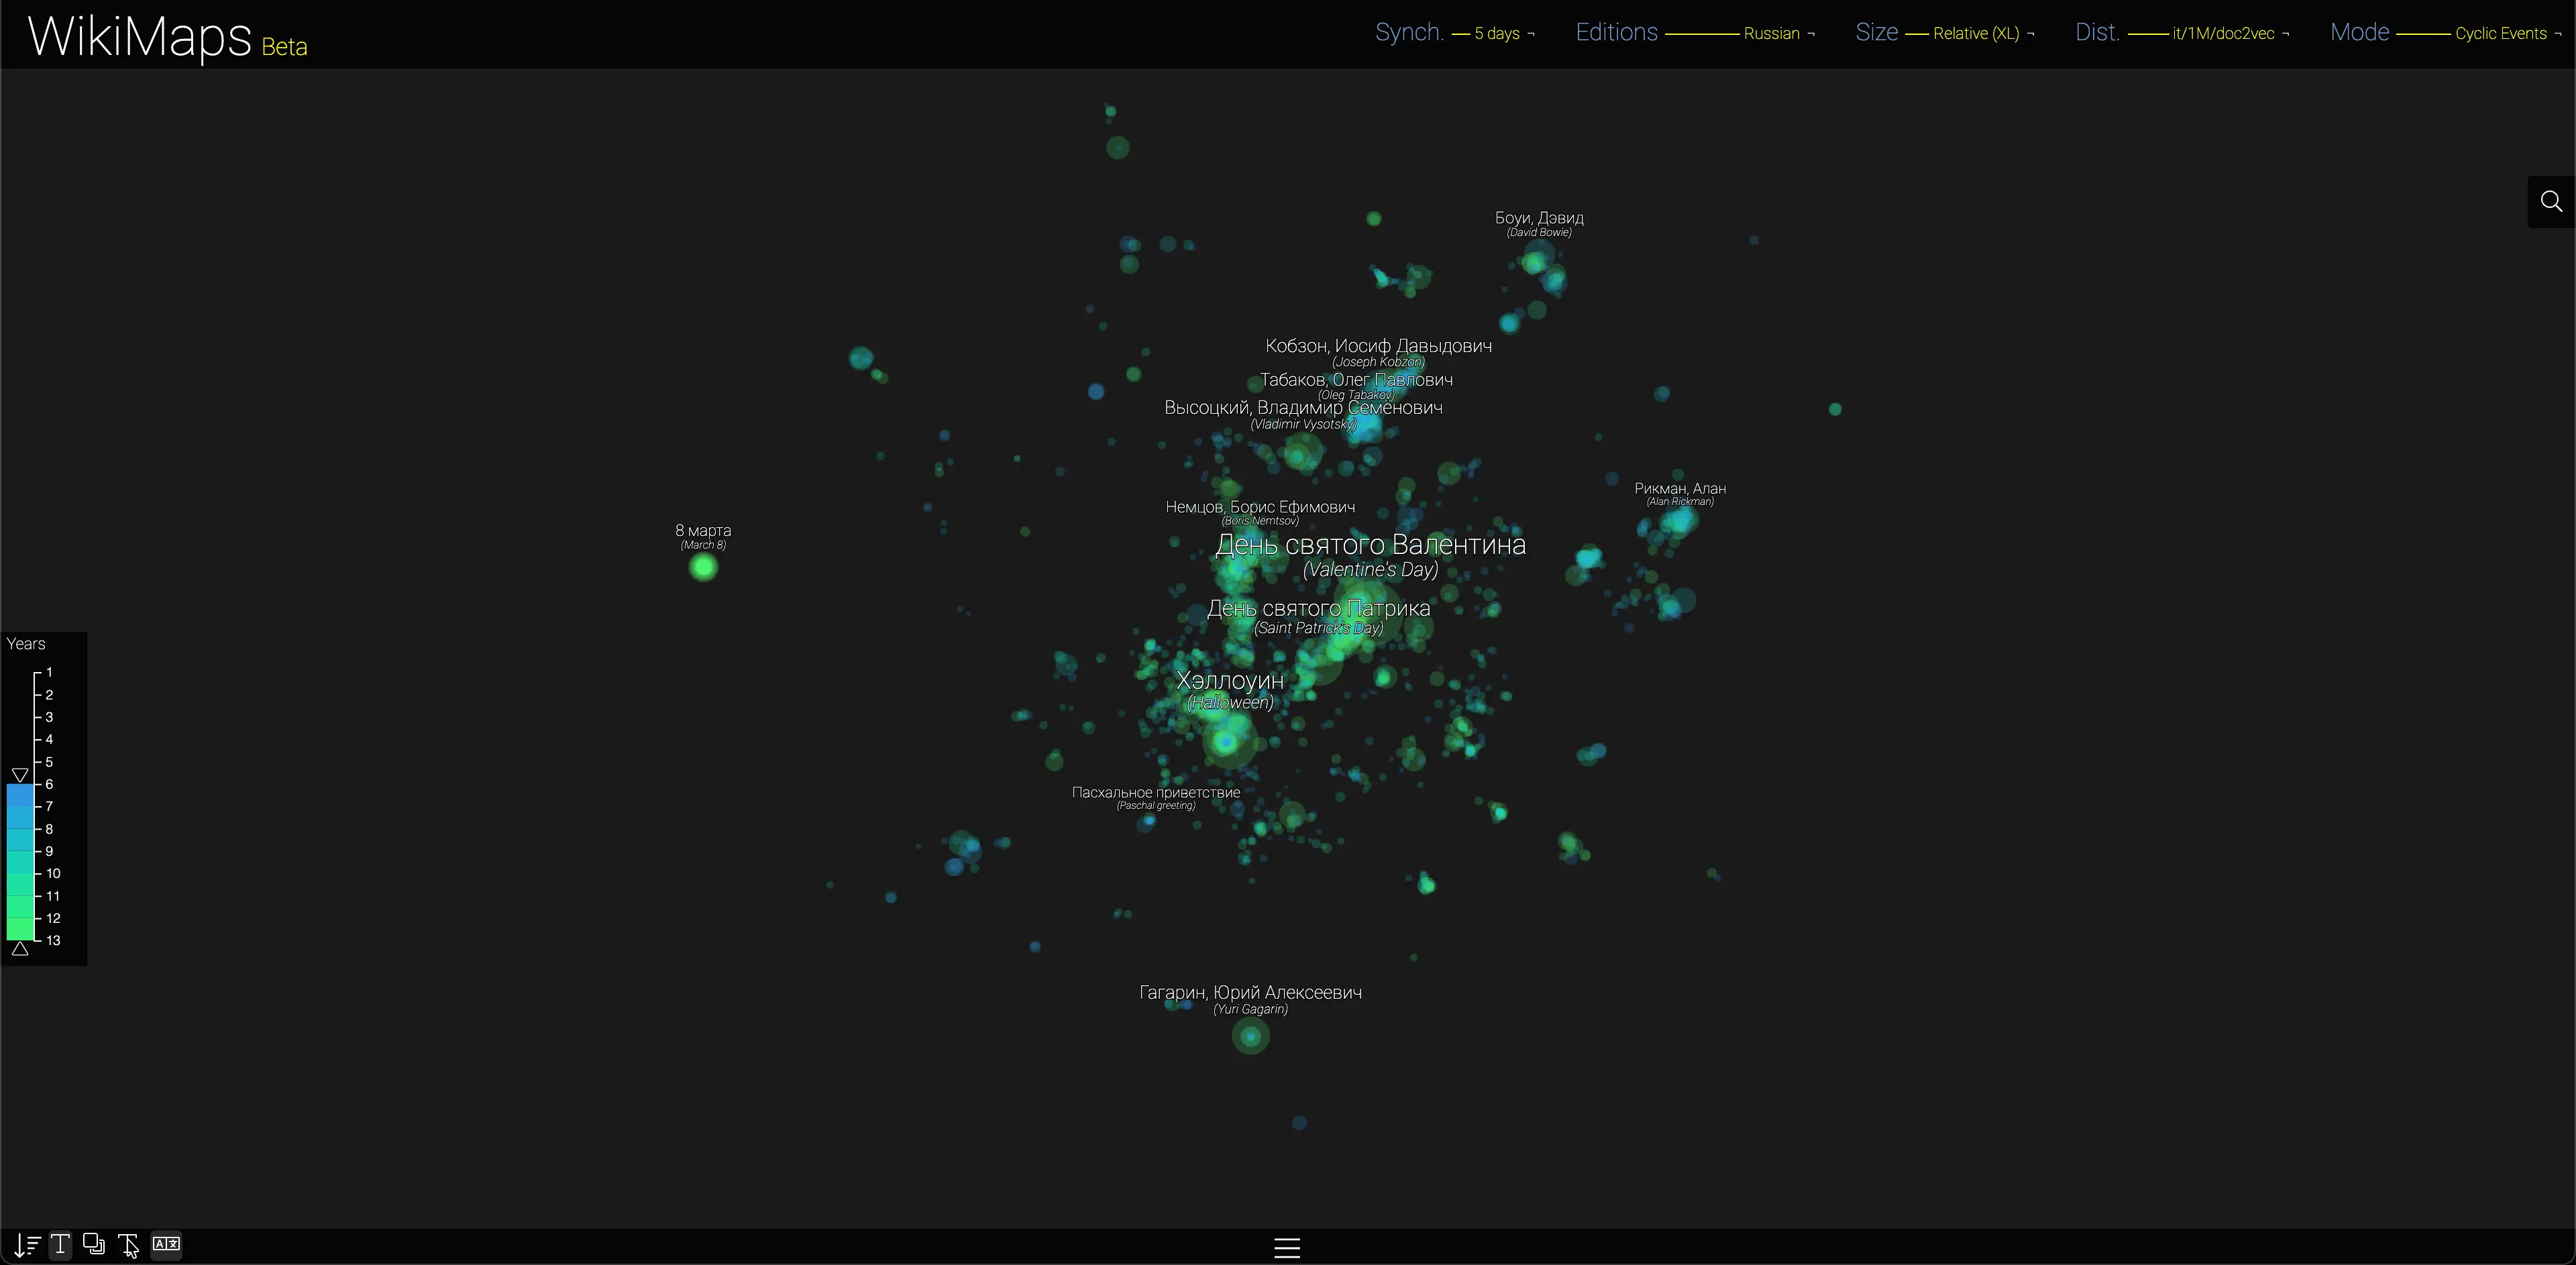
Cyclic events
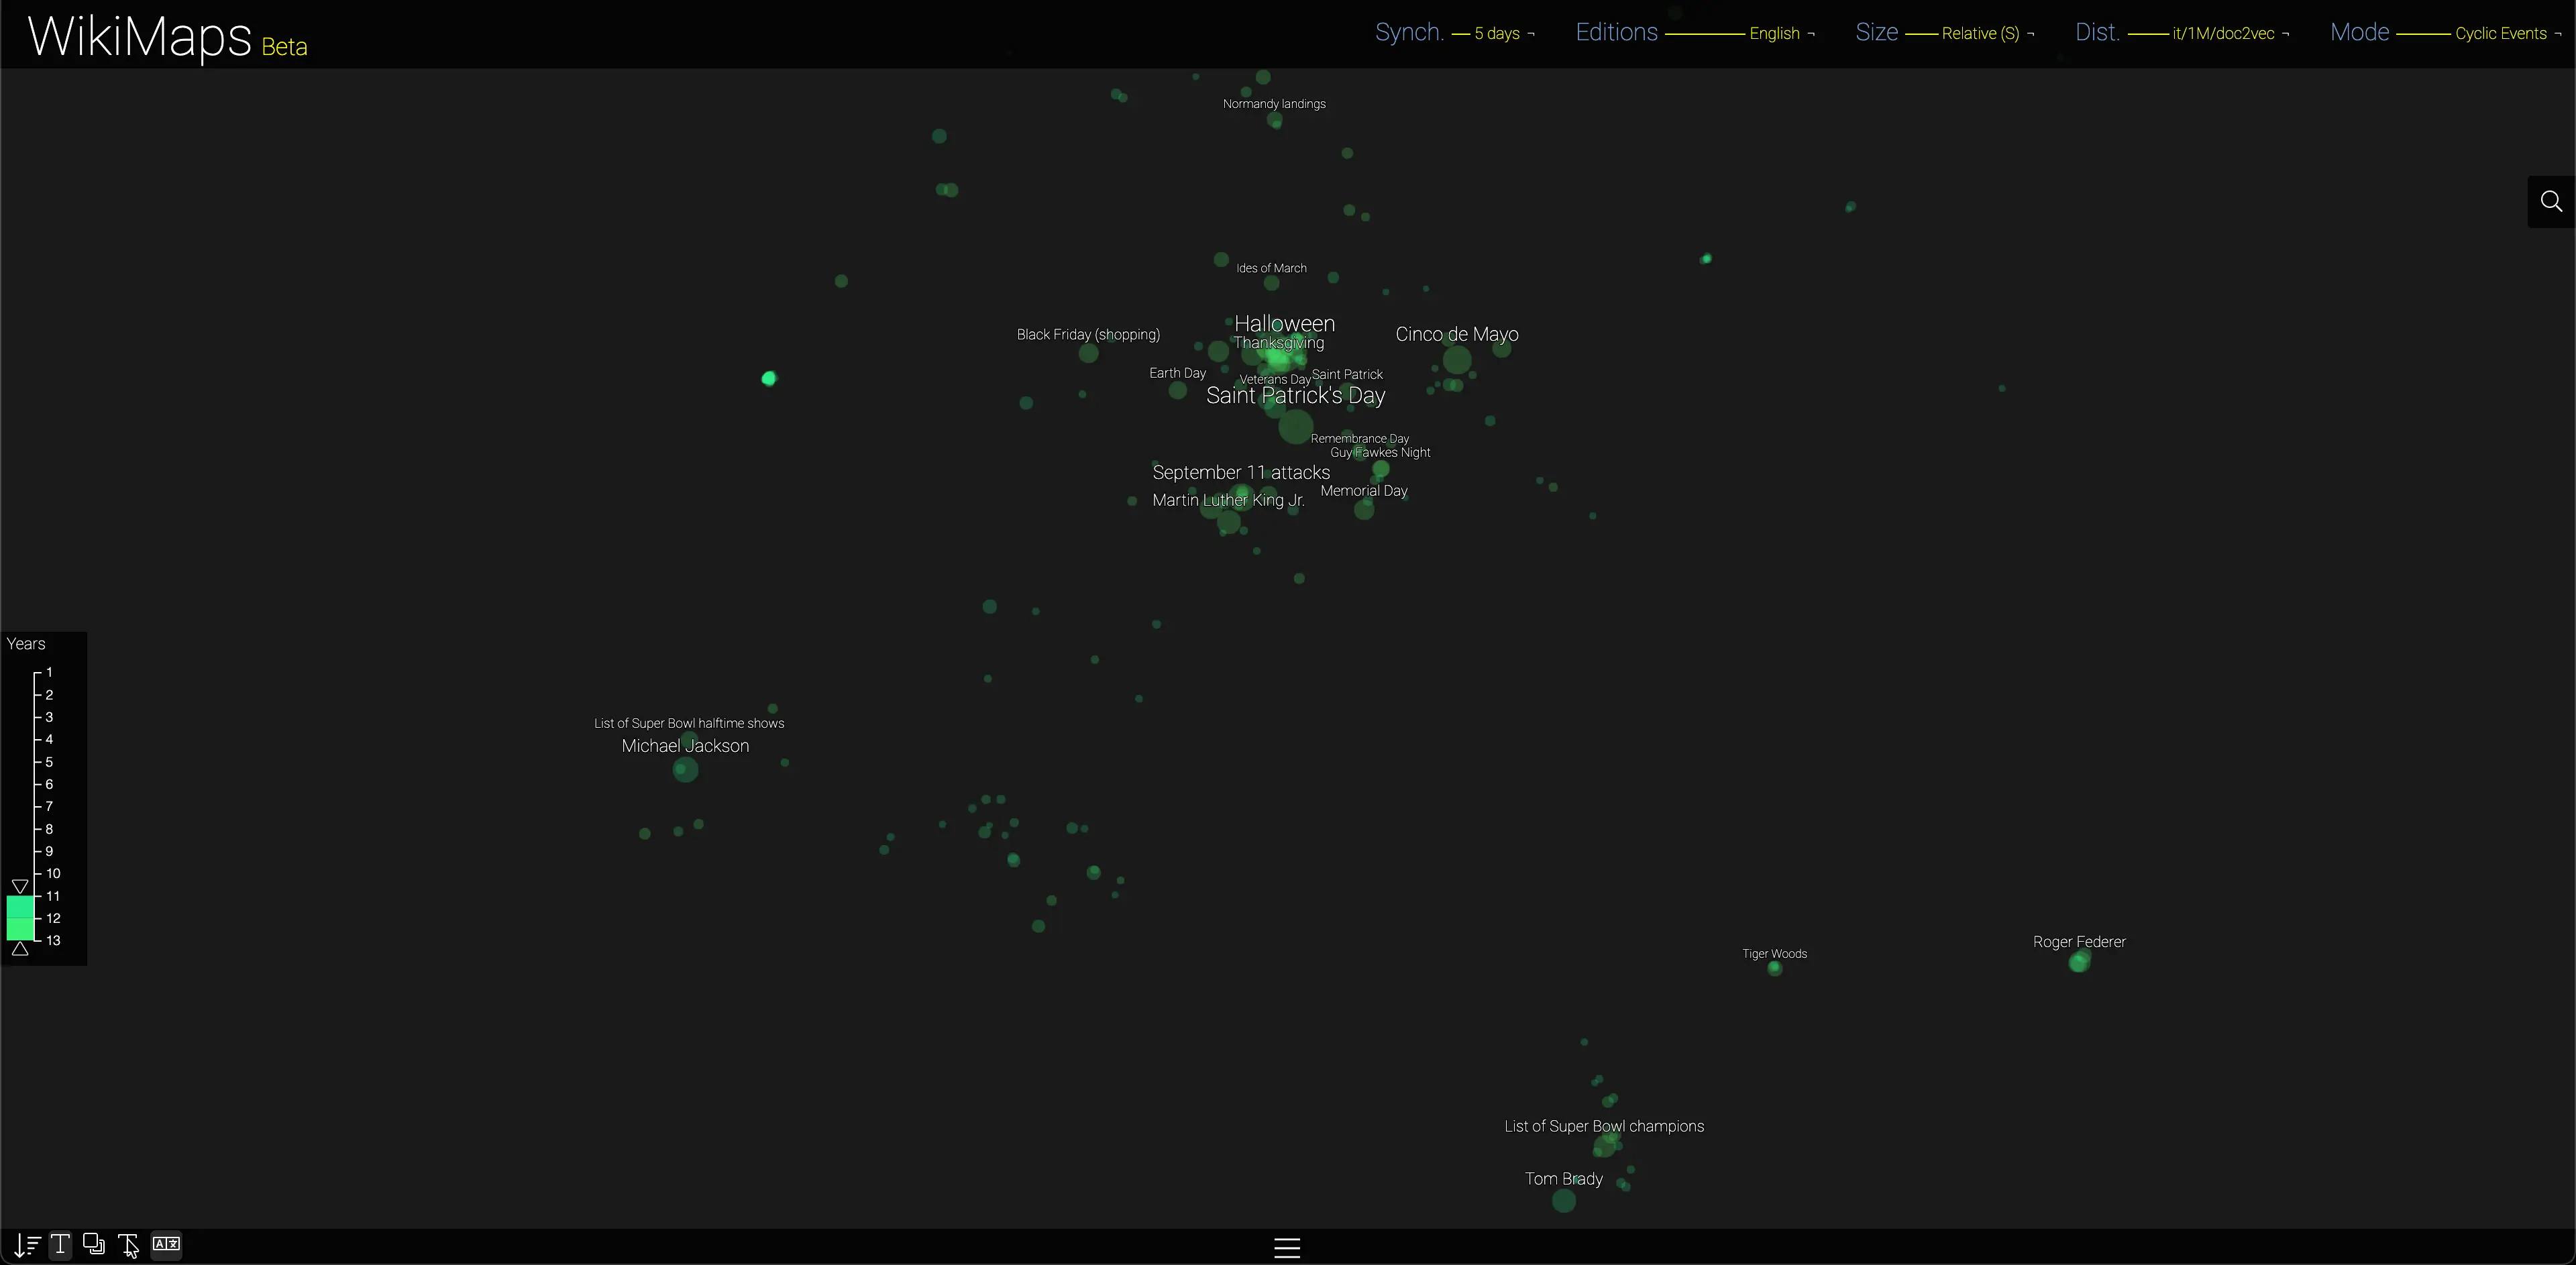
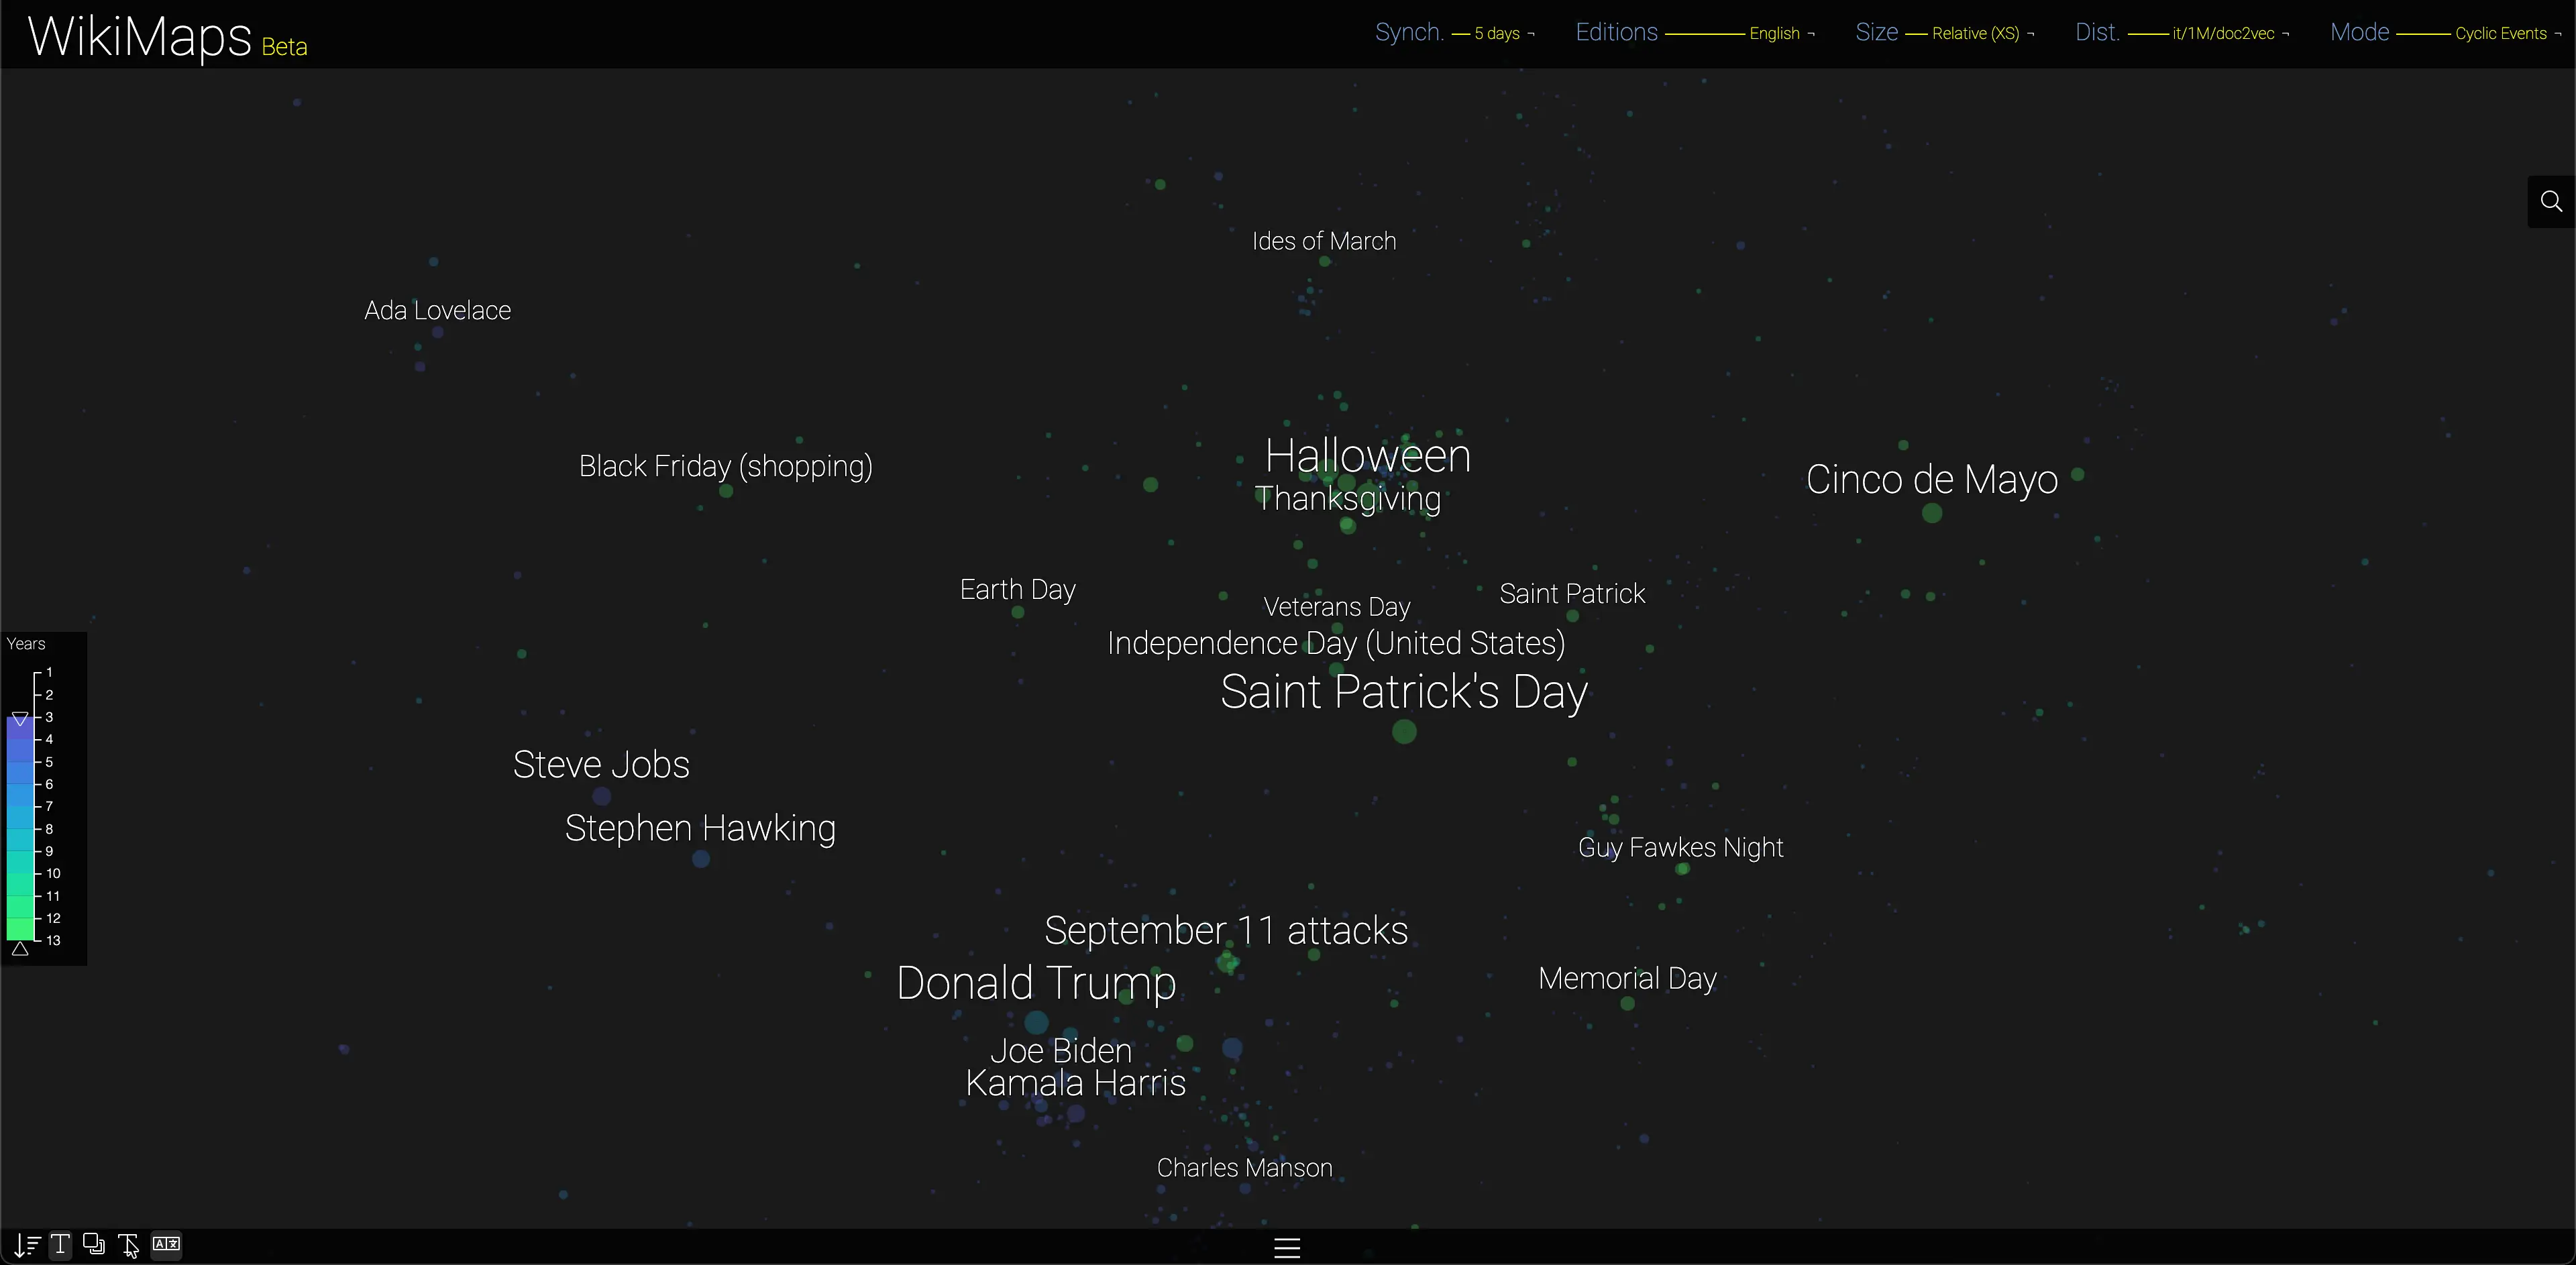
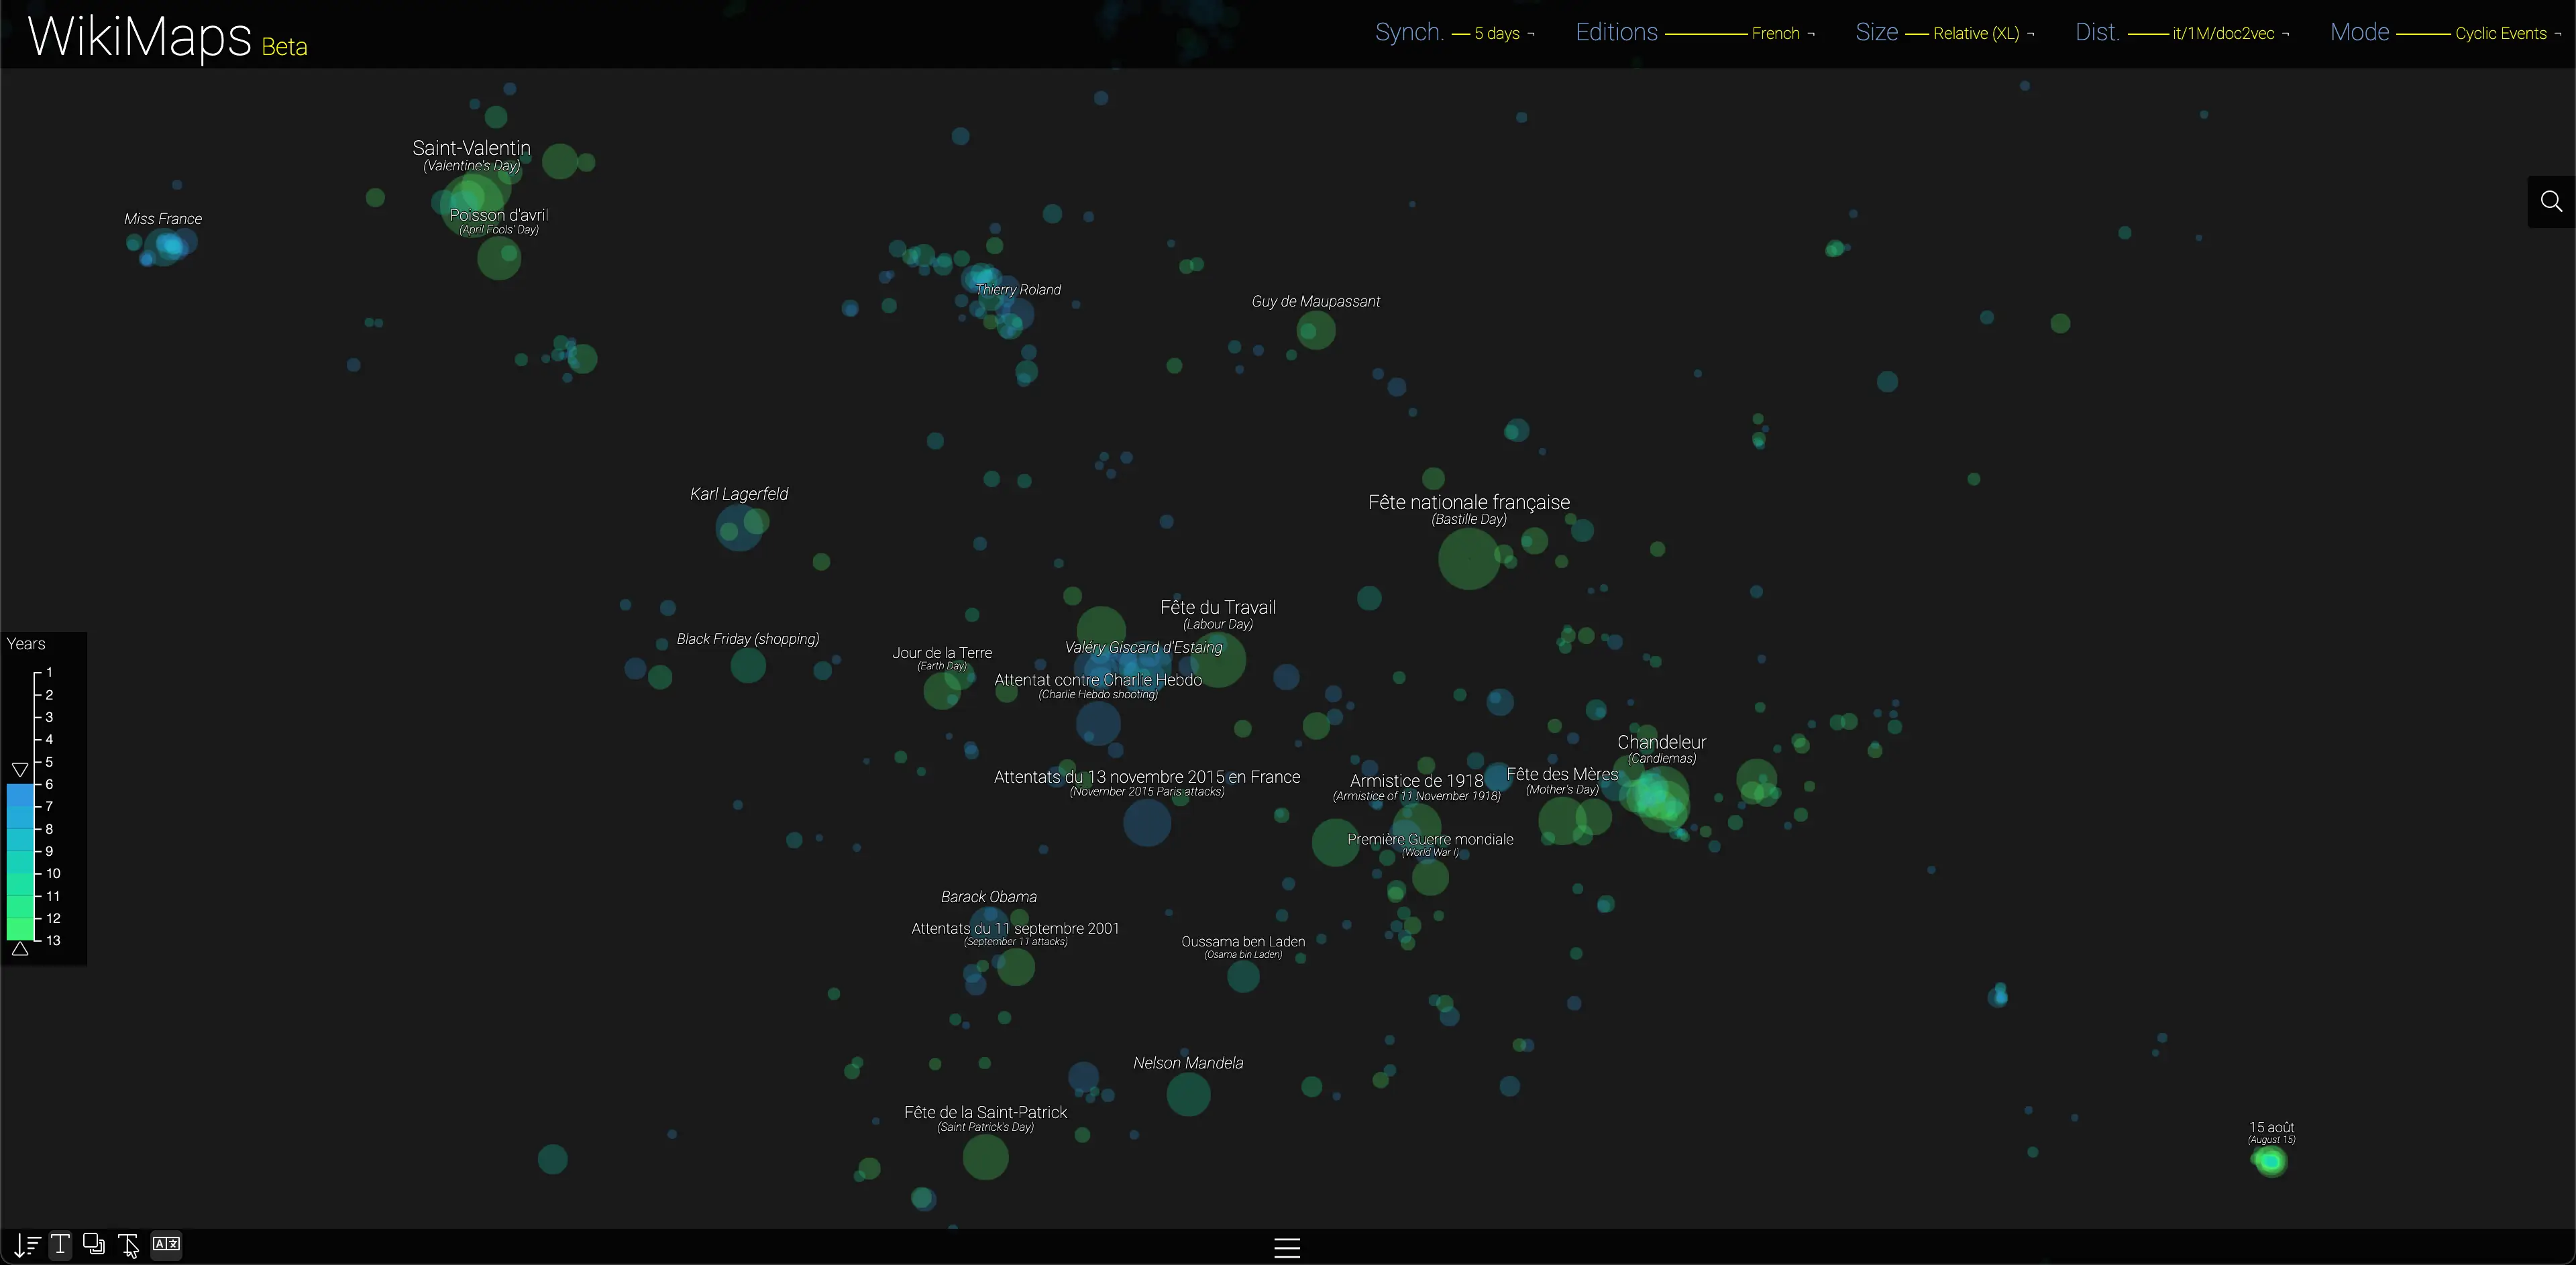
This mode explores the synchronisation of events from one year to the next. The more an event recurs over the 13 years of the WikiMaps project, the more it is considered cyclic. This mode makes it possible to explore phenomena that relate to the historical depth of collective attention, whether commemorations, ceremonies or celebrations that organise collective life.
Global events
This mode explores the synchronisation of events between the different editions of Wikipedia. The more an event is synchronised across the 38 language editions of WikiMaps, the more global it is likely to be.
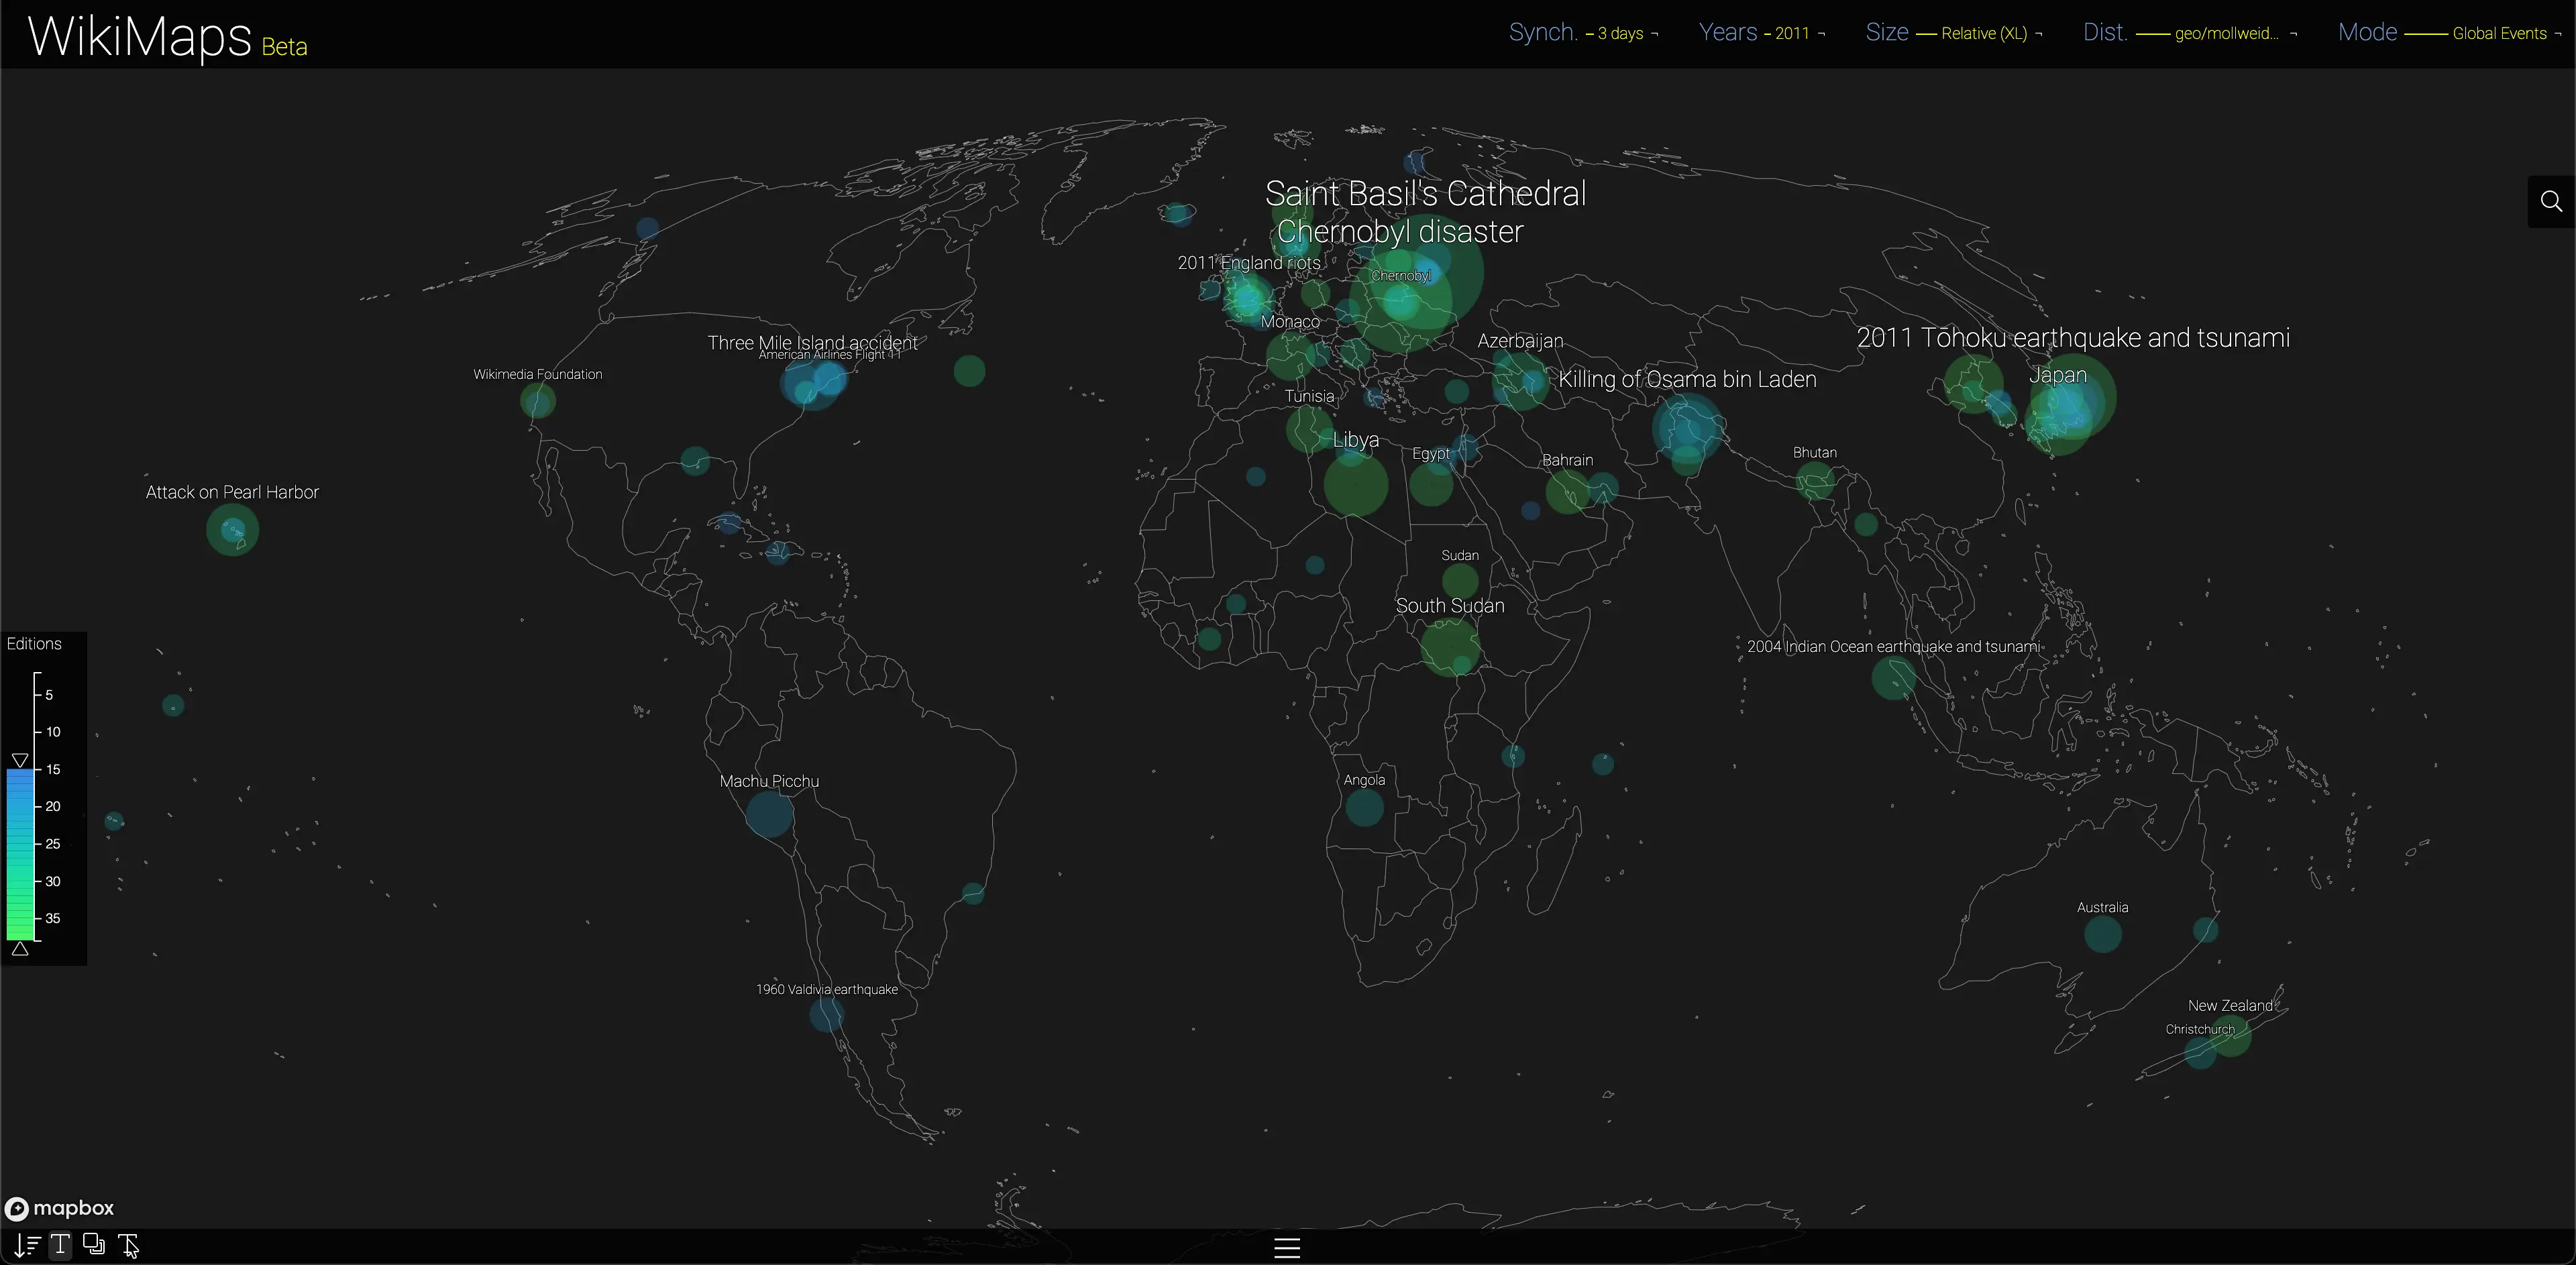
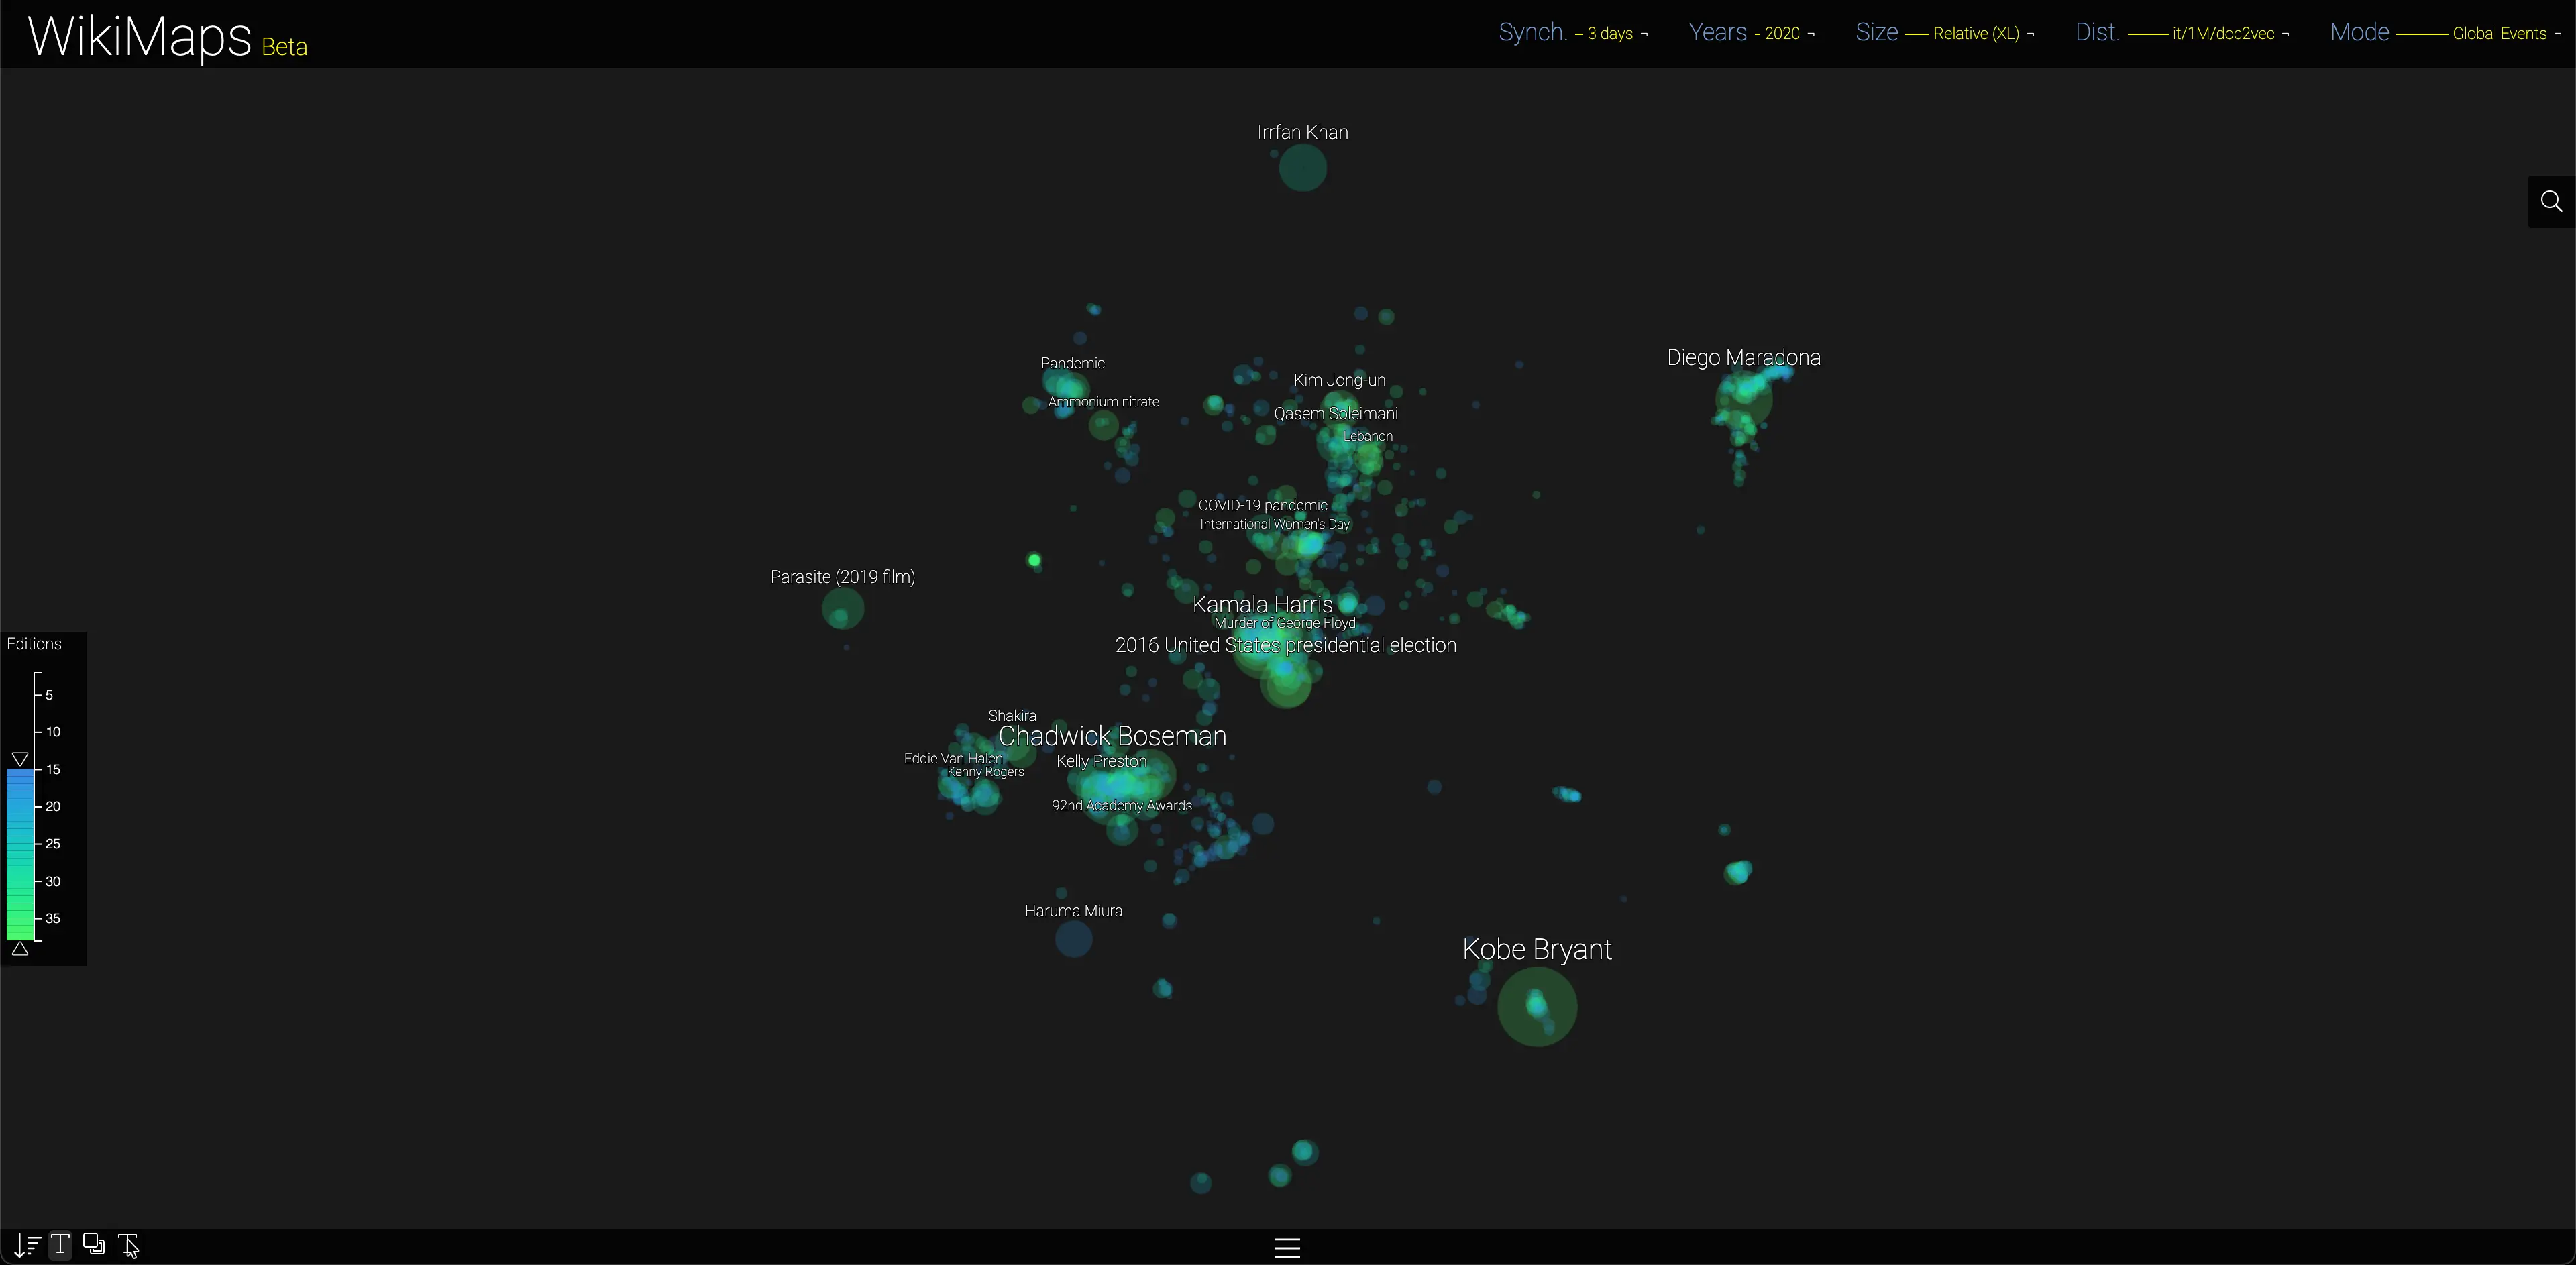
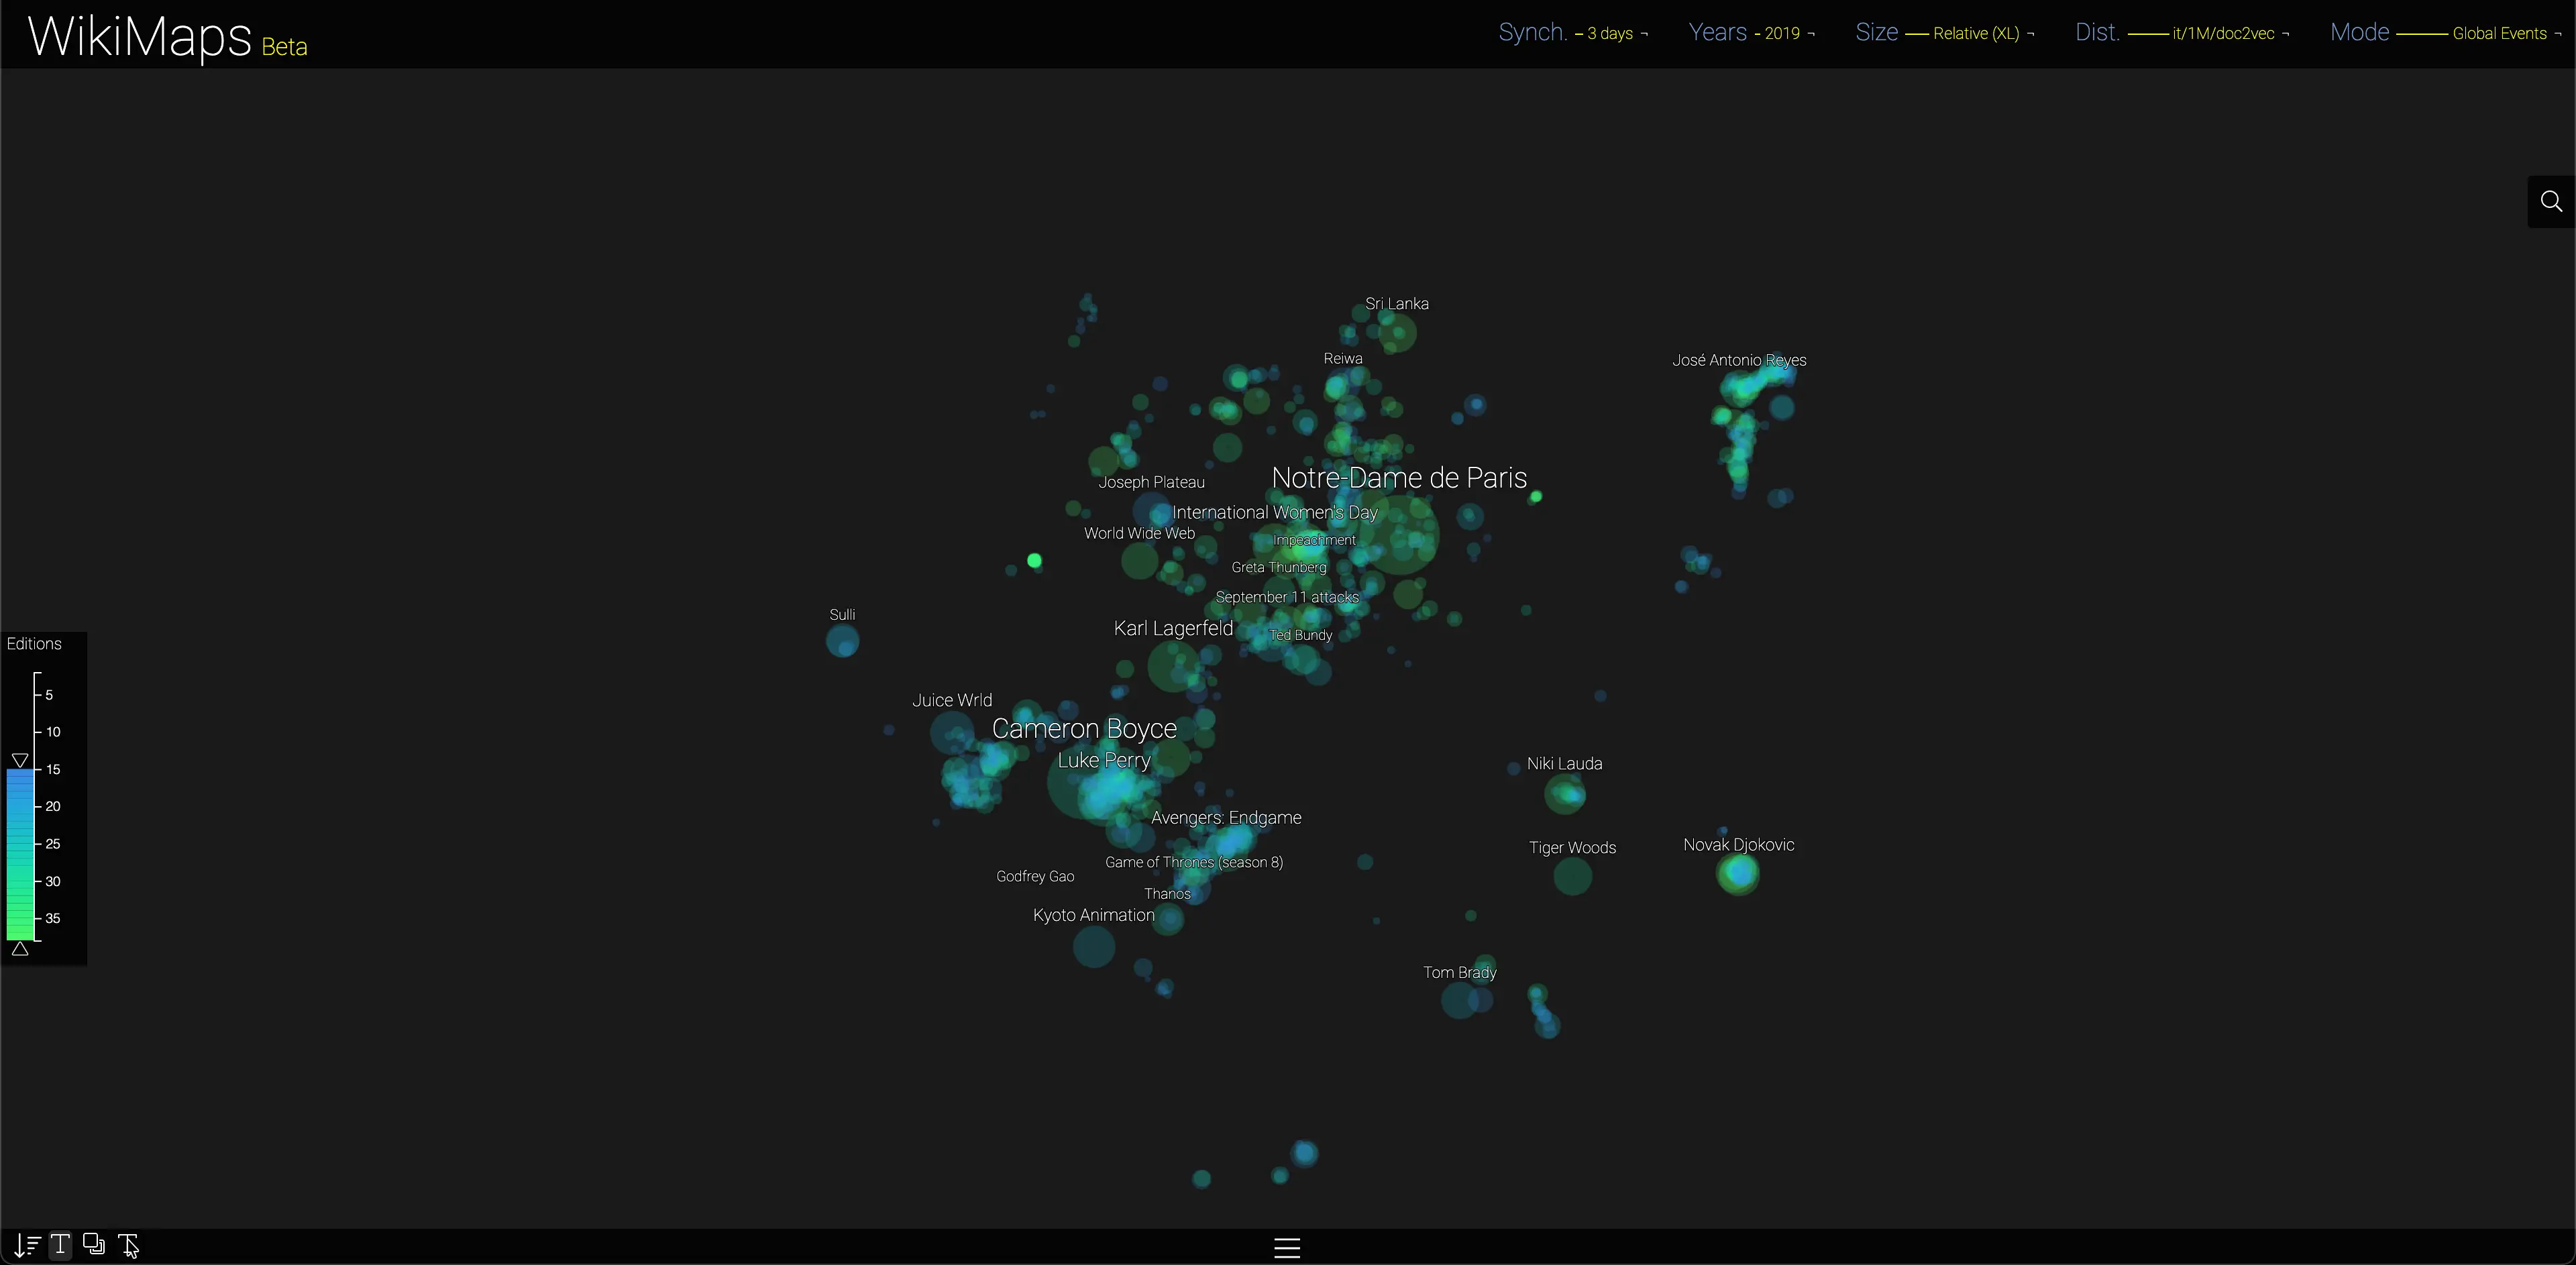
Google Doodles appear to be very powerful triggers of collective attention. In 2011, despite the Fukushima industrial accident and the death of Osama bin Laden, the spatialised page that aroused the greatest sudden attention was that of Saint Basil’s Cathedral. It was in fact a Google Doodle celebrating the 450th anniversary of the cathedral.
Global attentions
This mode explores pages according to the globality of their pageviews. It looks for the presence of a page of the English edition in other languages, then considers the number of editions in which the page arouses significant interest (as a proportion of the overall attention of each edition). It is possible to display only the pages that receive attention in a high number of editions, in order to focus the exploration on the most globalised pages.
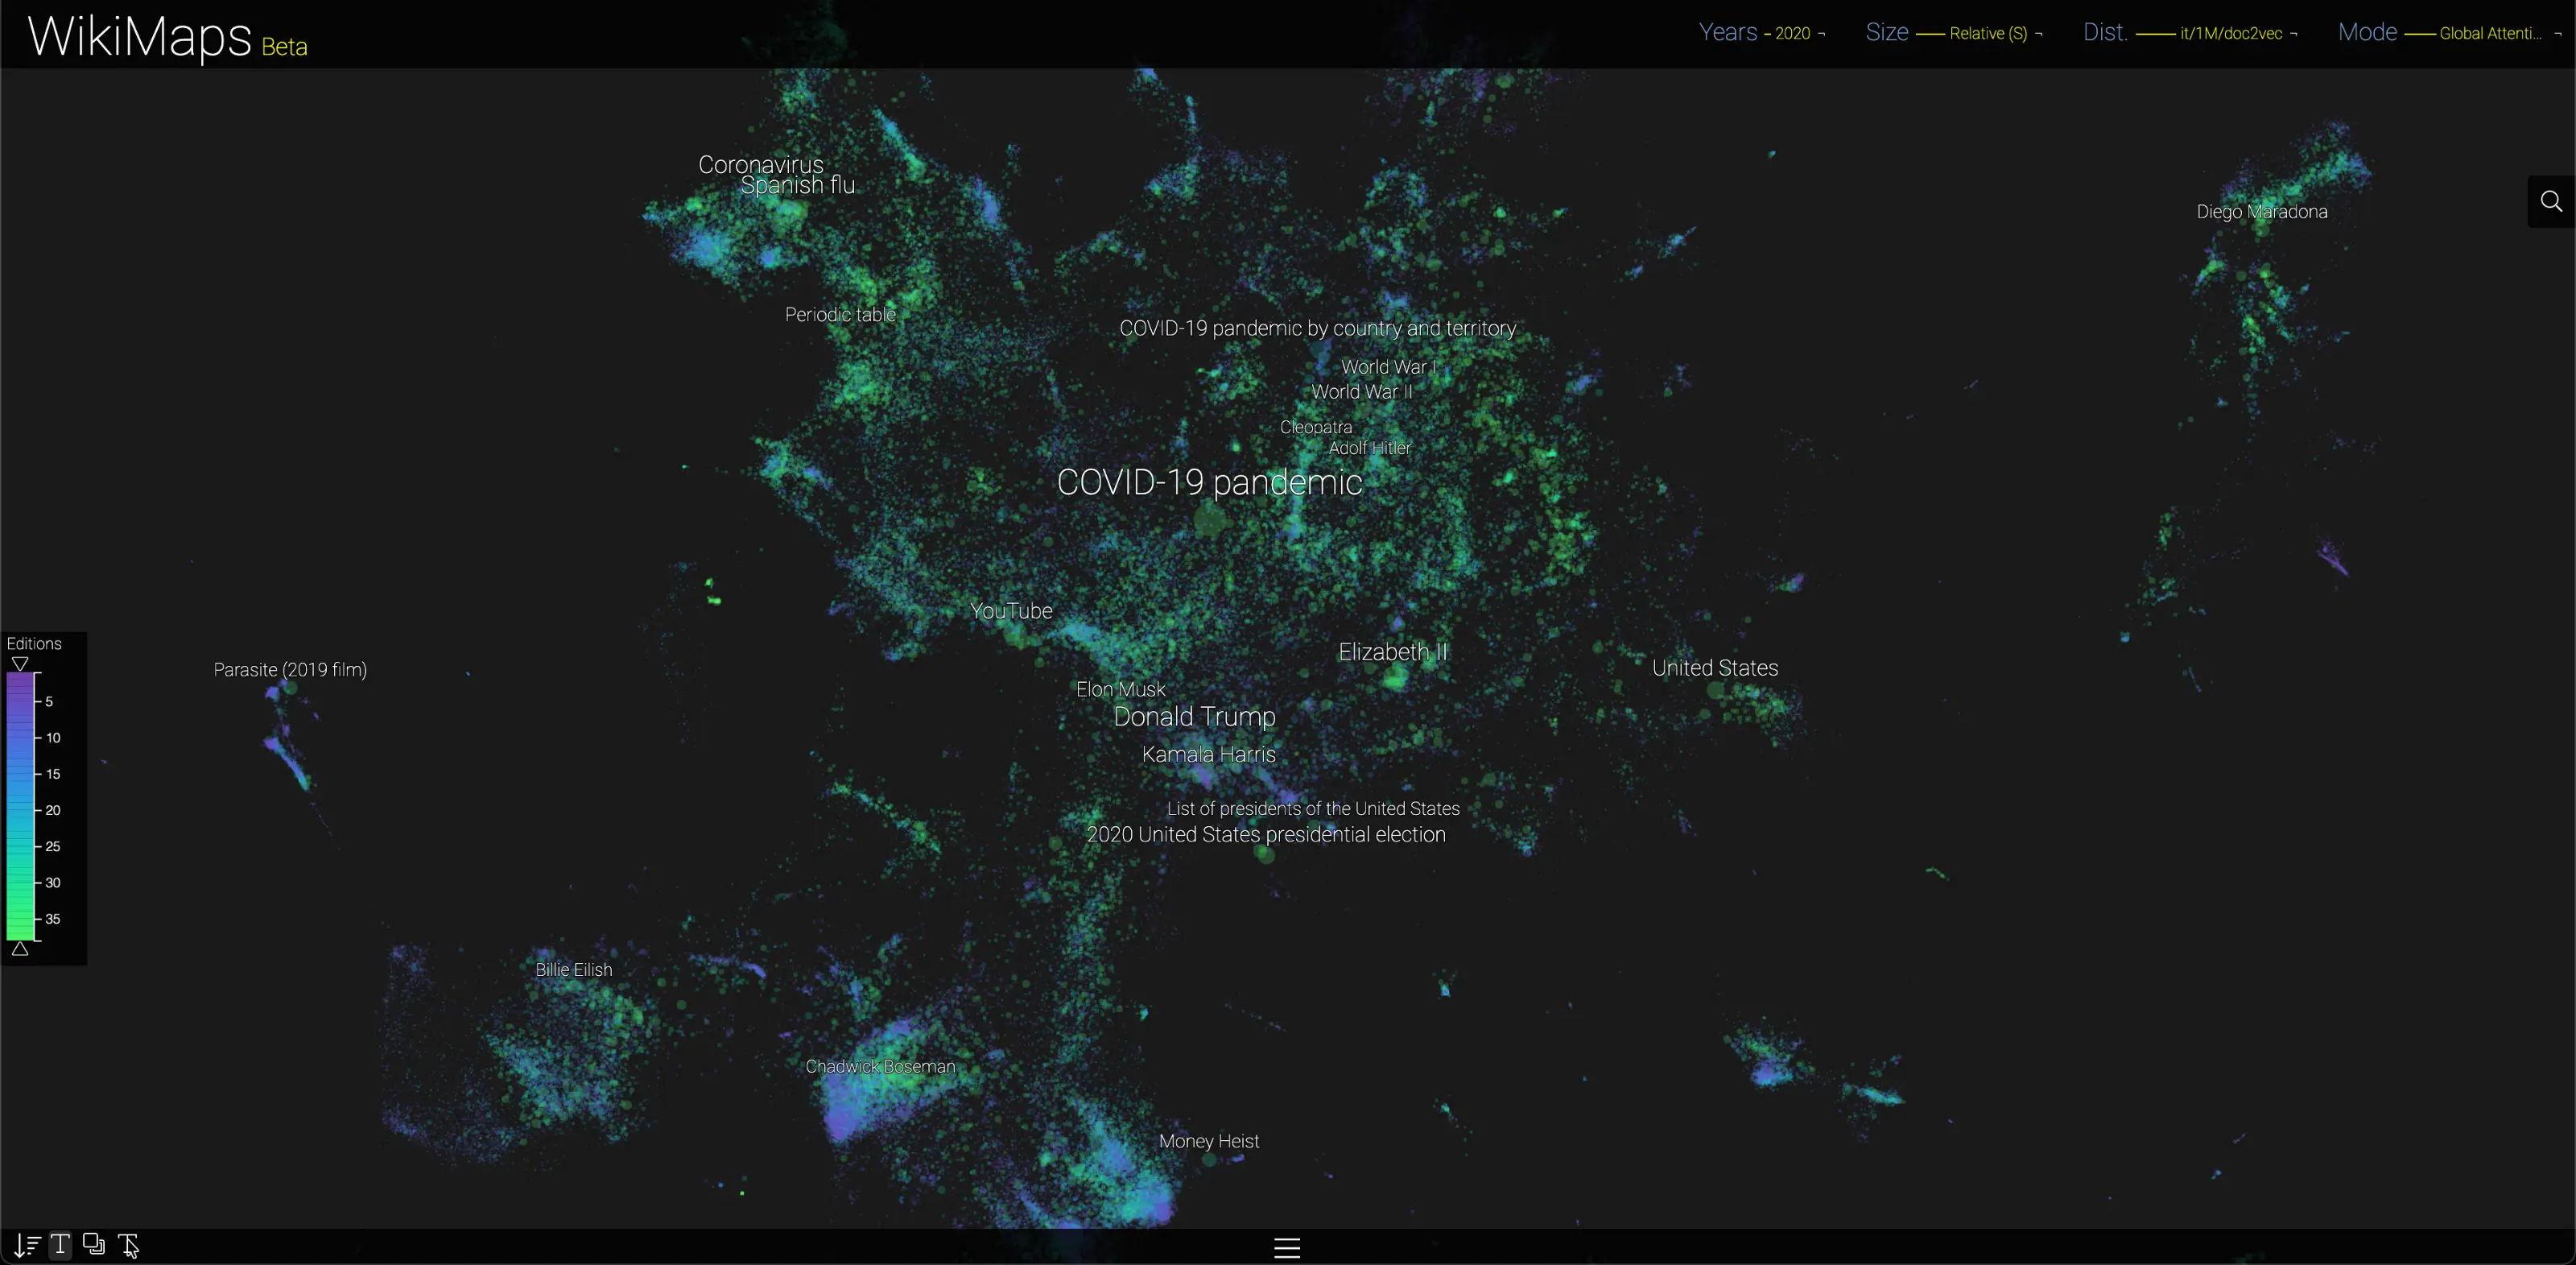
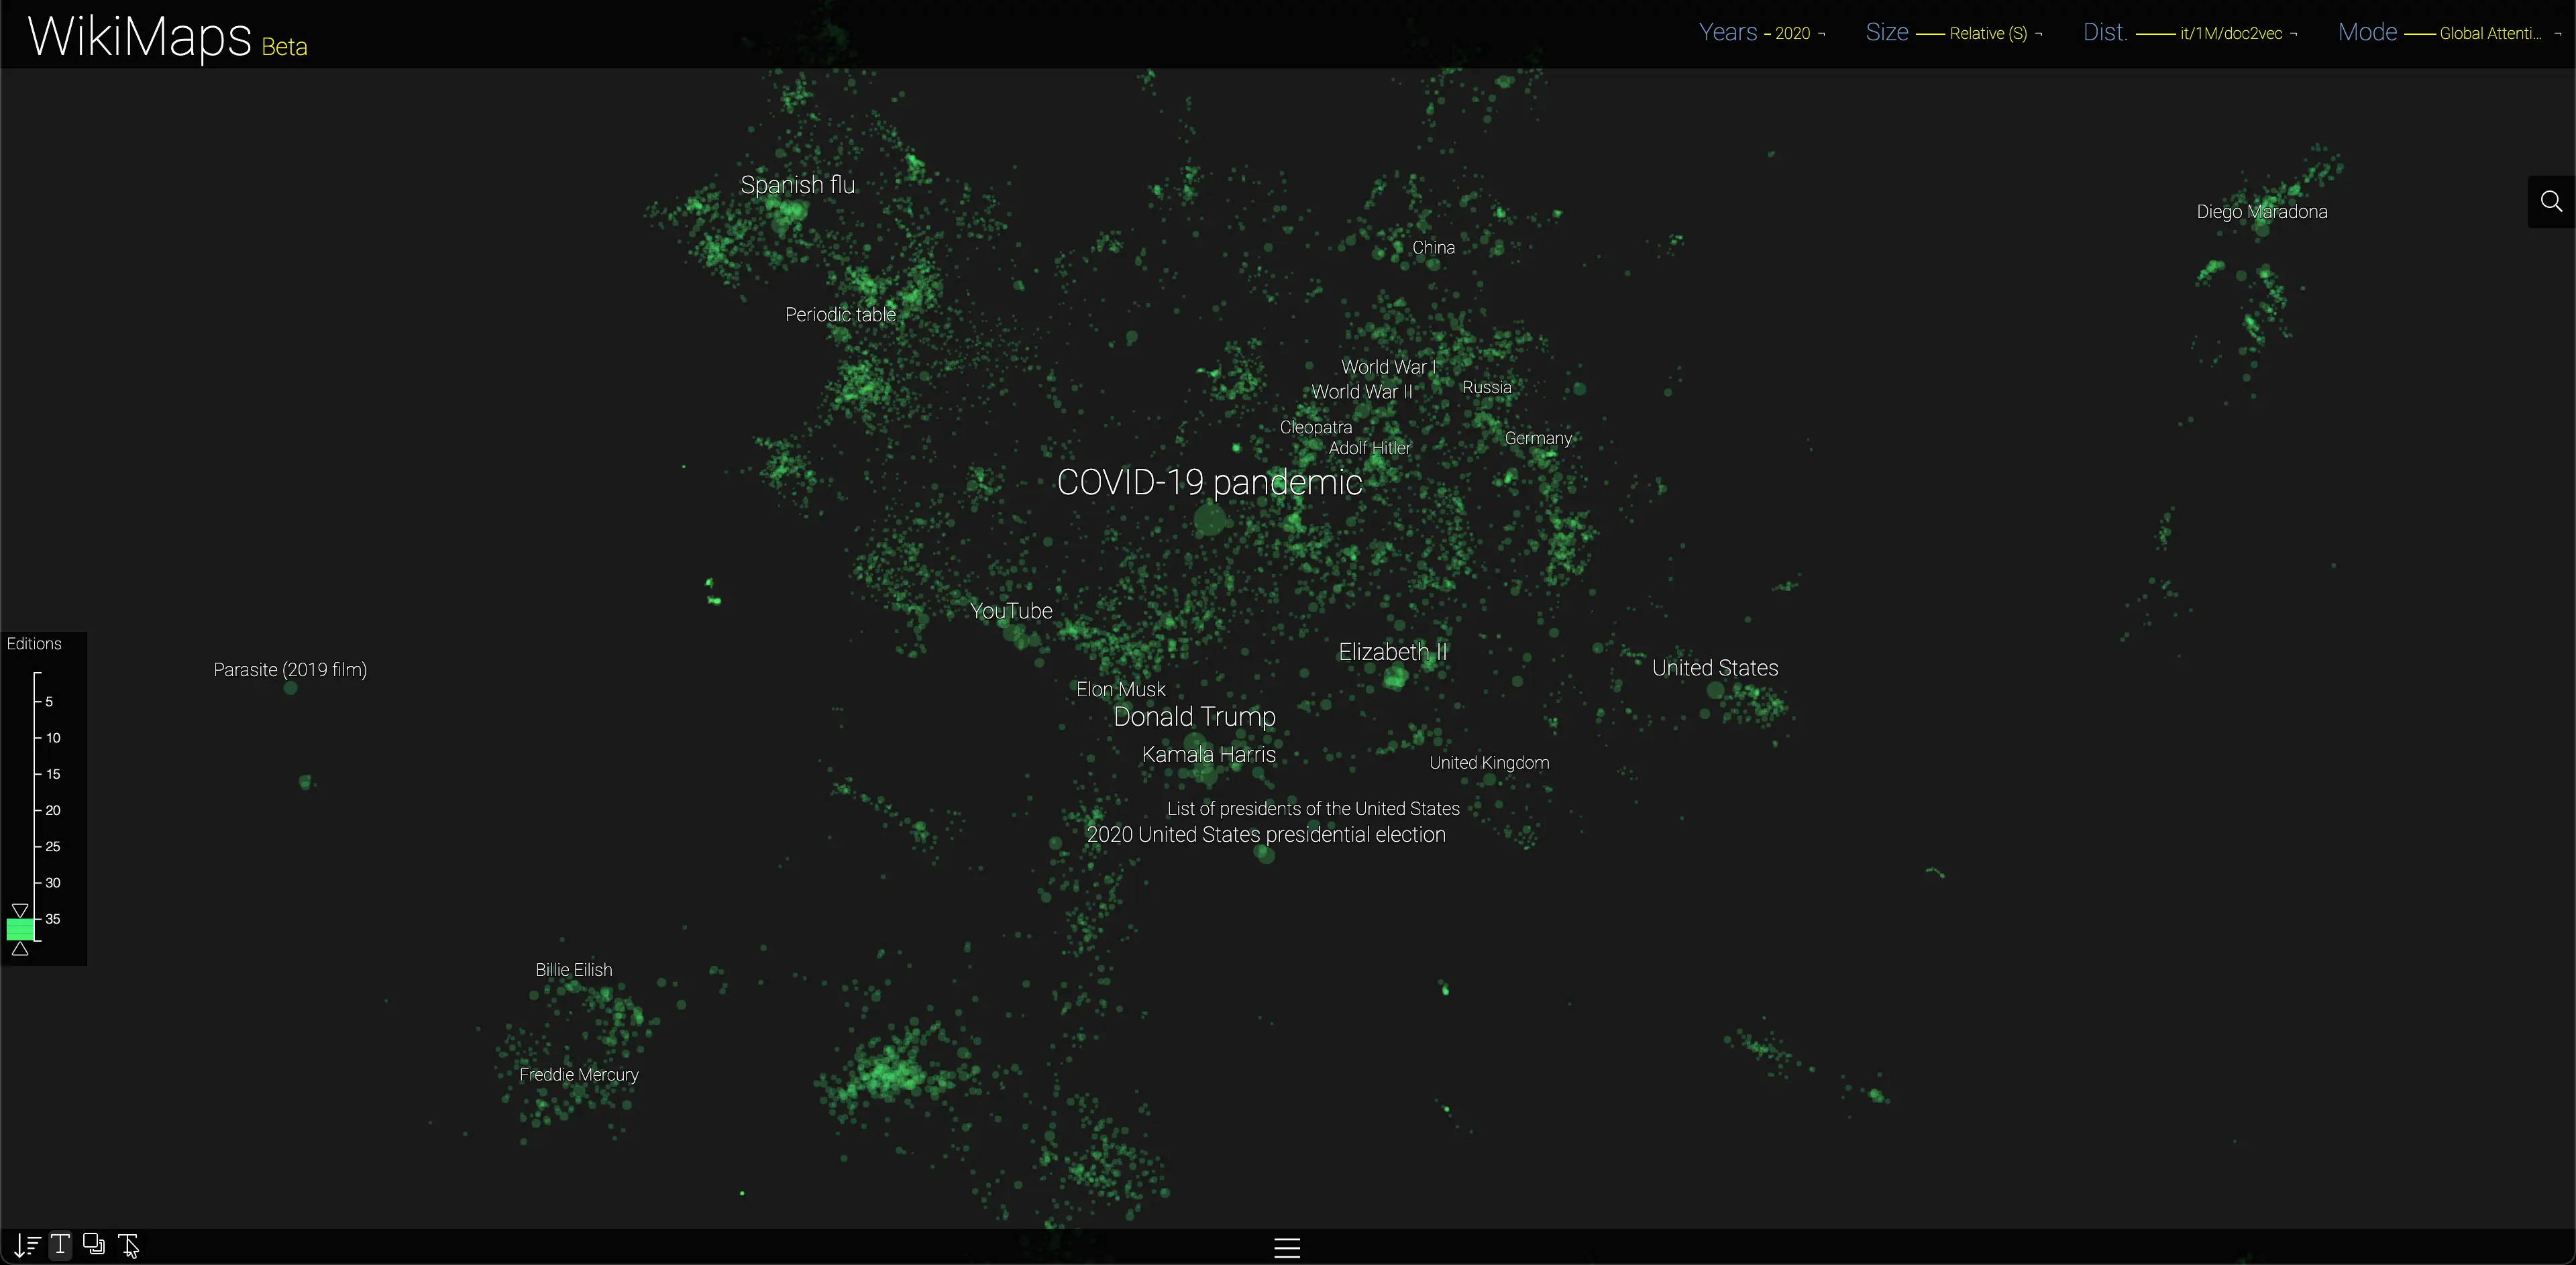
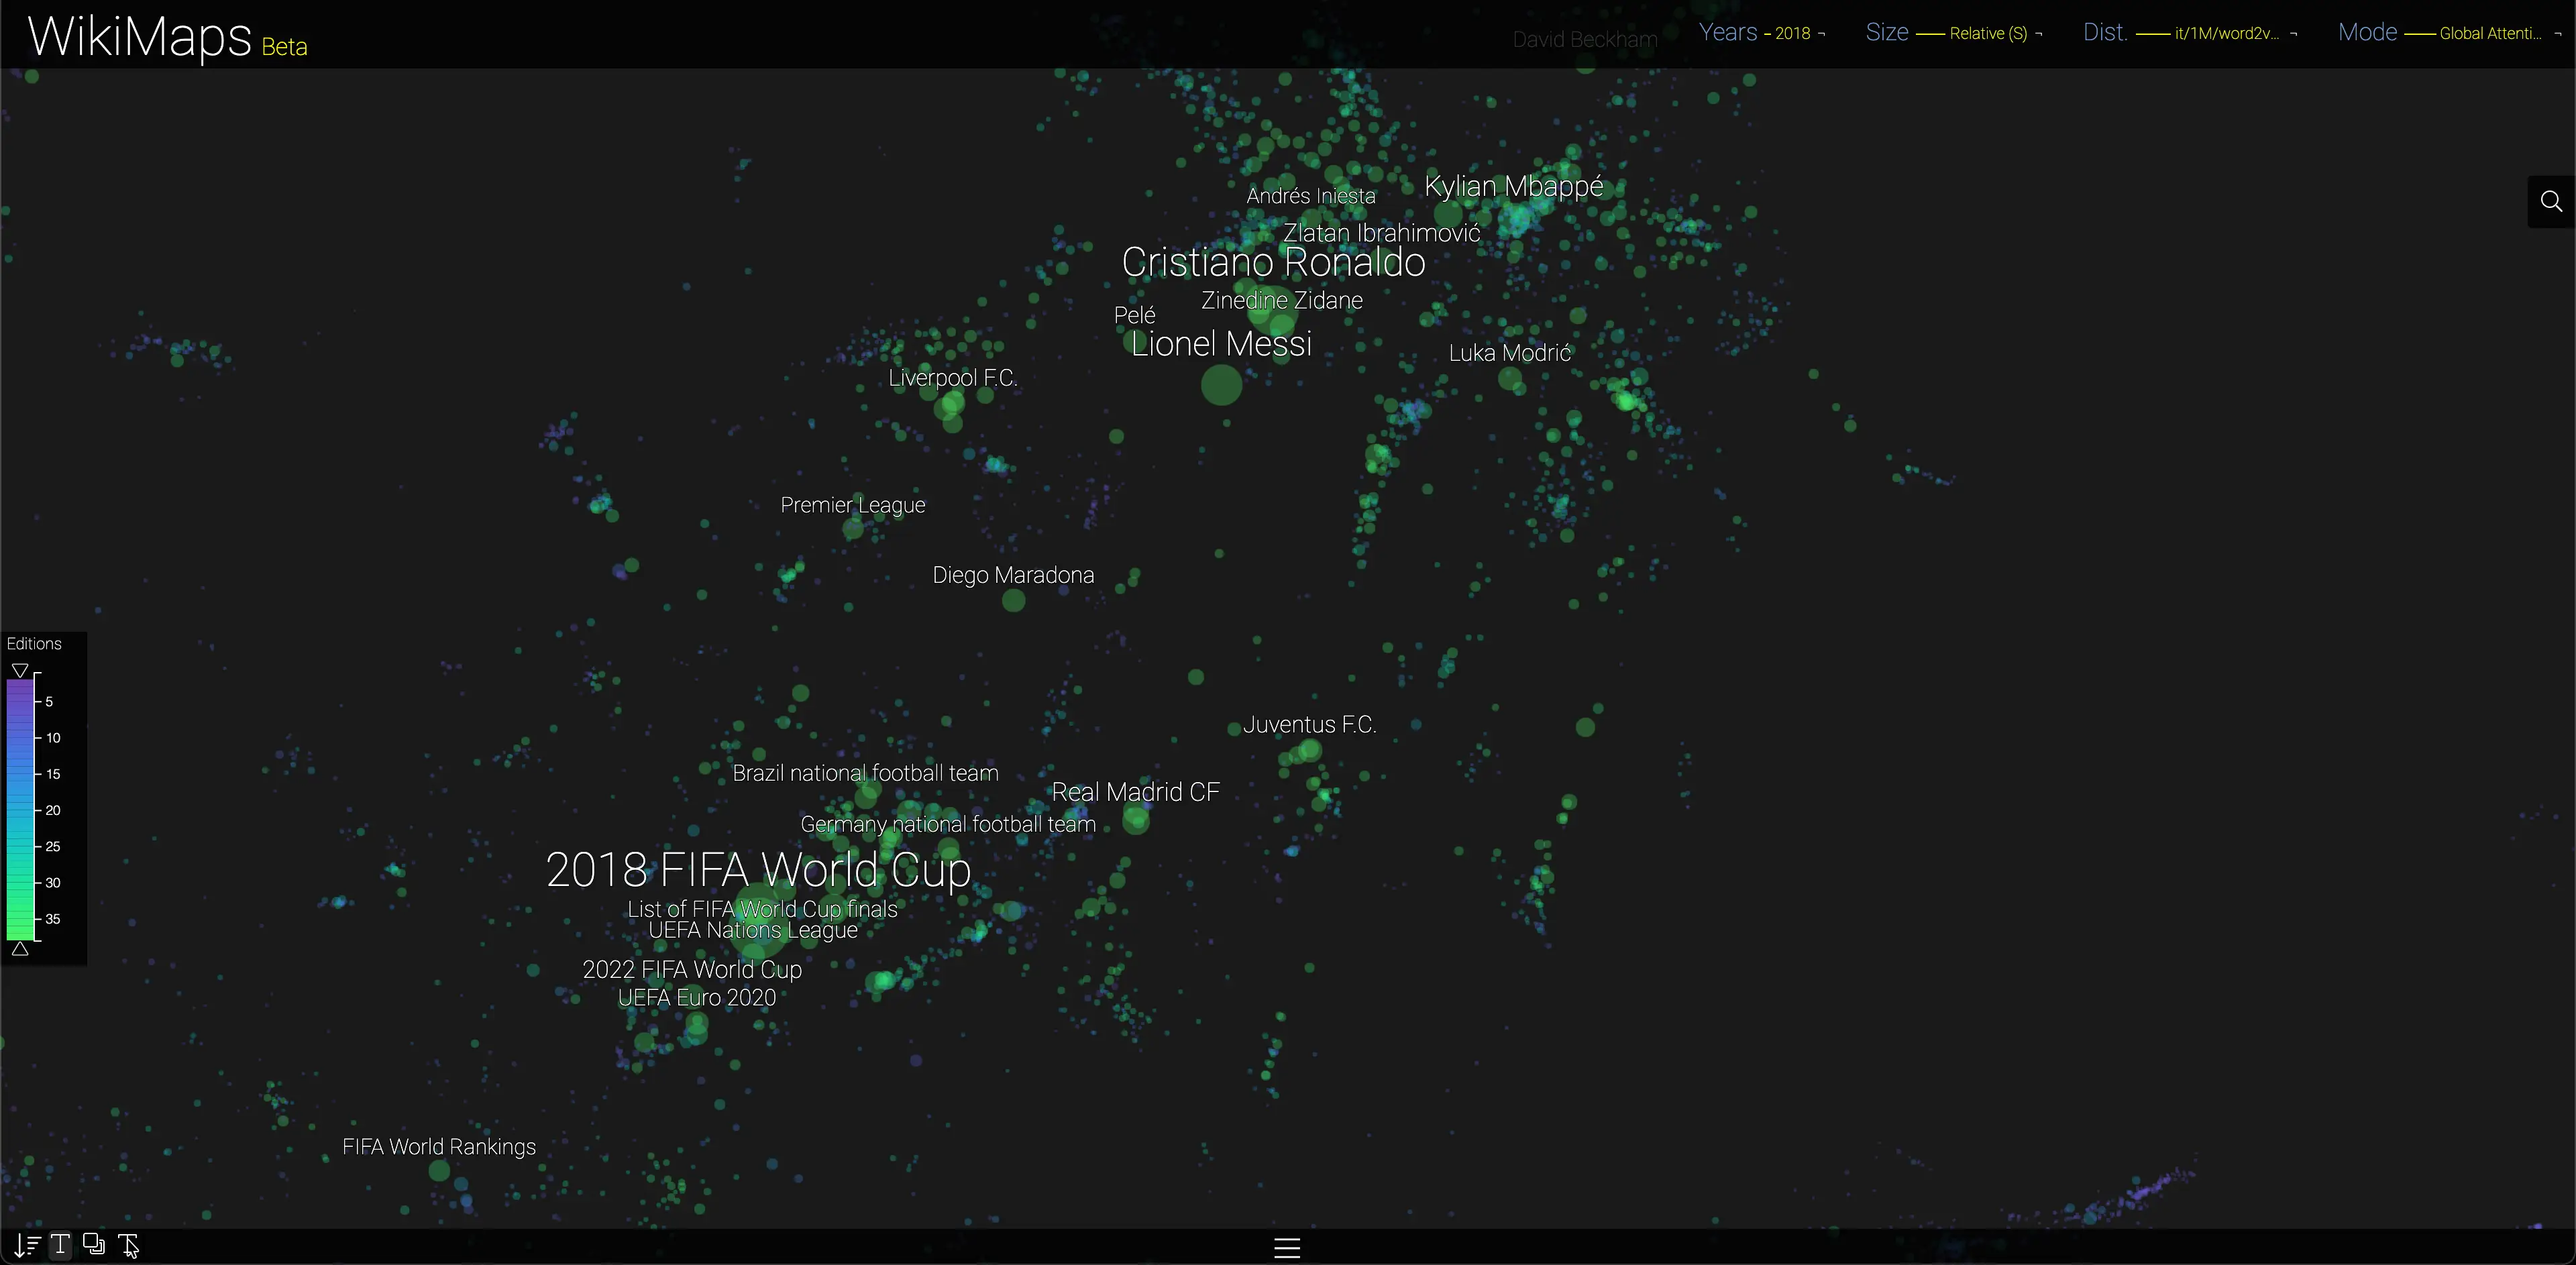
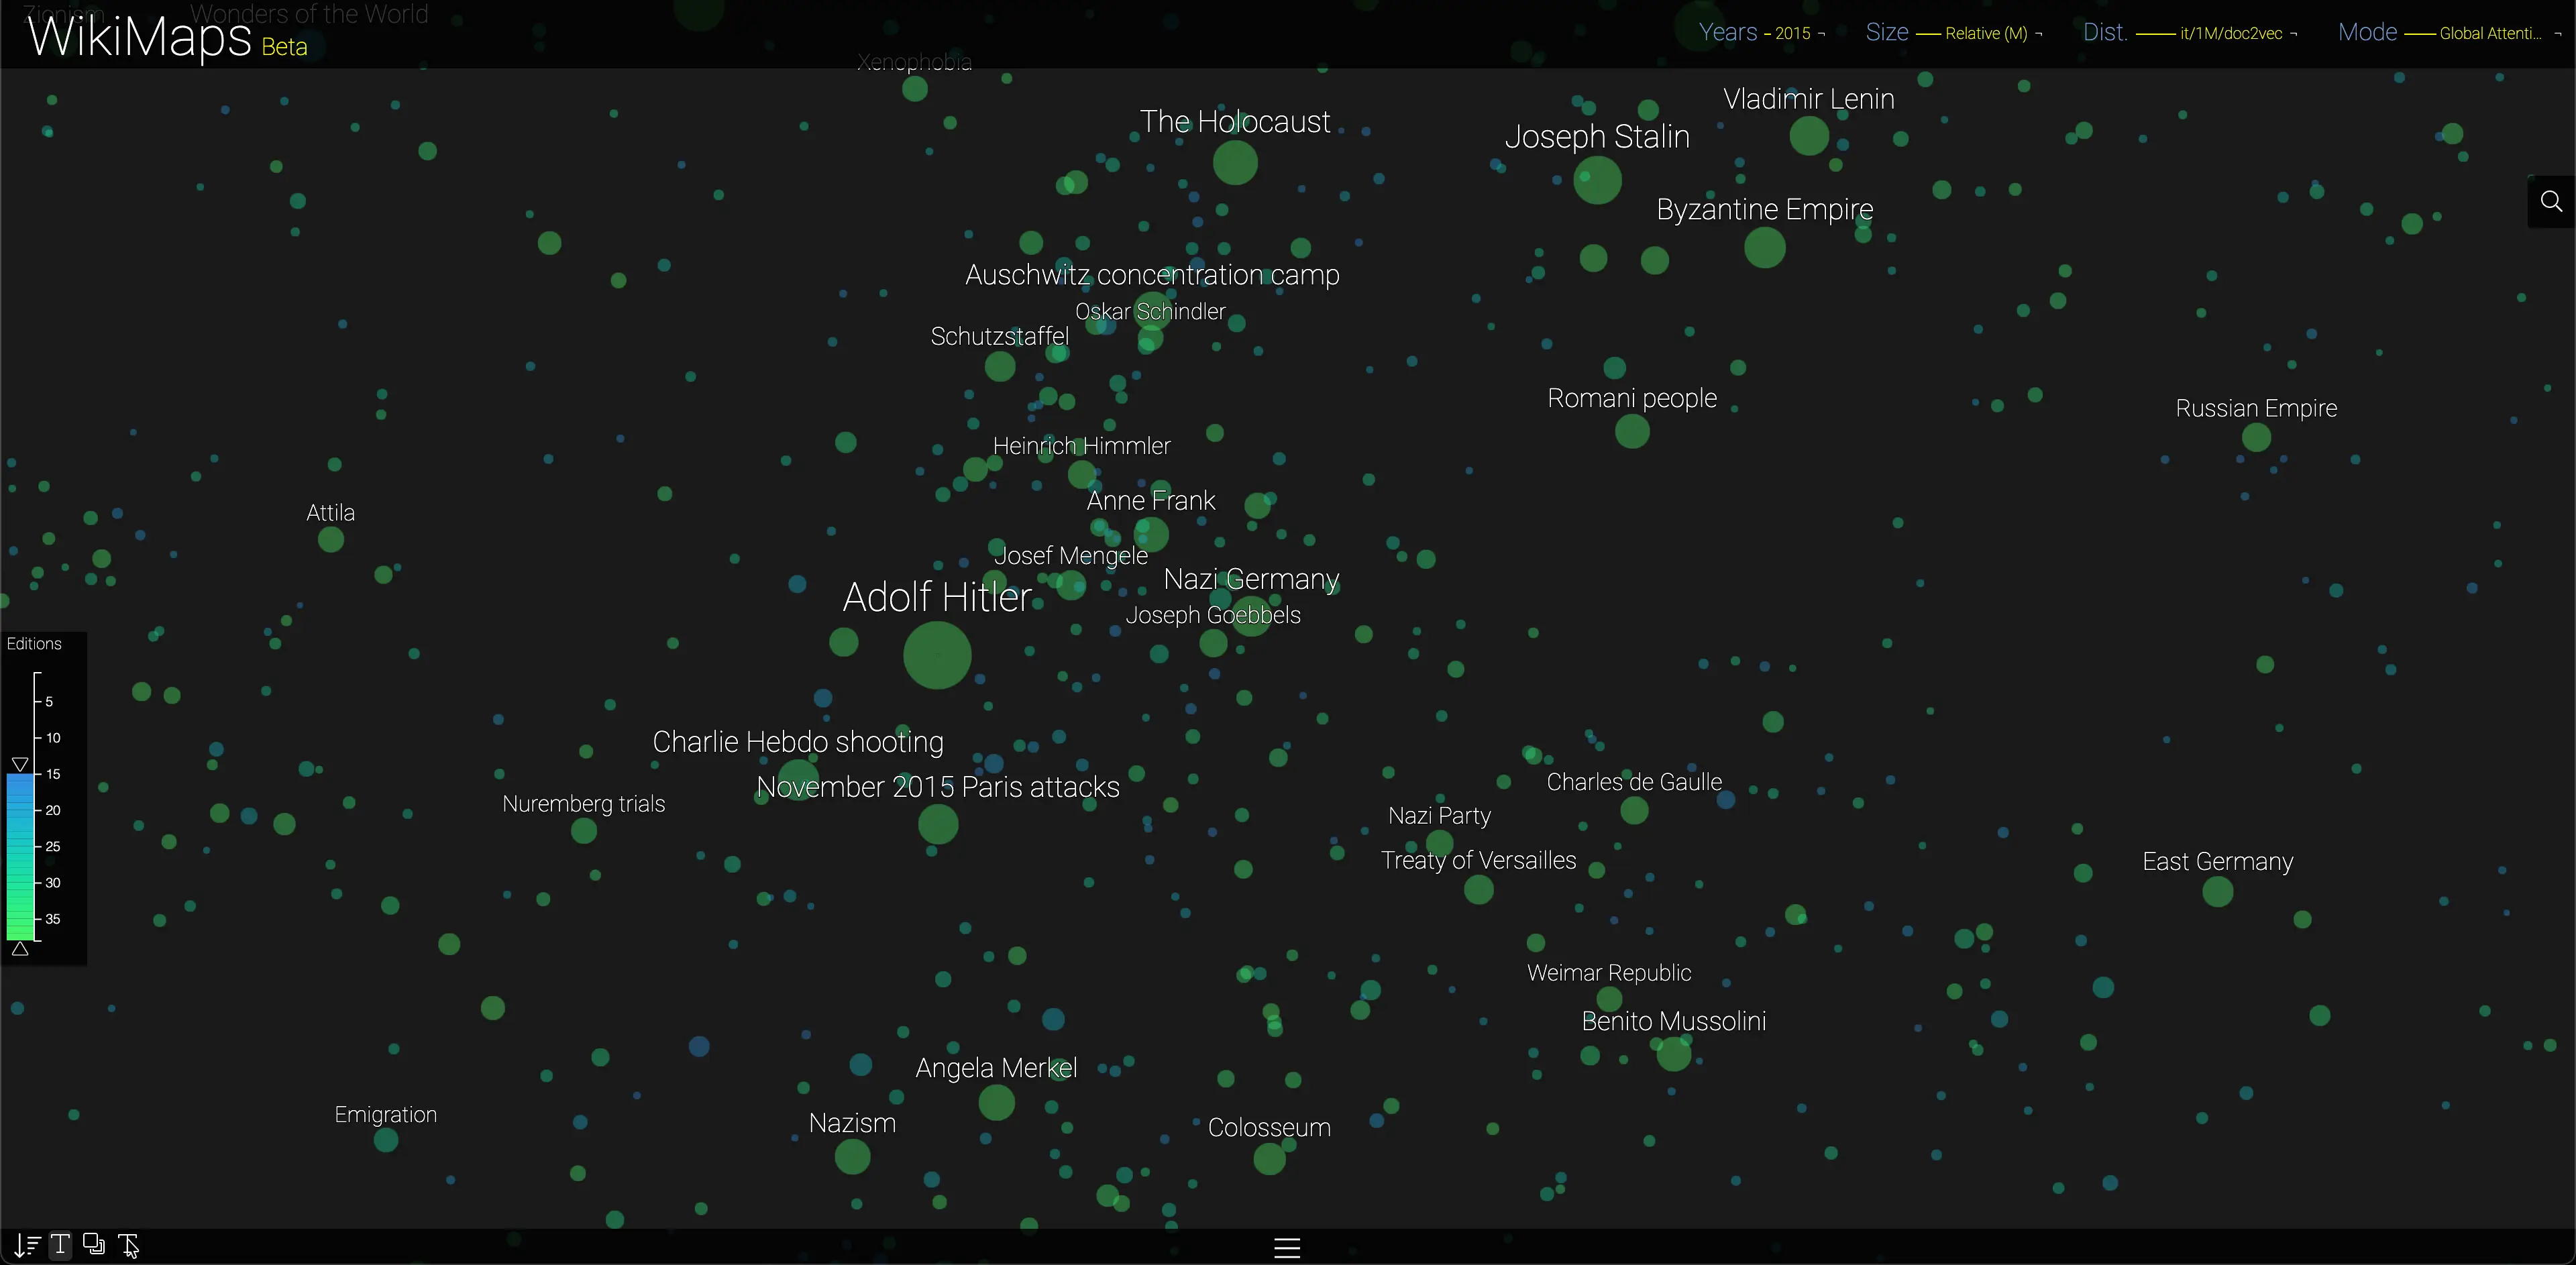
Legend
The WikiMaps legend adapts to all scales. We use a variable size to represent pages, in order to adapt the representation to the requirements of global and local views. This legend also shows the distribution of attention between pages.
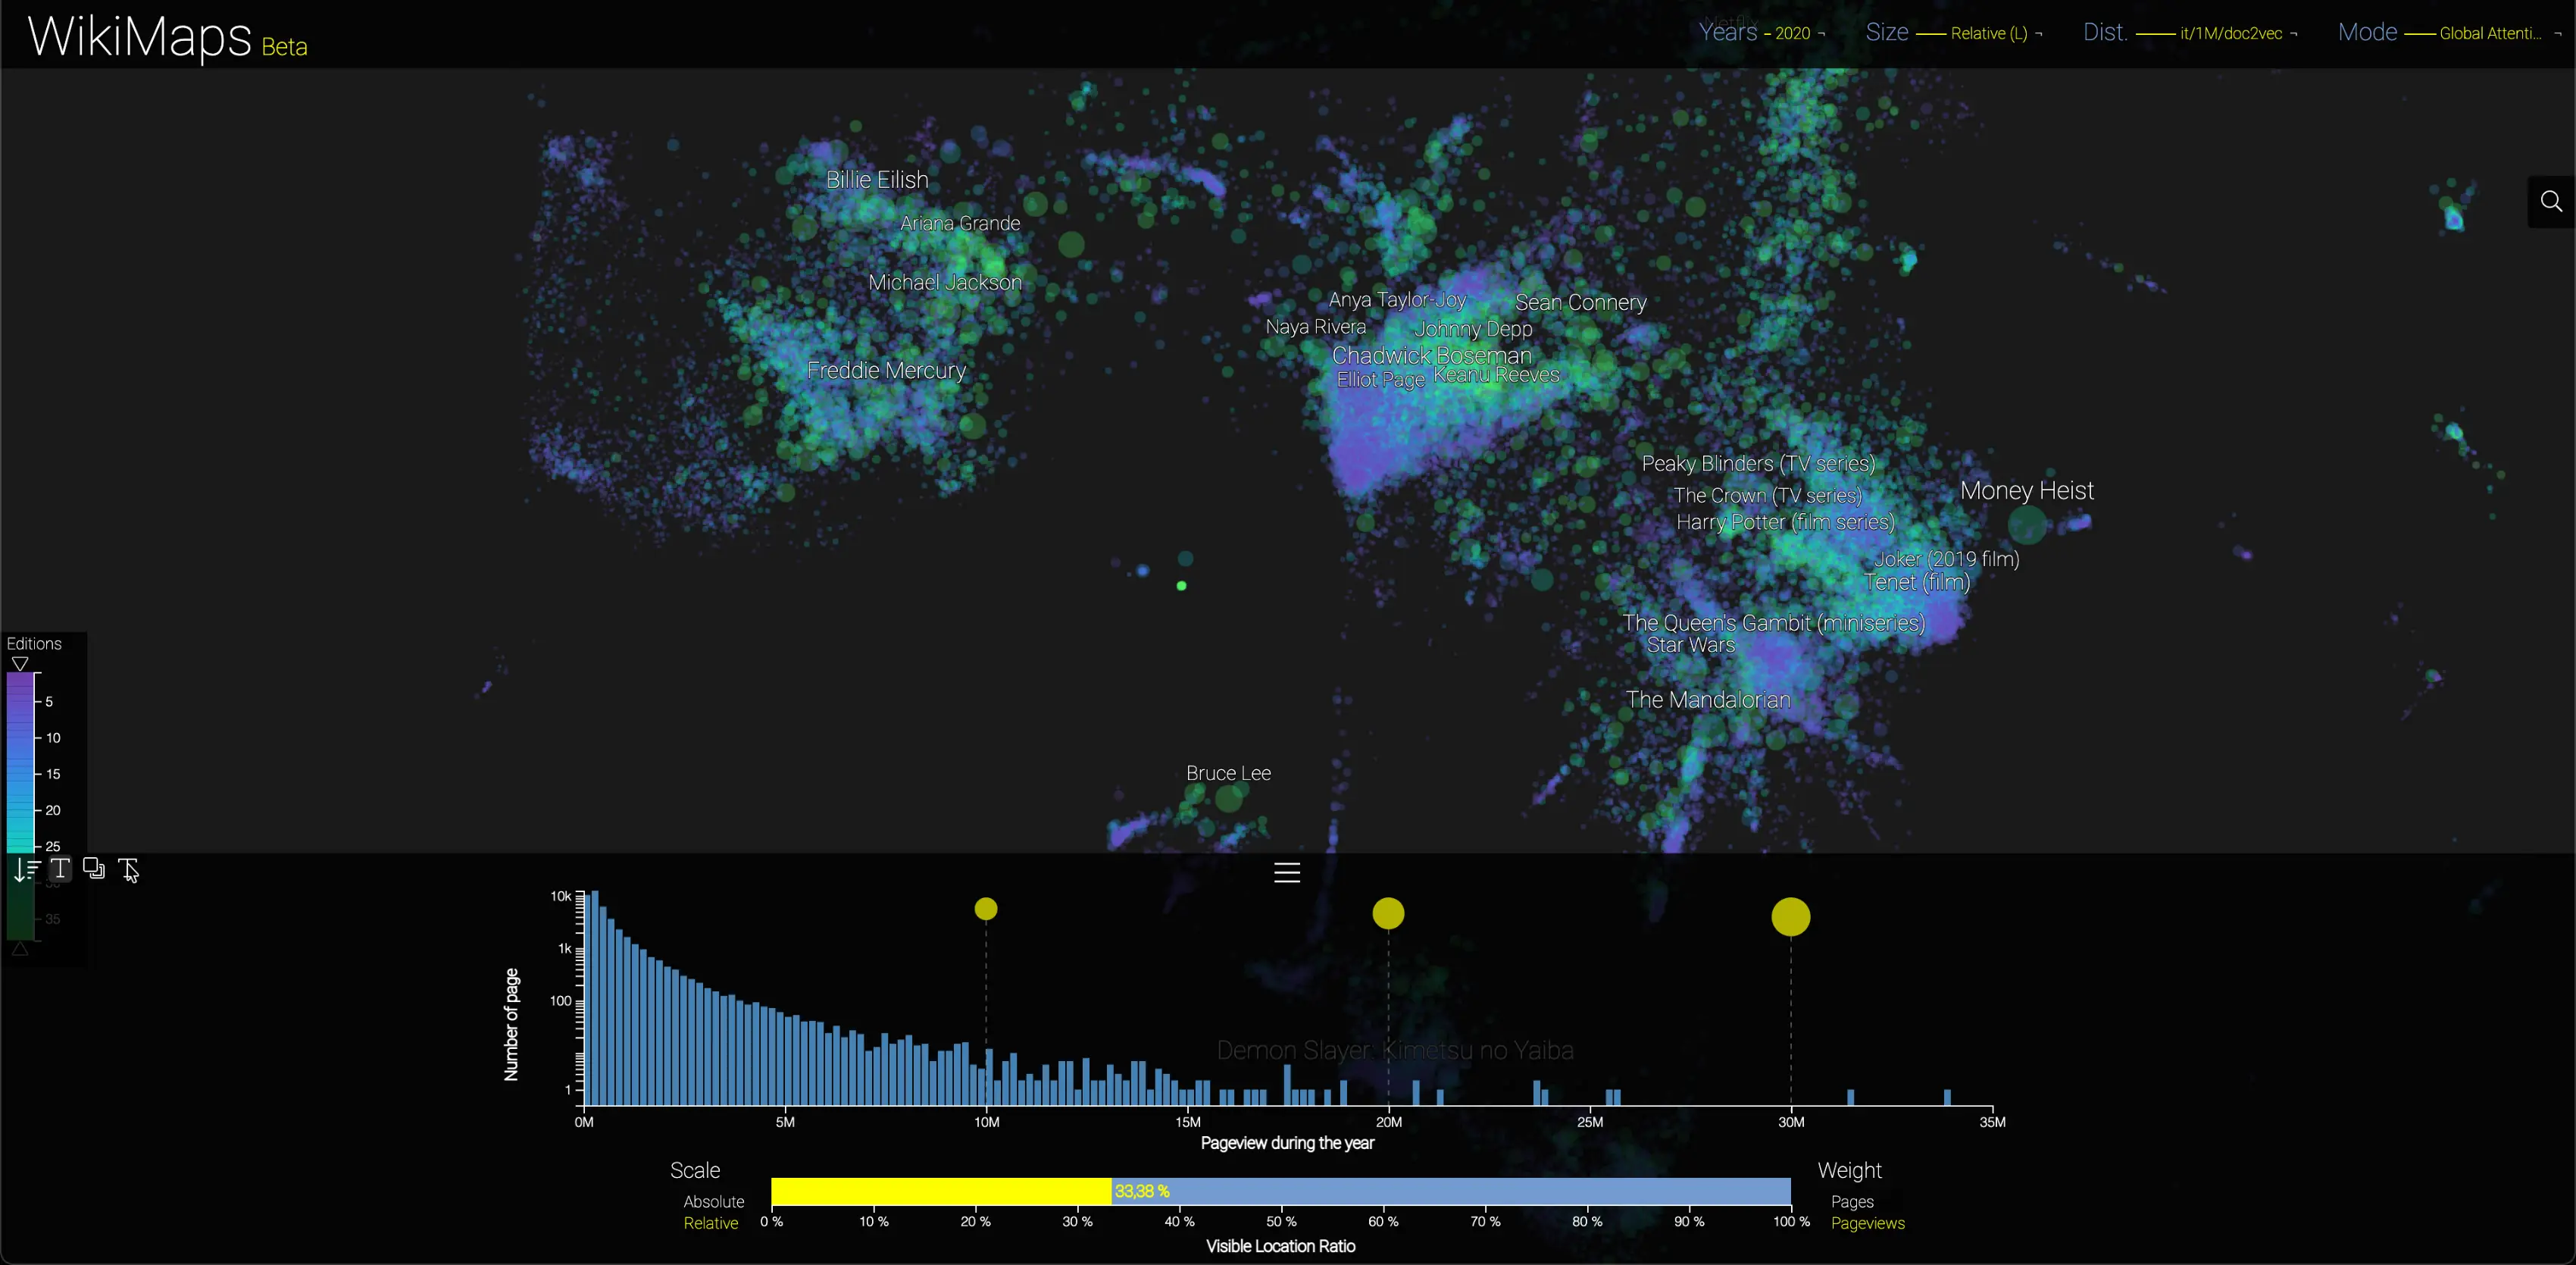
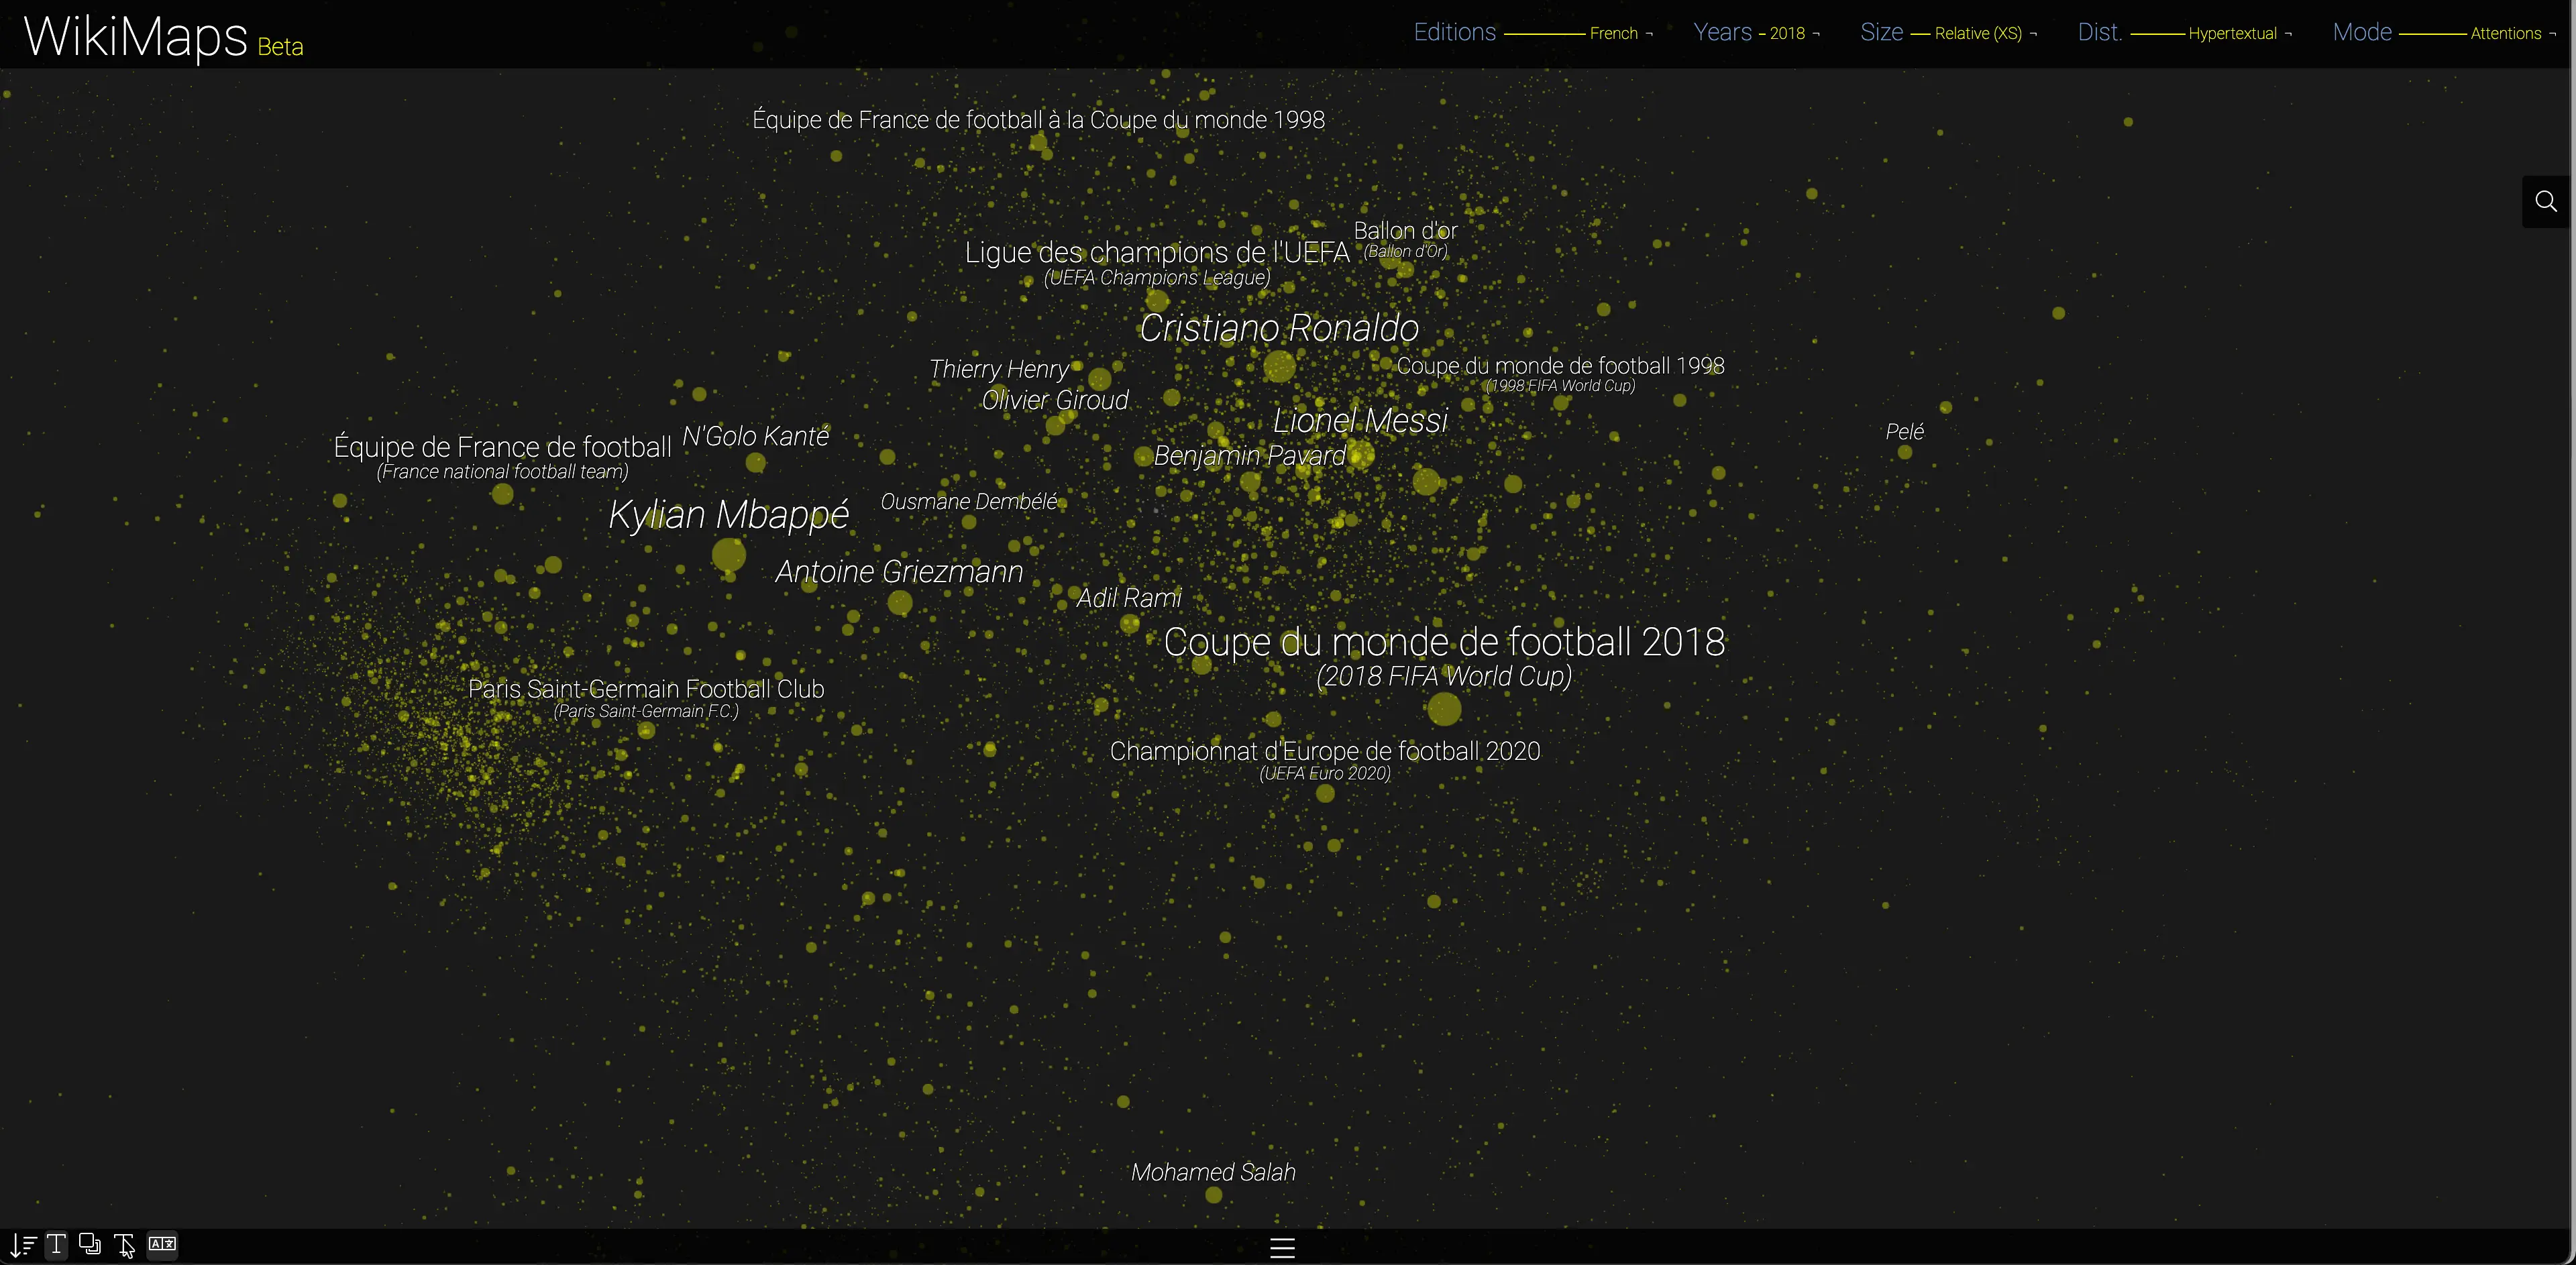
This legend also gives a sense of the absolute or relative importance (quantity or %) of the portion of pages displayed. This importance can be considered for the pages or for their pageviews. It is thus easy to observe that the pages related to audiovisual content (films, series and music) account for slightly more than 30% of global attention in the 38 language editions, and more than 35% for the English edition. Football alone accounts for nearly 7% of the overall attention of the French edition in 2018.
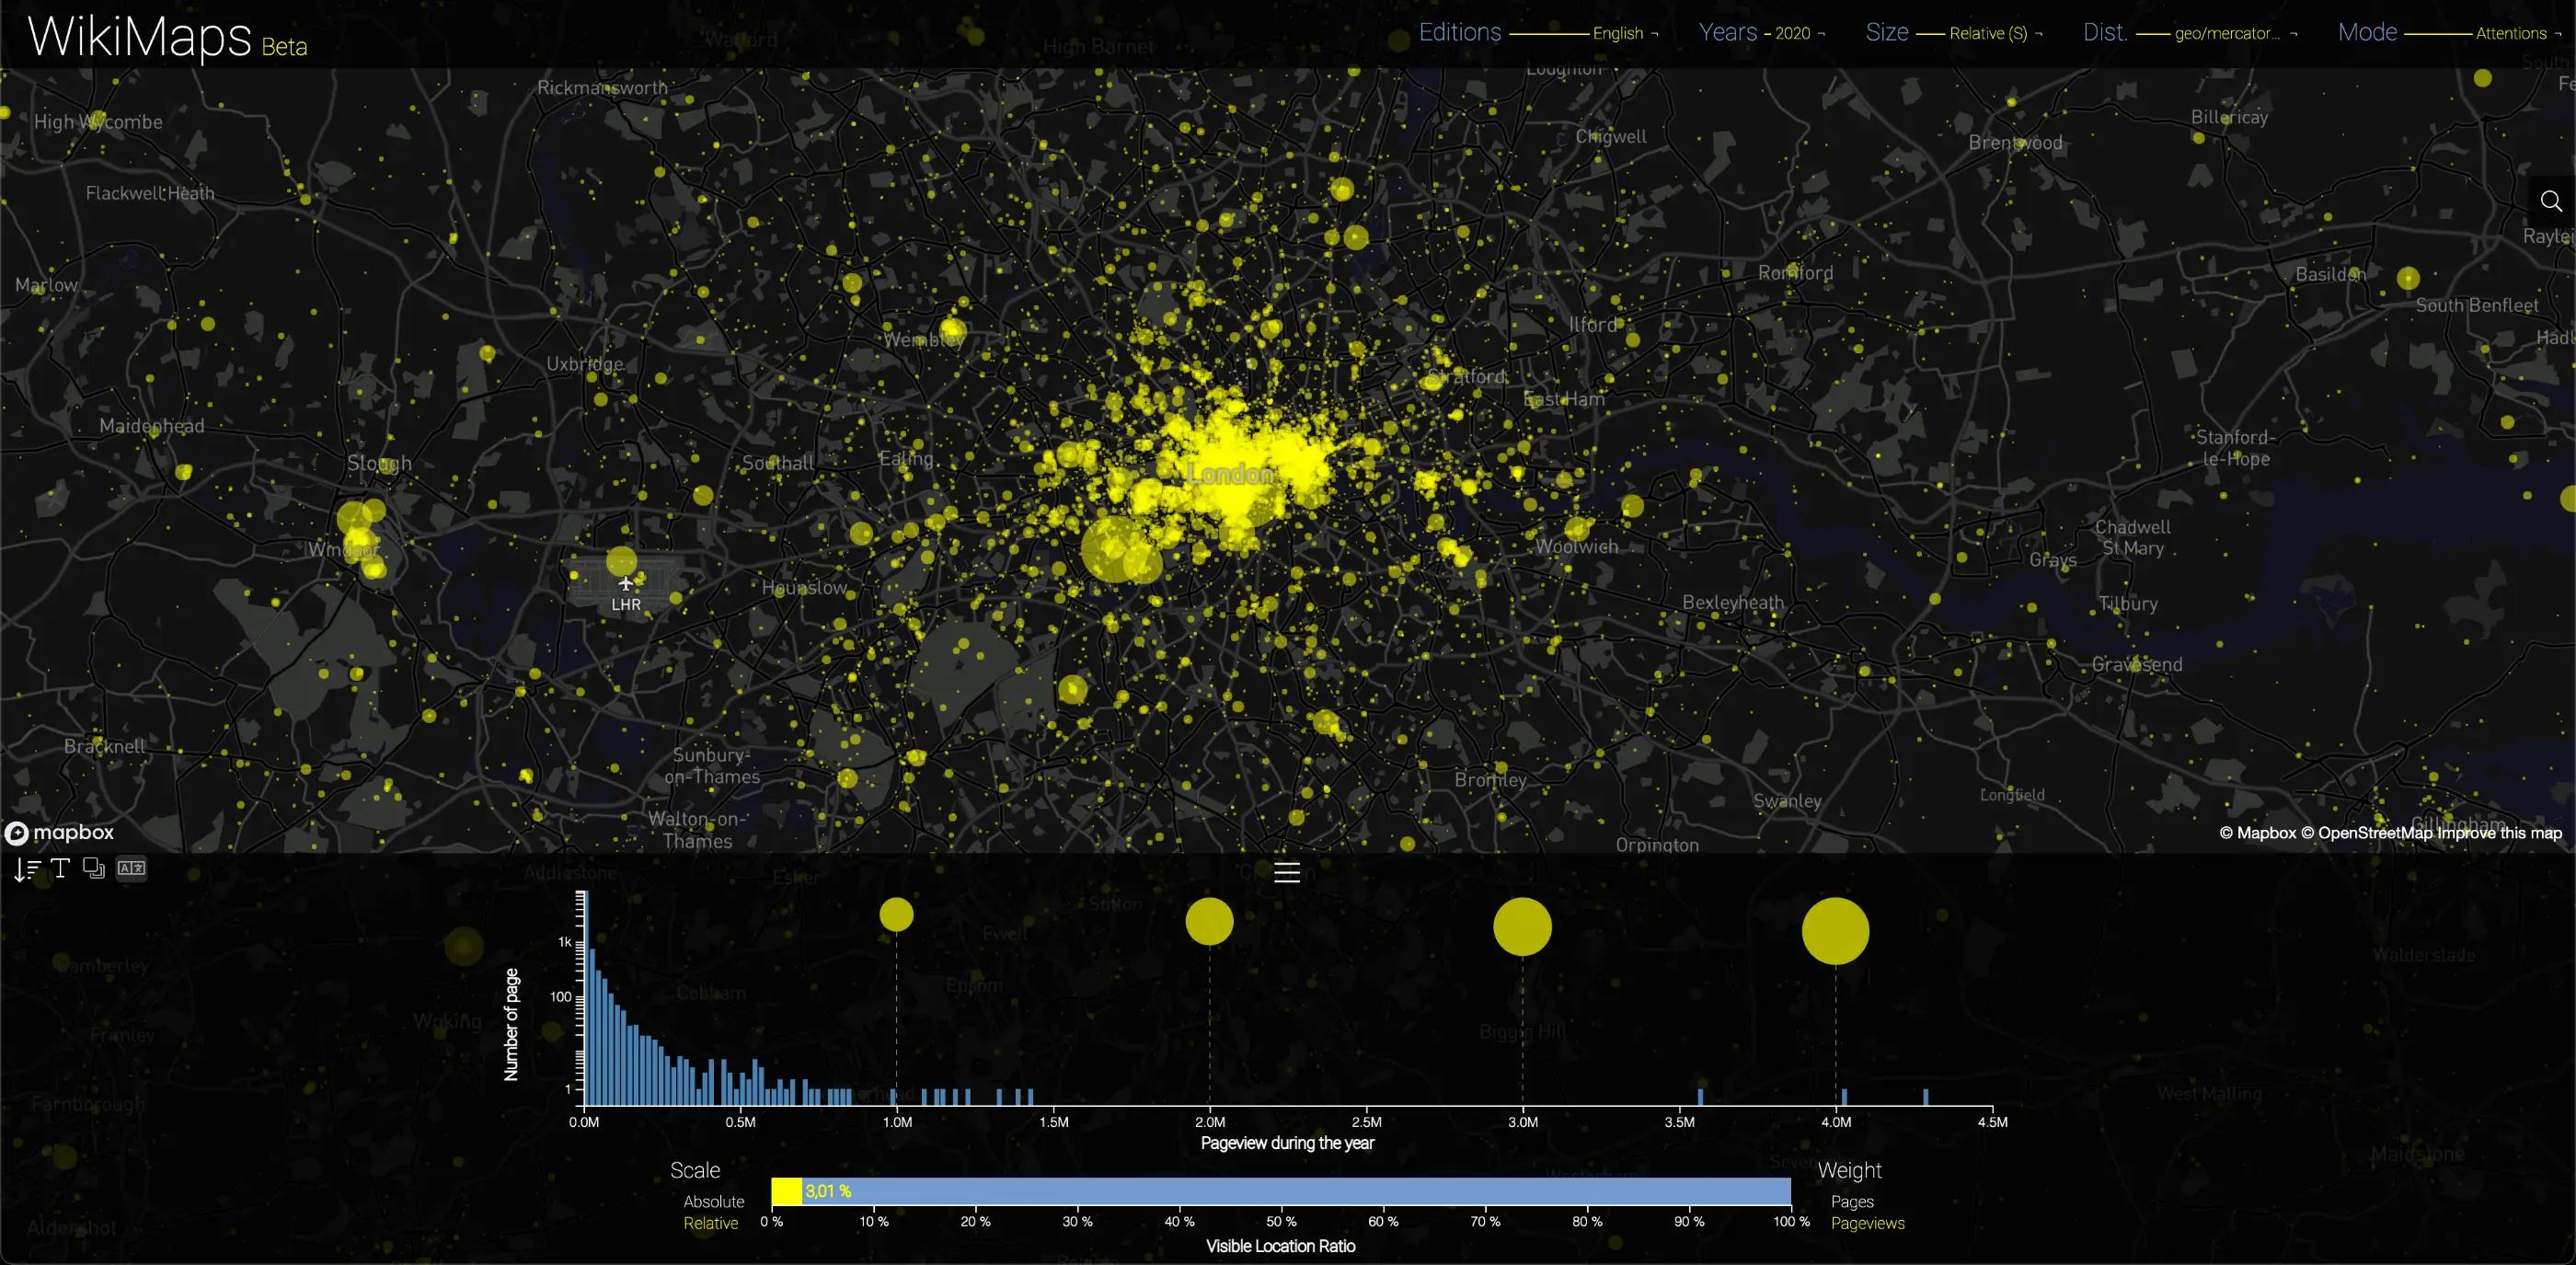
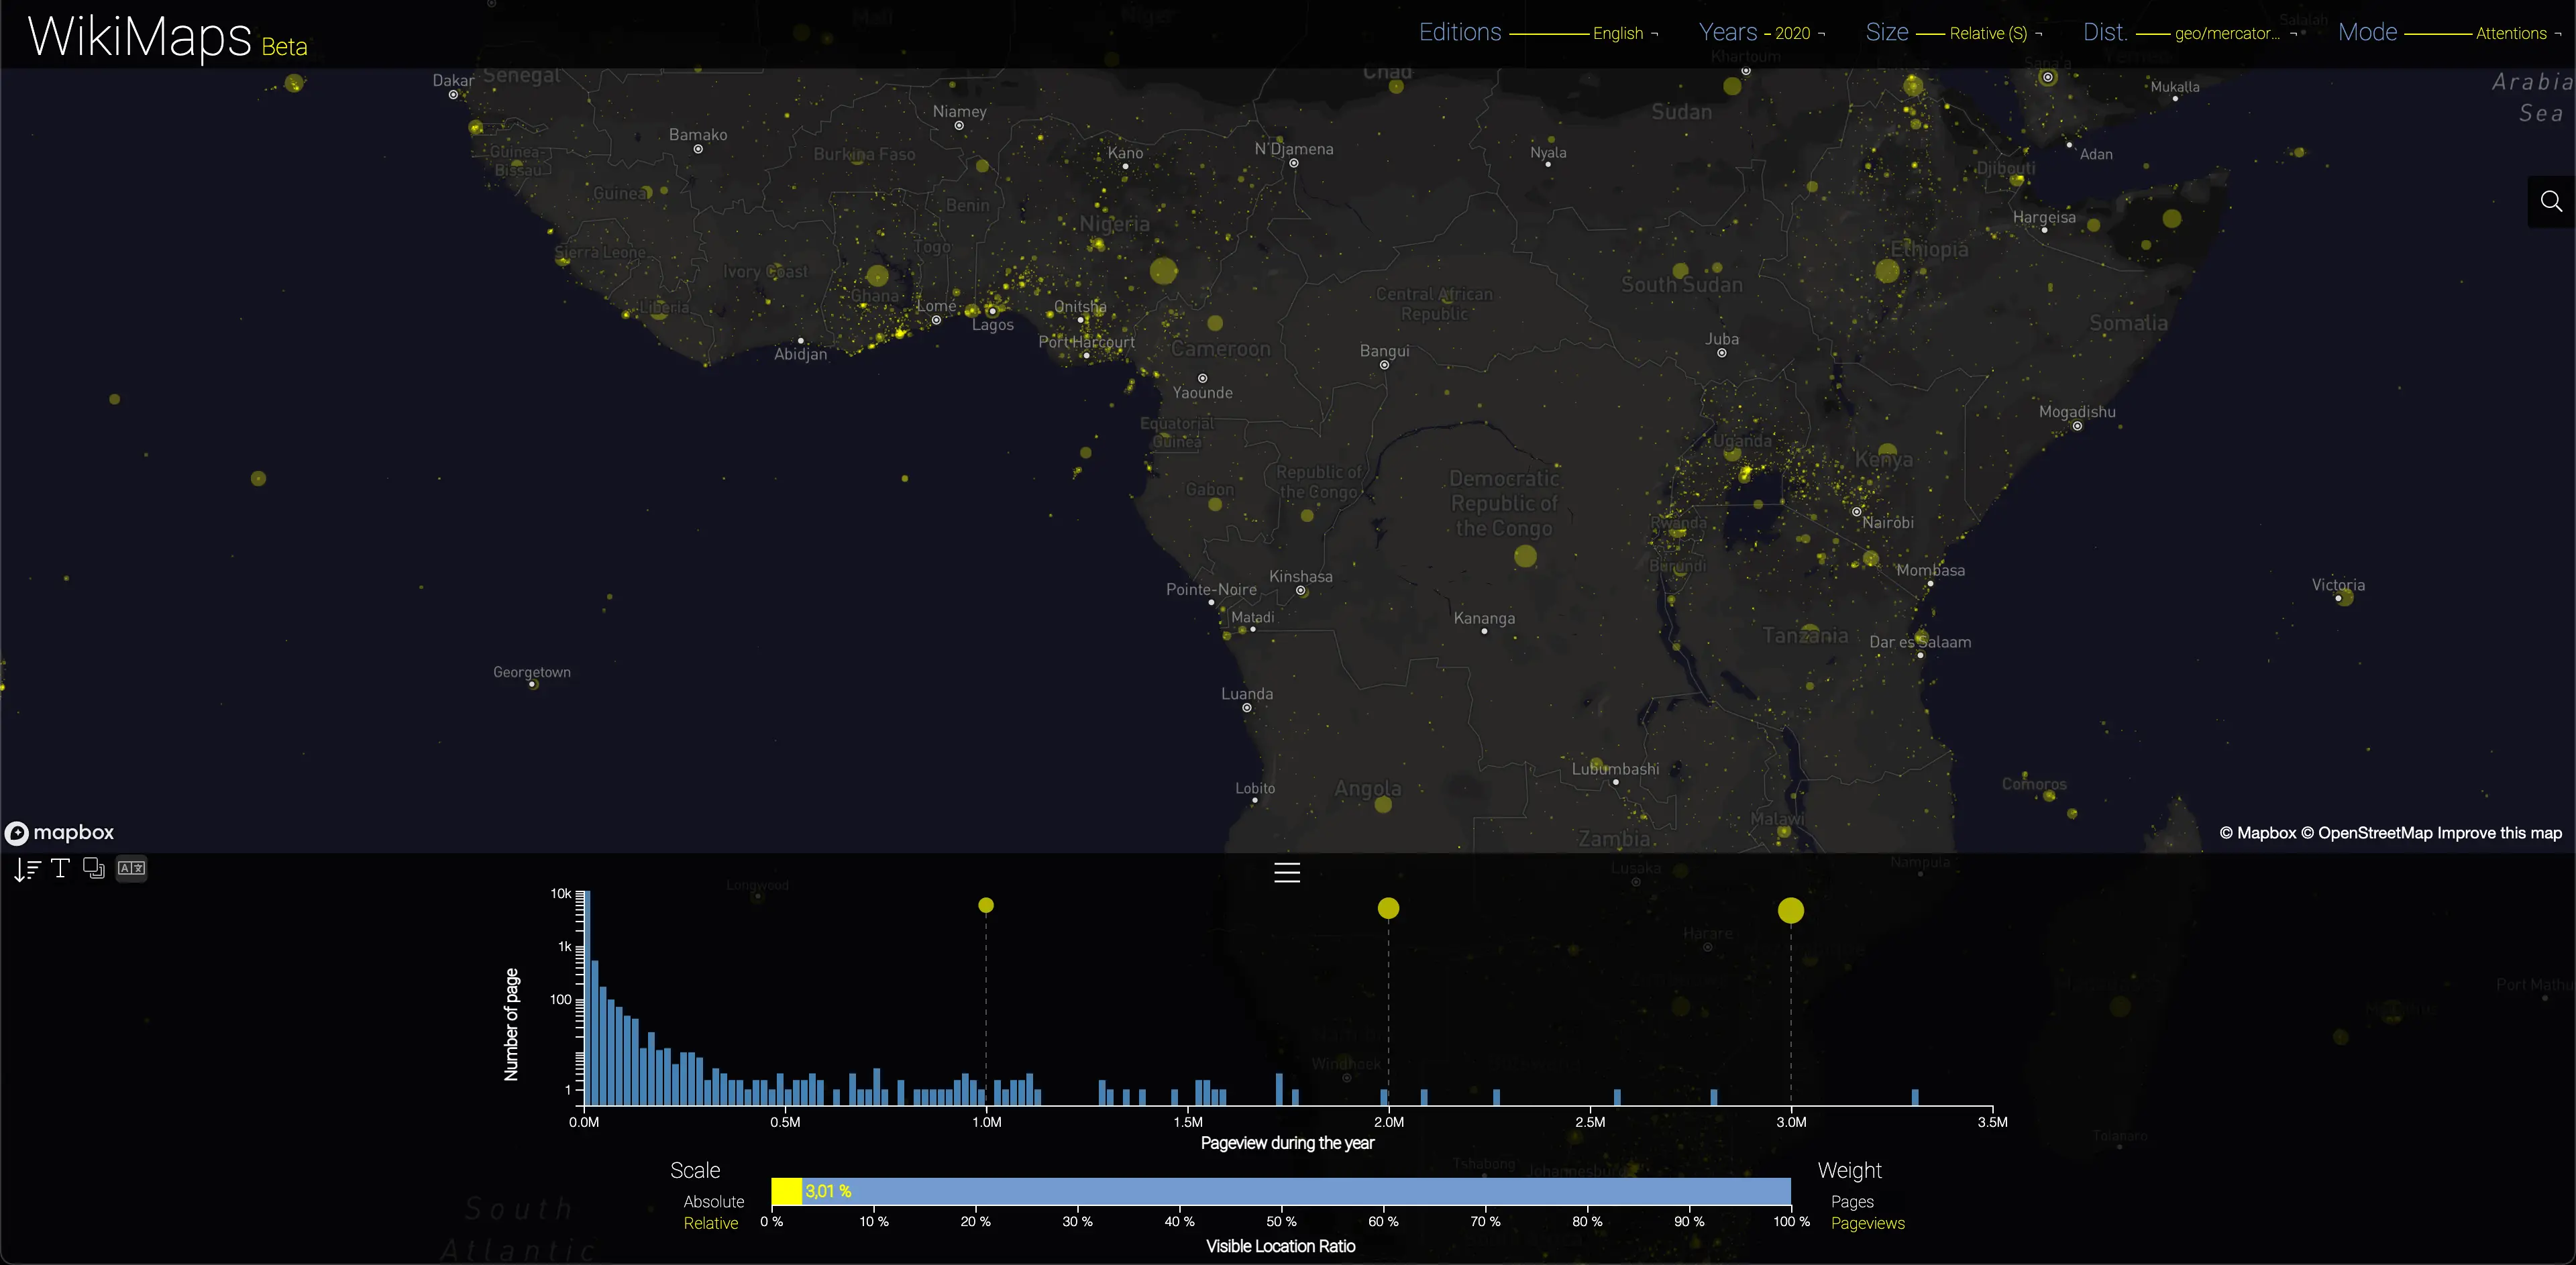
Comparing local attention between Greater London and sub-Saharan Africa north of South Africa, the relative interest in completely incomparable populations and spaces is striking. These two spaces indeed receive roughly the same attention, nearly 3% of pageviews.
Update 2016–2025 version
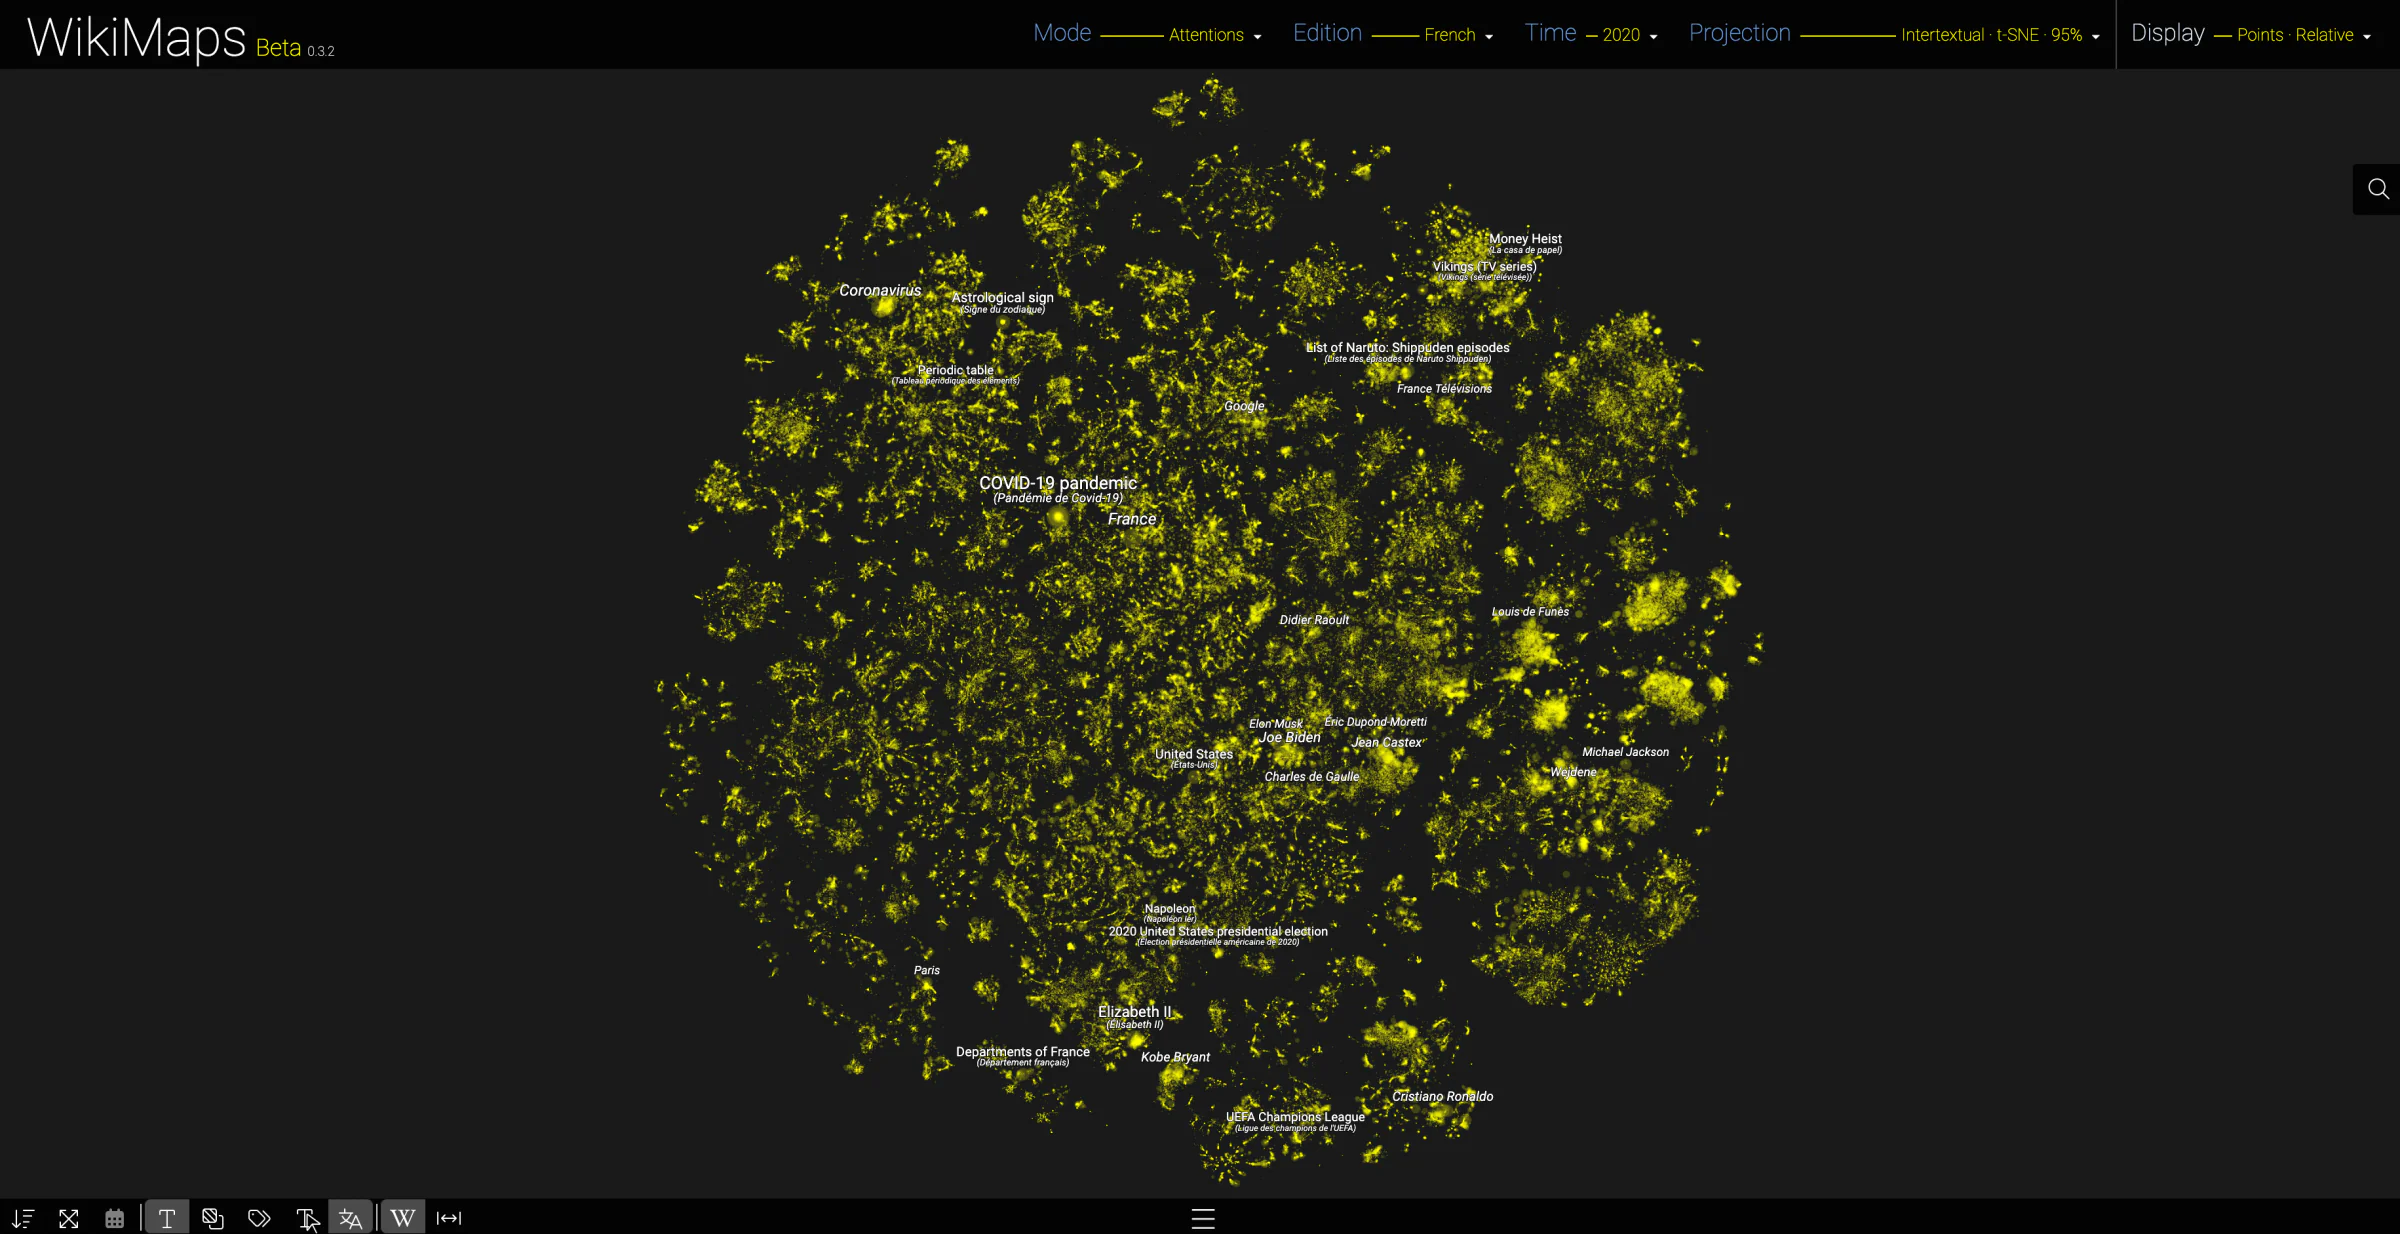
WikiMaps has been thoroughly renewed. The new version (Beta 0.3.2) relies on updated data, more sophisticated methods and a richer interface. It covers a shorter but more recent period, from 2016 to 2025. The previous sections present the former version (2008-2020): their principles remain valid, but their figures, their screenshots and some of their methods are dated.
Data
WikiMaps now covers ten years of daily pageviews, from 2016 to 2025. We decided to start in 2016 because earlier data are not reliable, as communicated by the Wikimedia Foundation, which created a new archive format. The date range is therefore shorter than in the previous version, but it is up to date.
- 40 language editions, out of the 347 editions of Wikipedia, which account for 99% of pageviews;
- about 20 million pages, obtained via Wikimedia Enterprise (WikiMaps is the first academic team to access it);
- about 85 billion data points: the daily pageviews of each page, over 10 years and in the 40 editions, not counting texts, hyperlinks, interlanguage links and geolocation metadata from Wikipedia and Wikidata;
- about 100 million detected events, 3 million qualified events, 400,000 cyclic events, 9,000 global events and 800 global cycles.
The 40 editions selected are: Arabic, Azerbaijani, Bangla, Bulgarian, Catalan, Chinese, Croatian, Czech, Danish, Dutch, English, Finnish, French, German, Greek, Hebrew, Hindi, Hungarian, Indonesian, Italian, Japanese, Kazakh, Korean, Lithuanian, Malay, Norwegian, Persian, Polish, Portuguese, Romanian, Russian, Serbian, Simple English, Slovak, Spanish, Swedish, Thai, Turkish, Ukrainian, Vietnamese. Compared with the previous version, Azerbaijani, Bangla and Kazakh have been added, and Slovene removed.
Methods
The processing pipeline has been entirely rebuilt, largely on the computing infrastructure of the University of Lausanne (CPU and GPU), complemented by APIs and cloud services:
- page summaries (transformers);
- large-scale extraction of Wikipedia and Wikidata metadata;
- page embeddings (transformers);
- Parquet database, queried with DuckDB;
- dimensionality reduction (t-SNE, UMAP, PaCMAP…);
- clustering (Louvain, Leiden, HDBSCAN…);
- time series analysis (signal processing), to detect events;
- qualification and validation of events by LLMs (transformers);
- web search and Wikidata queries (APIs).
Spatialisations
Geographical
Pages are still positioned by their coordinates, taken from Wikipedia or Wikidata. Wikidata coordinates make it possible to position more pages, because the coordinates entered with the local templates of some editions are often not recorded in Wikipedia's database. The Mollweide (global scale) and Mercator (local scale, over a Mapbox base map) projections are retained.
Intertextual
The intertextual spatialisation no longer relies on word2vec and doc2vec. The text of each page is now turned into a vector by a transformer-based embedding model, edition by edition, which better takes into account the meaning of pages, and no longer only the words they contain. These vectors are then projected into two dimensions with t-SNE or UMAP: pages with similar content are neighbours, whatever their location.
Hypertextual
The links written by contributors in the text of the articles form a network, from which the links of navigation boxes, infoboxes and templates are excluded. A graph embedding method (ProNE) assigns each page a vector according to its position in this network, before the same dimensionality reduction (t-SNE or UMAP). Pages that link to each other, or to the same pages, are neighbours. Pages without any link to another page of the map are not displayed.
Page sets
The intertextual and hypertextual projections are available for two page sets, which replace the 100,000 and 1 million pages of the previous version. In each edition, pages are ranked by their cumulative pageviews from 2016 to 2025: the 80% set keeps the most viewed pages that together account for 80% of views (about 3 million pages across the 40 editions), the 95% set those that account for 95% of them (about 10 million pages).
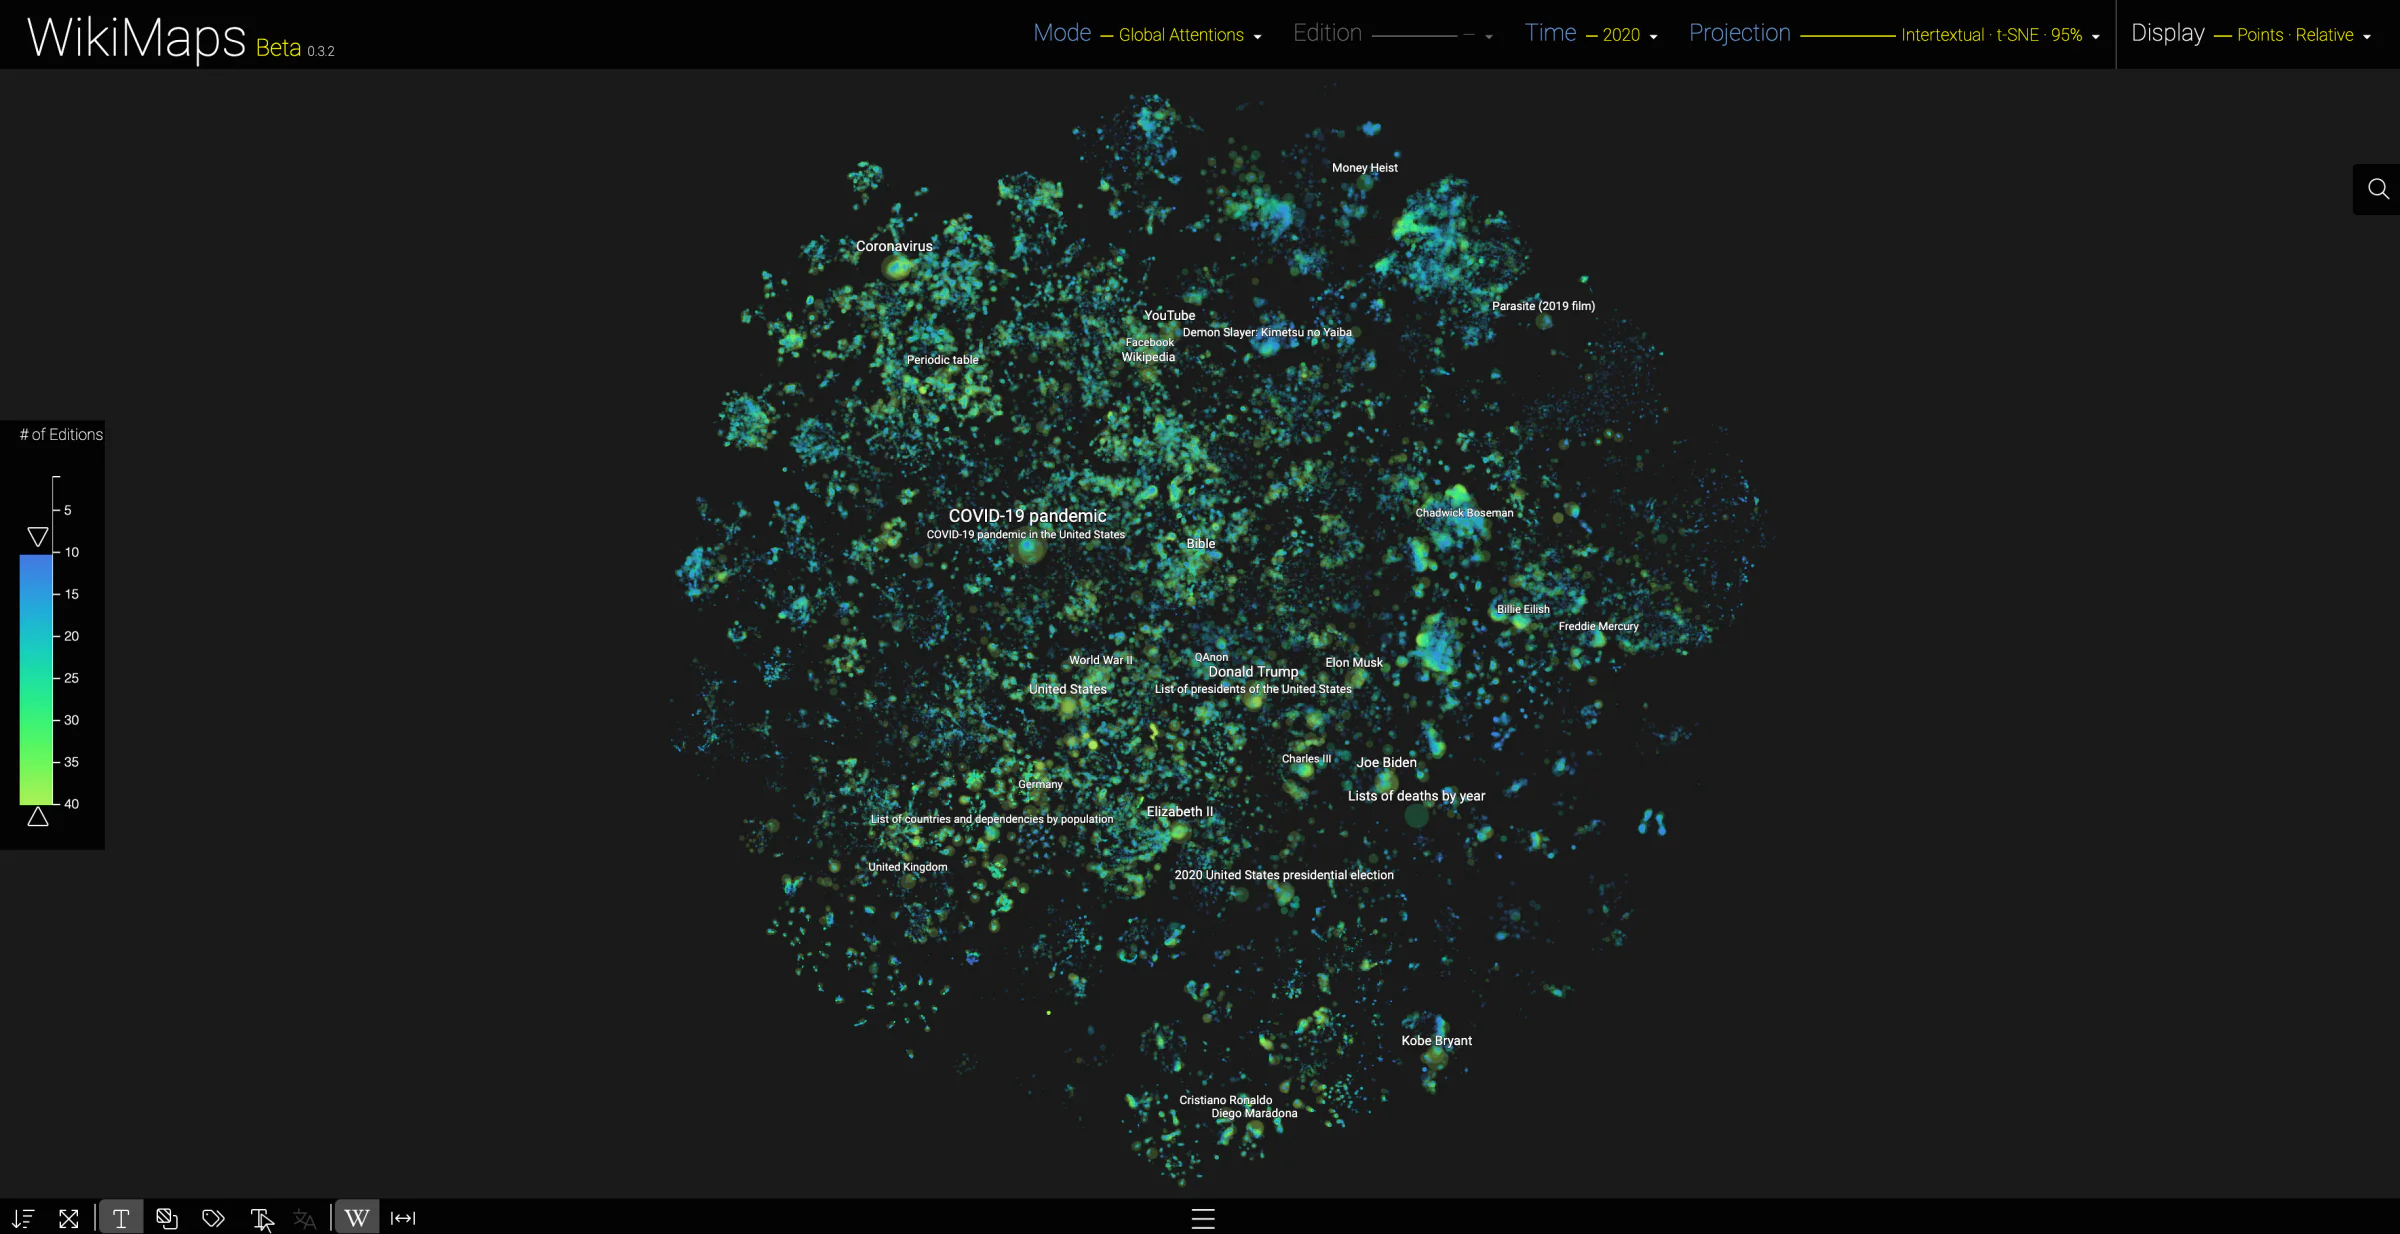
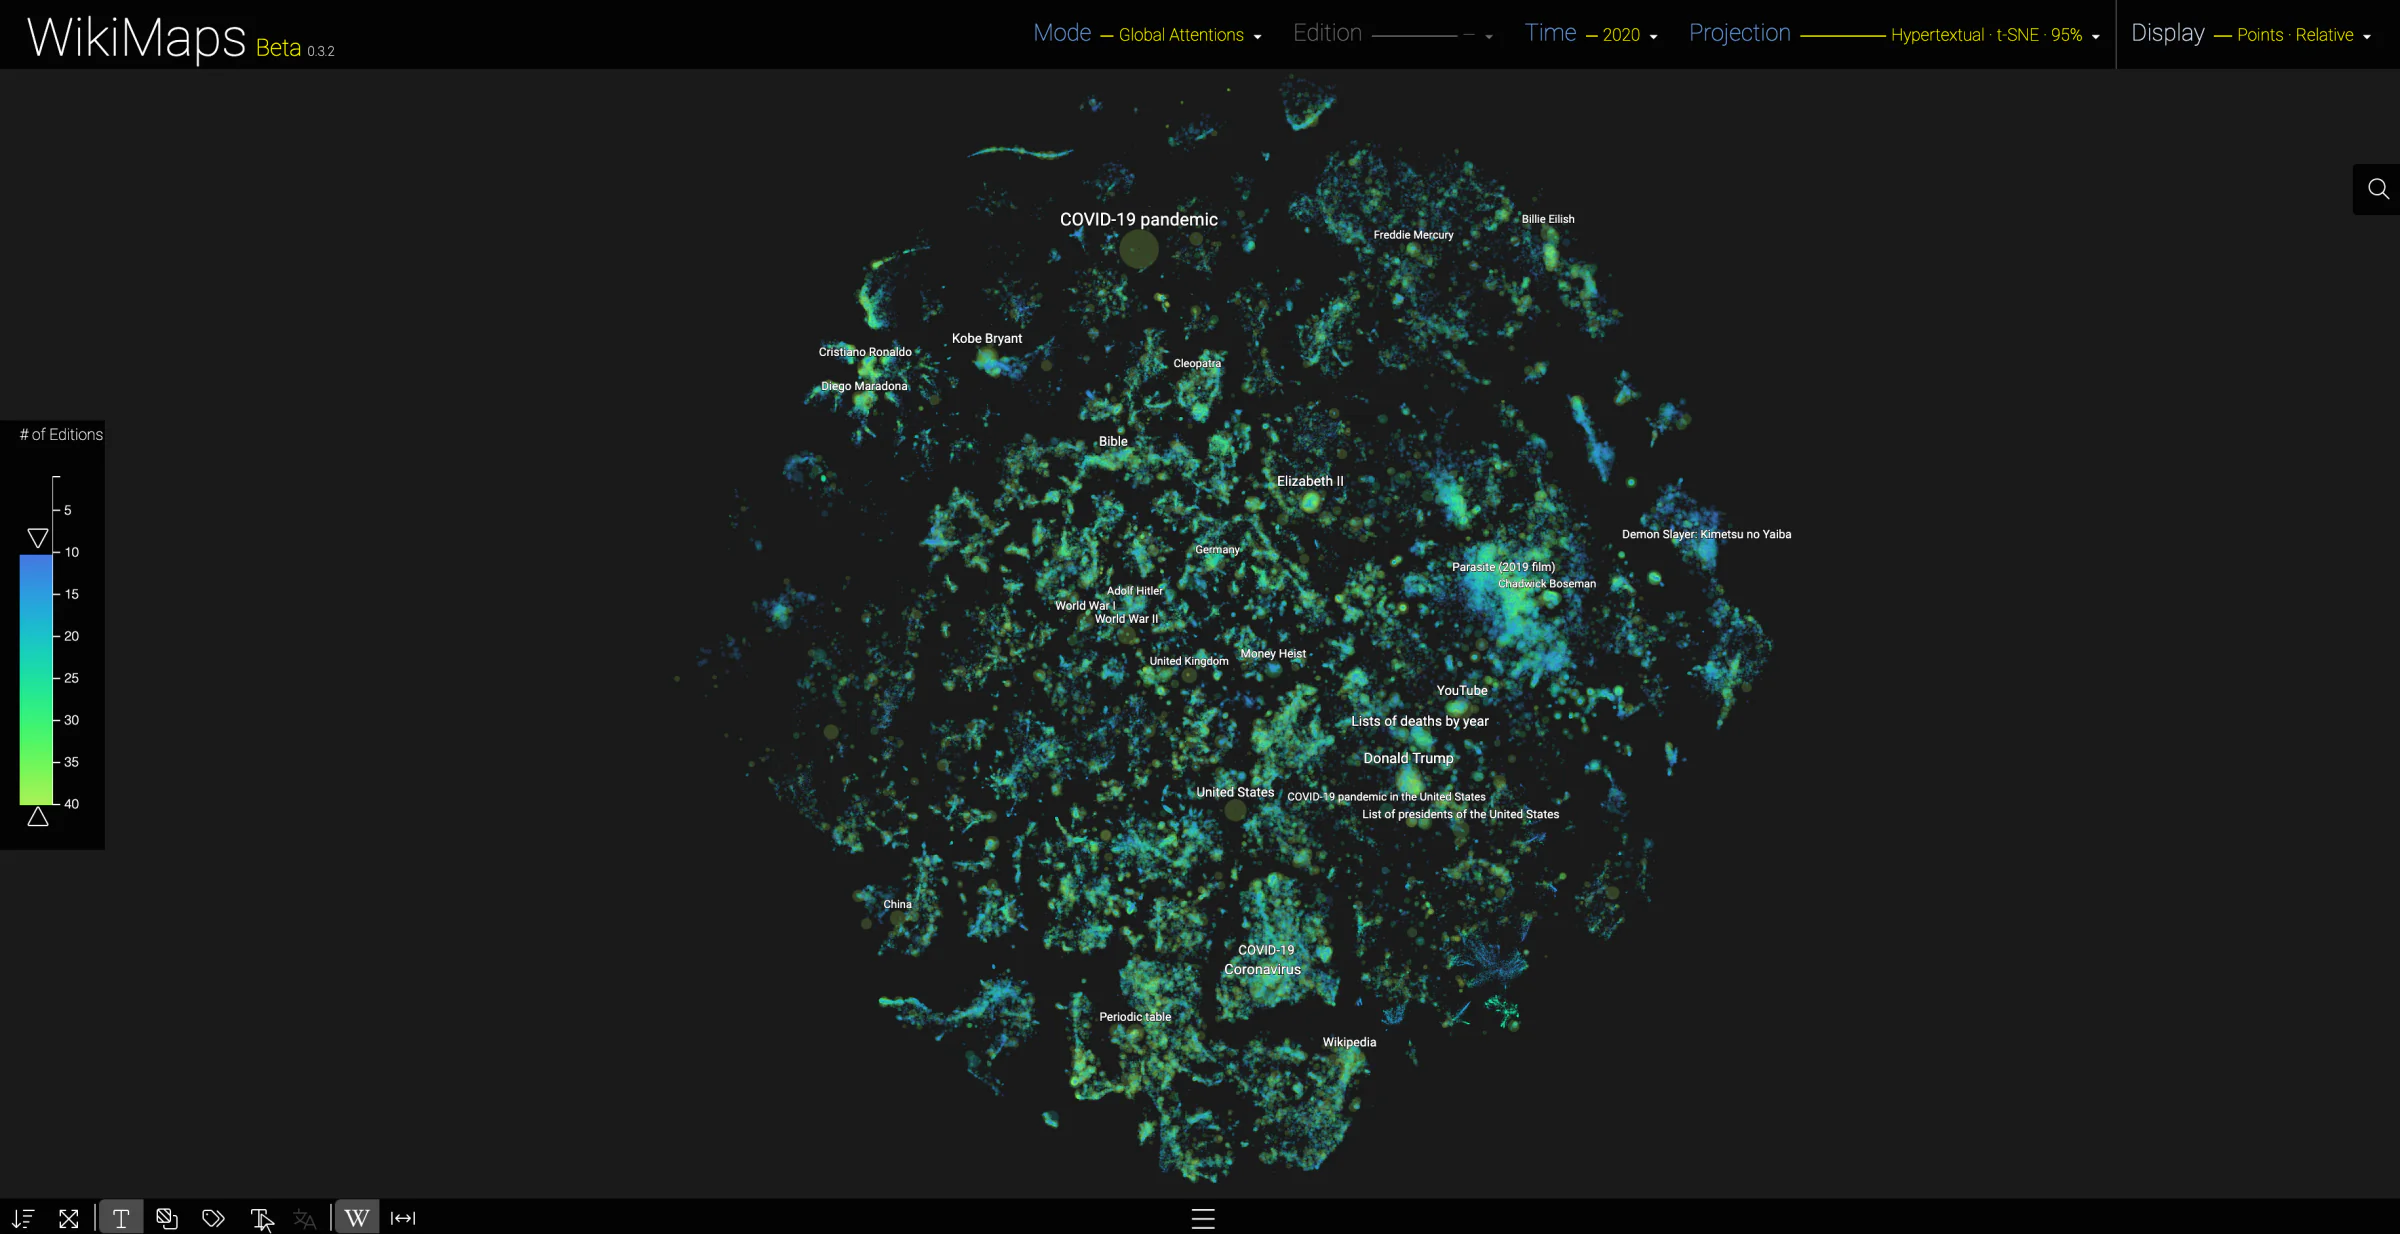
Modes
The modes have been reorganised and extended:
- Pages: locates existing pages, all of the same size. This mode now represents the supply of pages, and no longer their length;
- Page Content (new): sizes pages by the length of their text, regardless of their pageviews, as the Pages mode used to do;
- Attentions: sizes pages by their annual pageviews;
- Events: pages that have been the subject of a sudden peak of attention, coloured by the asymmetry of the peak (skewness), on a scale from 0 to 100;
- Cyclic events: pages whose peaks of attention recur every year. This mode is being reworked to take several calendars into account;
- Global attentions: cumulative pageviews in the 40 editions. The colour shows the globality of pages, that is to say the number of editions that share a peak of attention for a page, and a setting keeps only the pages shared by a minimum number of editions;
- Global events: peaks of attention synchronised across editions.
In the Pages, Page Content and Attentions modes, the 40 editions can also be displayed on a single map (All editions).
Interface
The interface has been entirely redeveloped and offers many new settings:
- Menus: Mode, Edition, Time, Projection and Display open together when hovering over the header; a greyed-out option has no data with the current settings;
- Display: pages are represented by points or by a density grid, on a relative or absolute scale. In the latter case, a full-size point corresponds to 1 million views, 10 million in Global attentions and 500,000 characters in Page Content;
- Titles: in editions other than English, the English title can be displayed alongside the original title;
- Links: it is possible to display the Wikipedia links of a page, or the pages with the closest content;
- Distribution: a panel shows the histogram of pageviews and the share of pages, or of views, visible on screen;
- Dashboard: selecting pages opens a list (by page, date, event or edition), a treemap of the editions, the beginning of the article (original or in English), the daily pageview curve and its breakdown by edition;
- Search: any page can be searched for and located on the map.
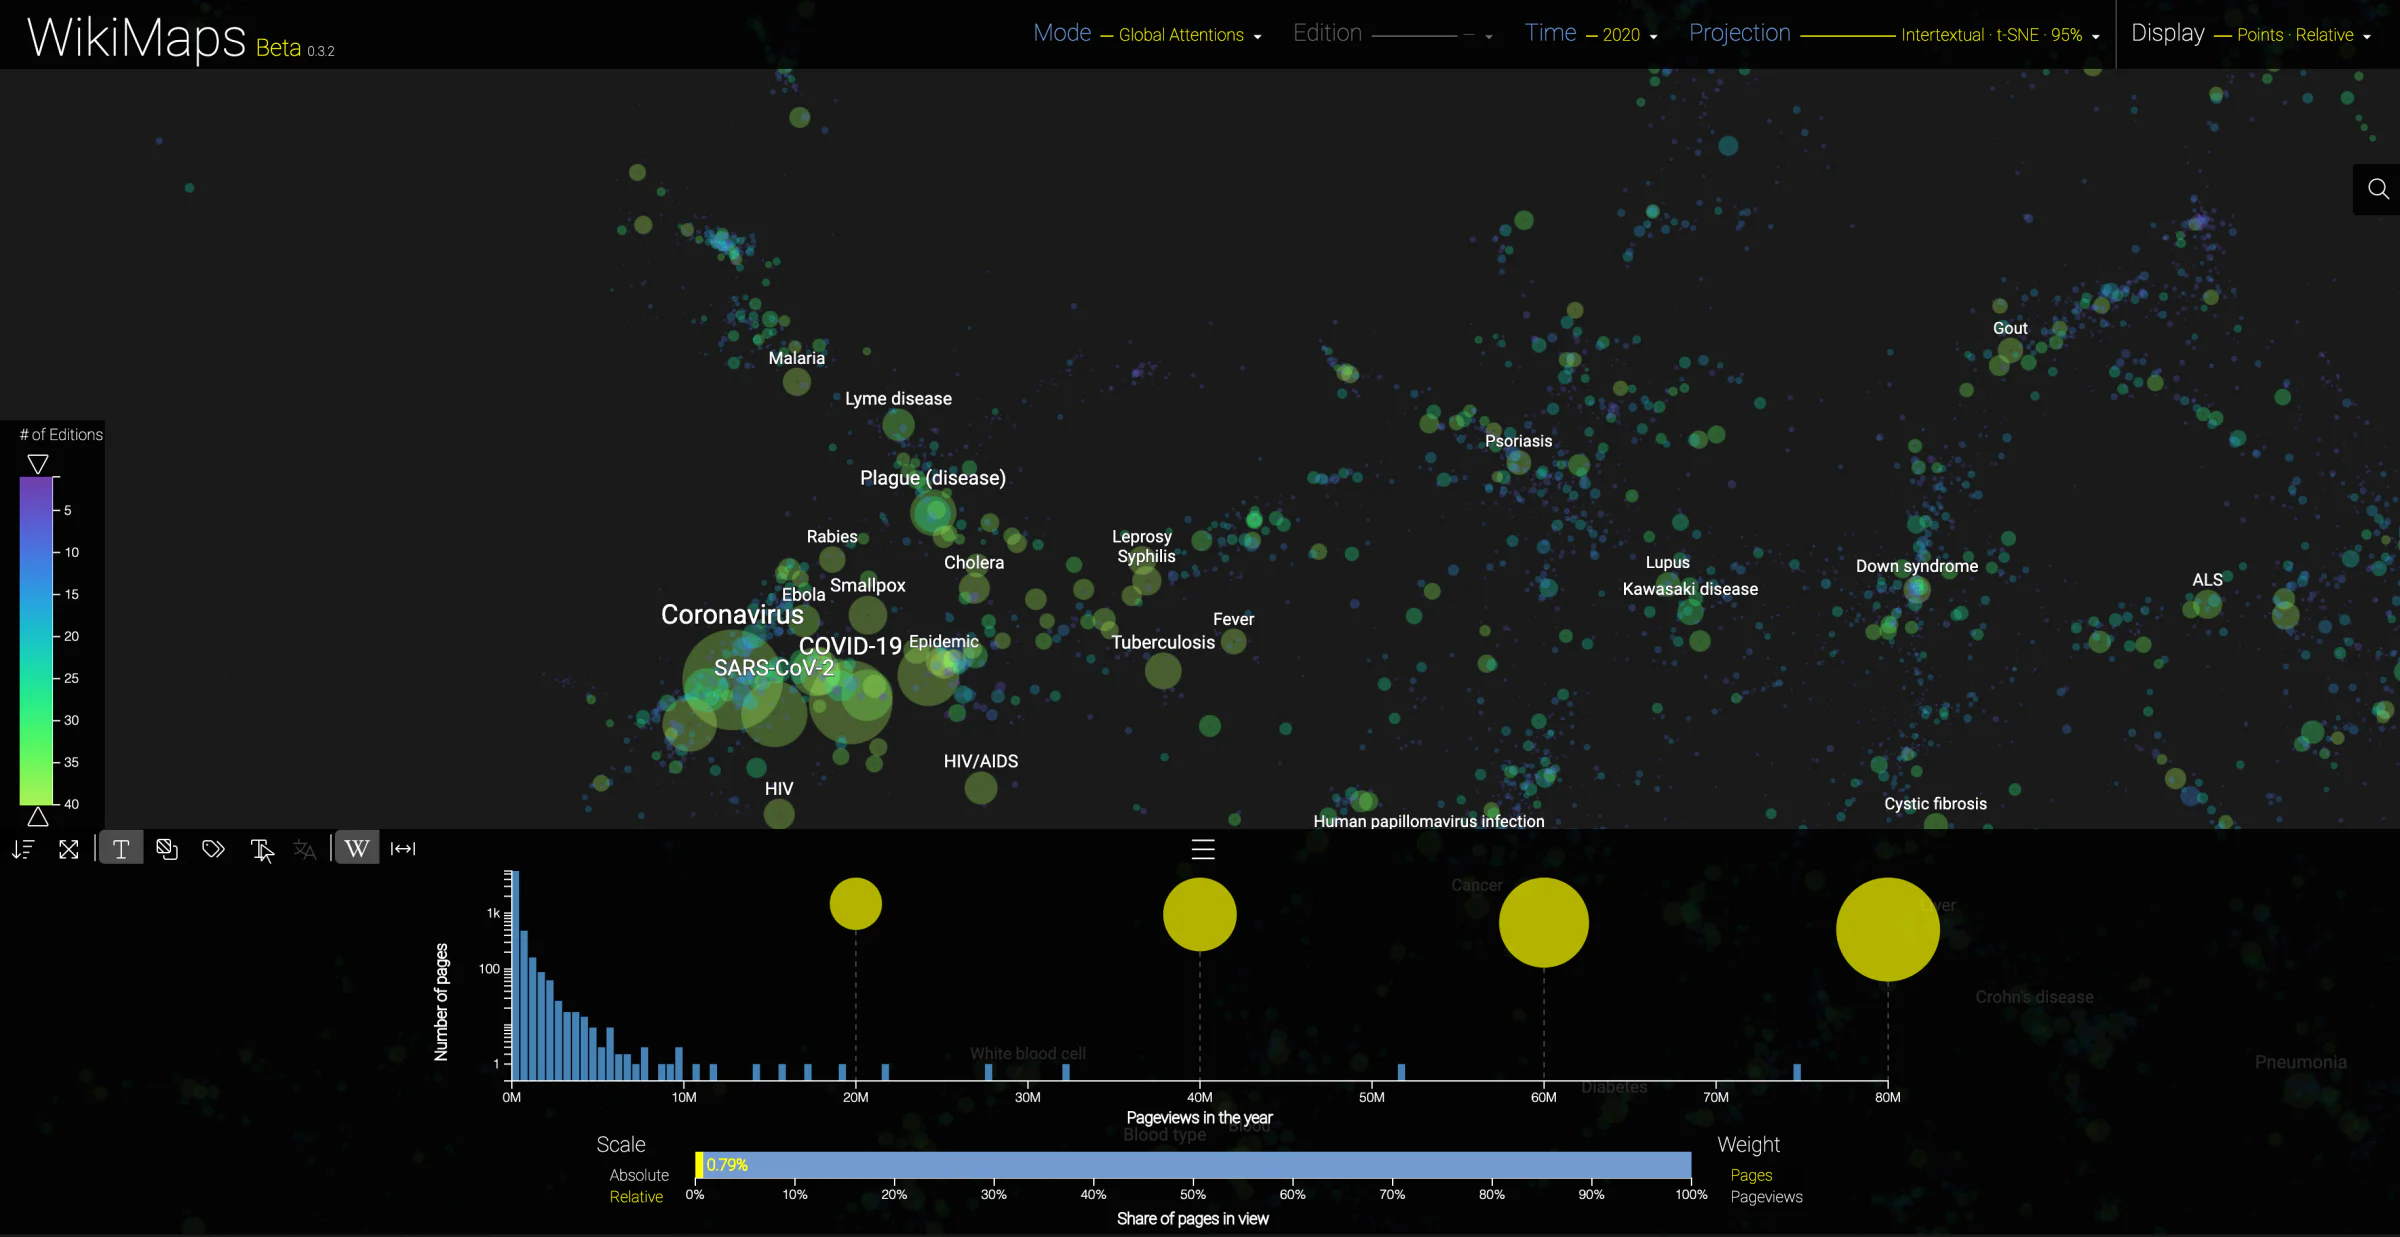
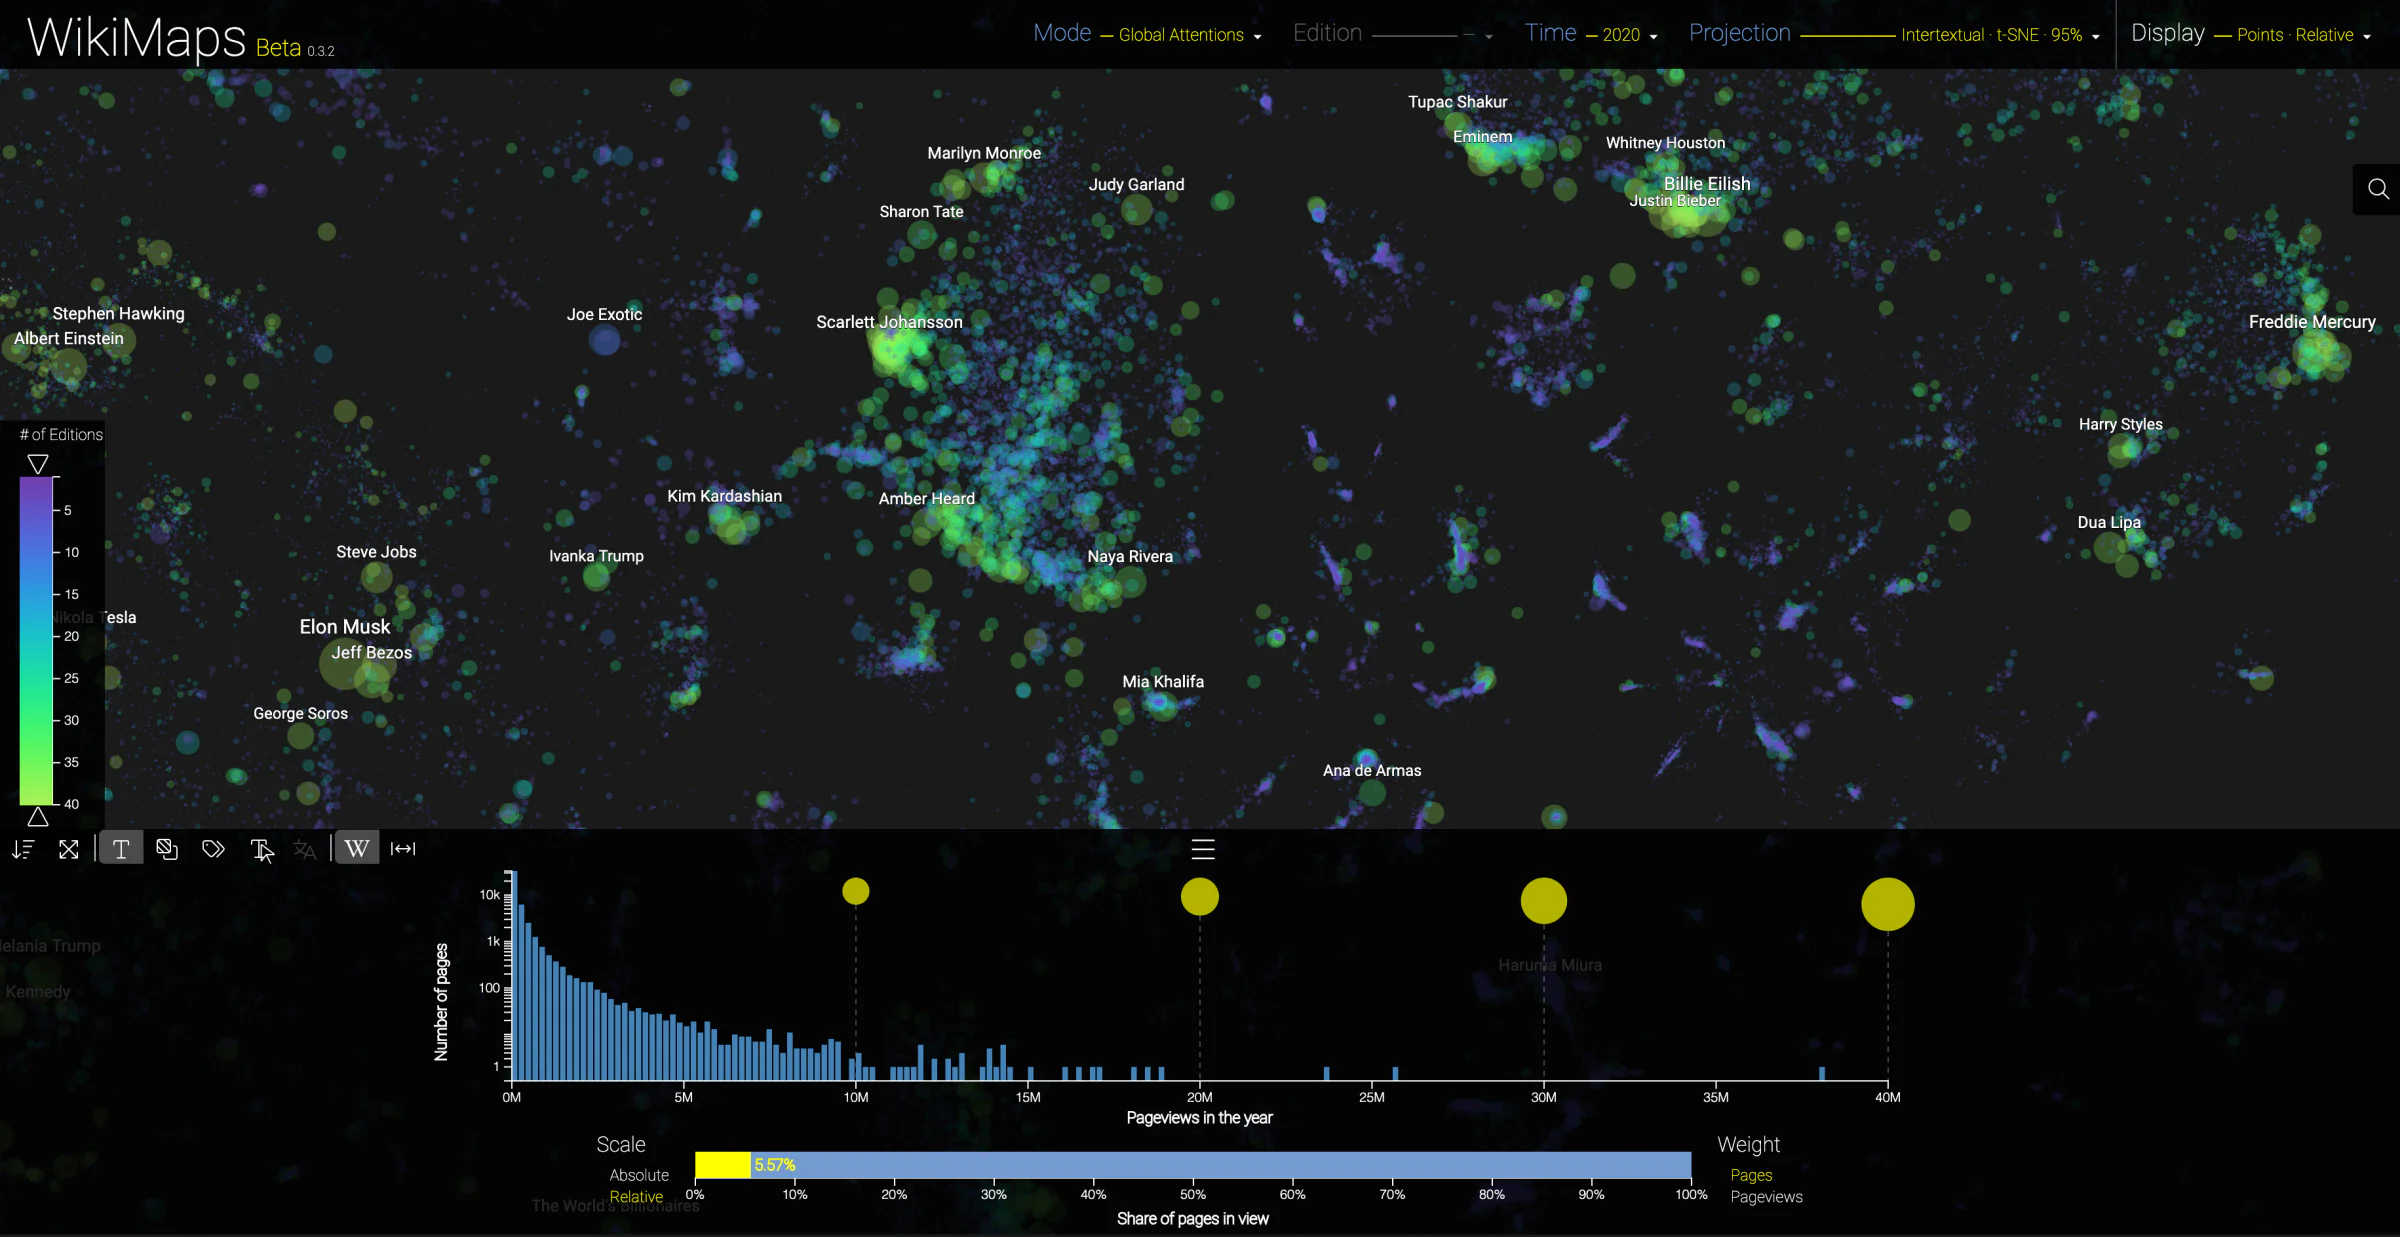
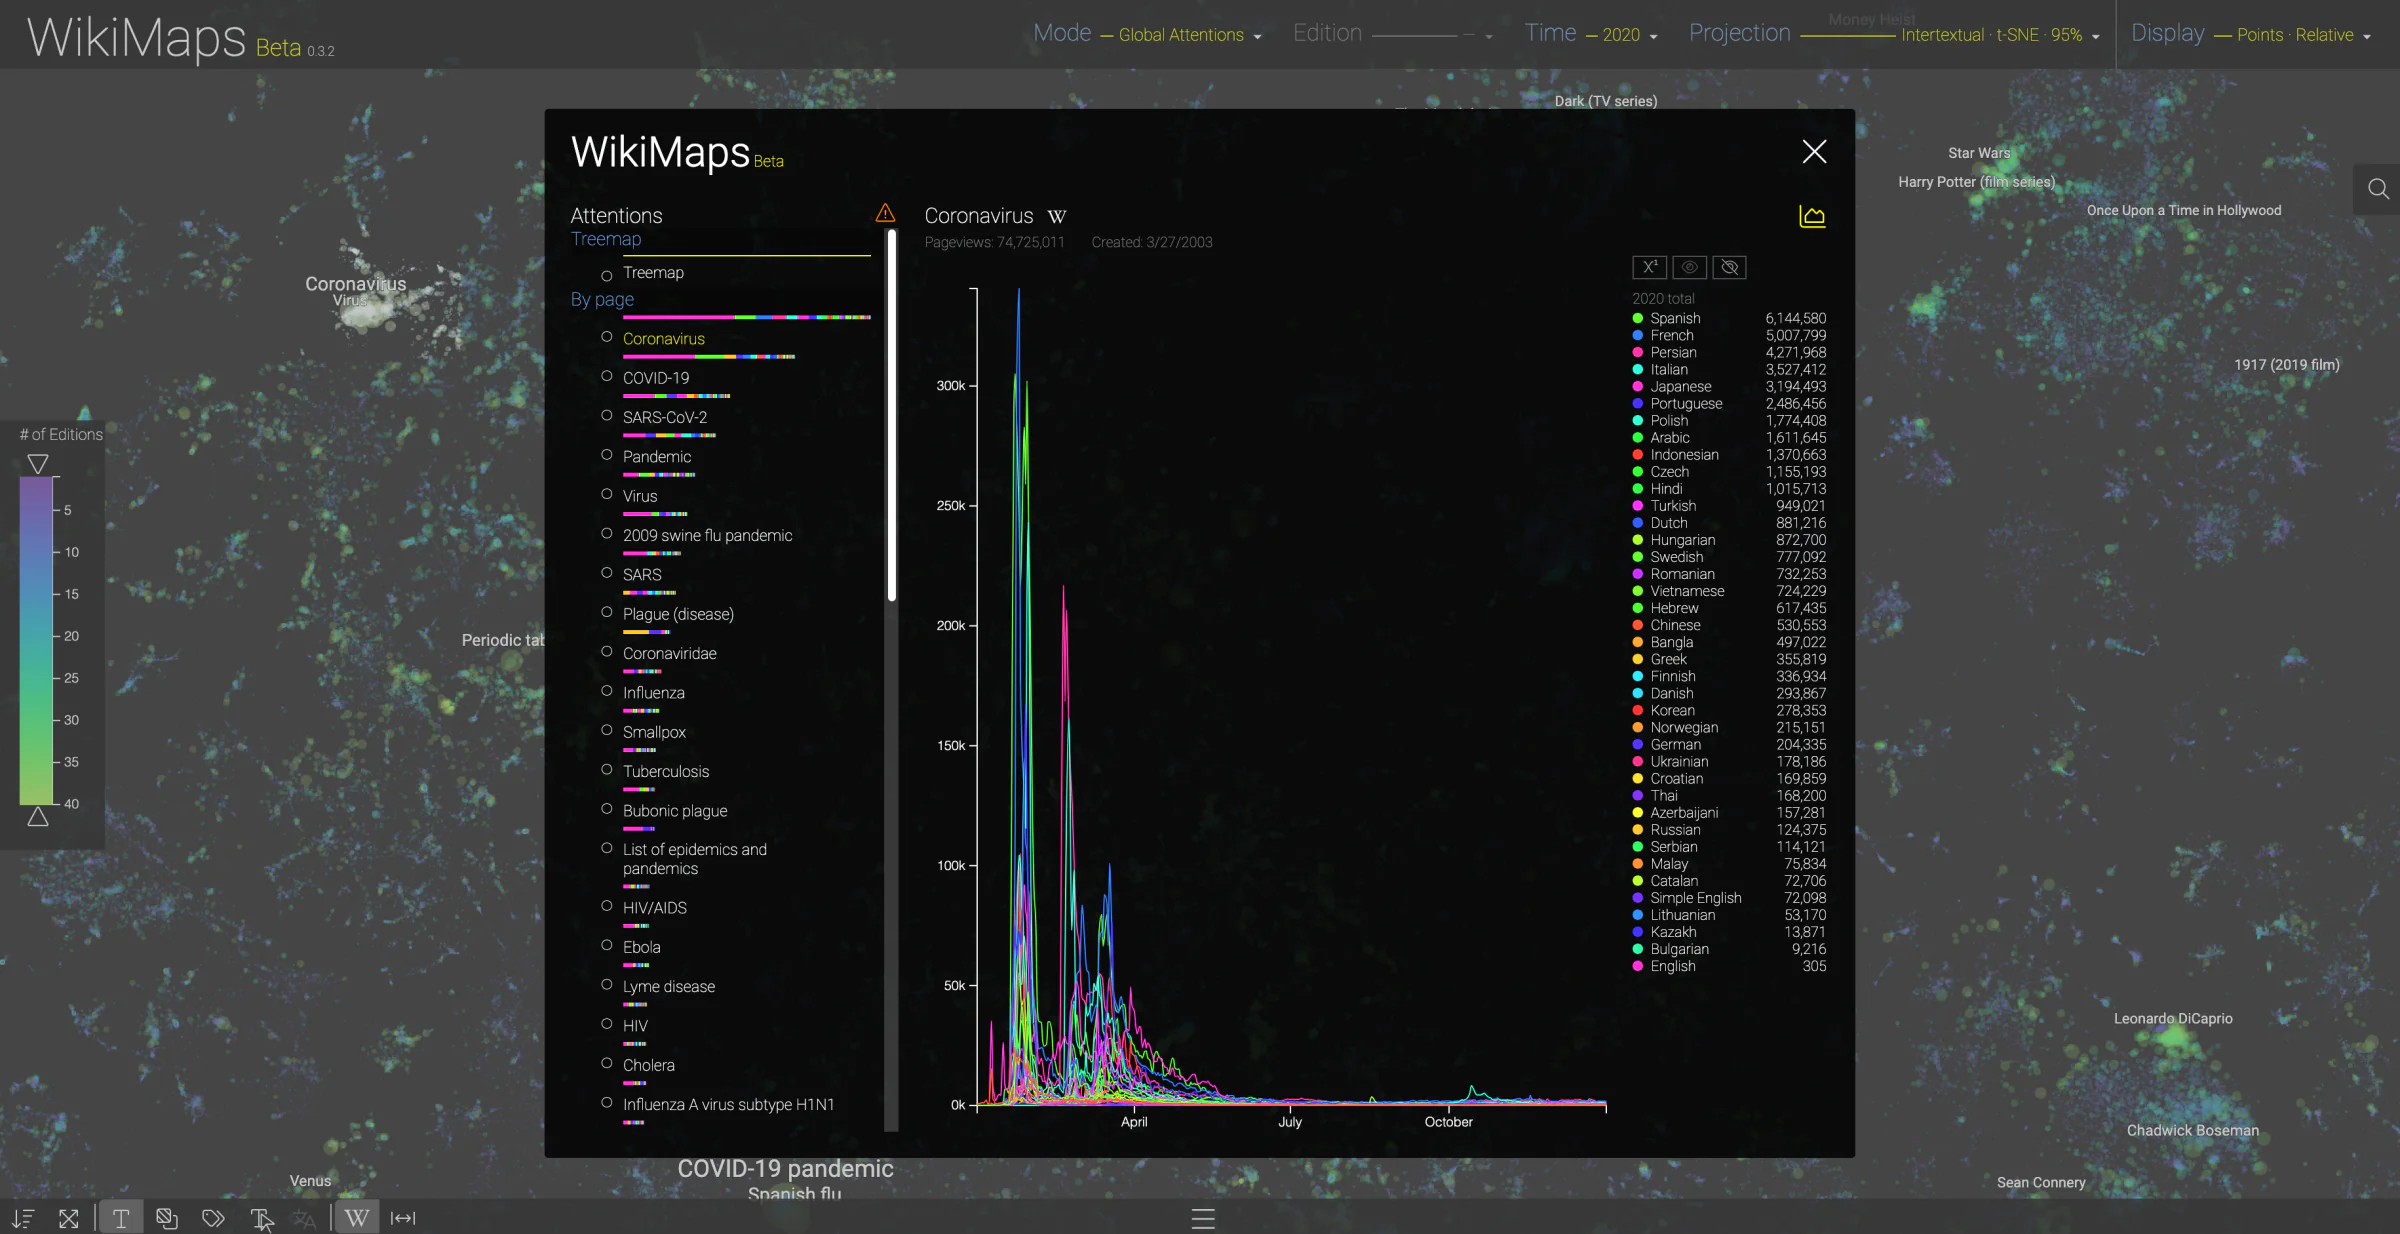
The distribution panel extends the legend of the previous version (see Legend): in the intertextual space of global attentions in 2020, health accounts for 0.79% of pages, personalities for 5.57%. The dashboard makes it possible to compare the pageviews of the same page in all editions: attention to Coronavirus peaked at the end of January 2020 in most editions, then in February and March in others.